
CHAPTER 9
DESIGN AUTOMATION OF NUCLEIC ACID REACTION SYSTEM SIMULATED BY CHEMICAL KINETICS BASED ON GRAPH REWRITING MODEL
Ibuki Kawamata
Department of Bioengineering and Robotics, Graduate School
of Engineering, Tohoku University, Miyagi, Japan
Masami Hagiya
Department of Computer Science, Graduate School of Information Science and
Technology, The University of Tokyo, Tokoyo, Japan
9.1 INTRODUCTION
Deoxyribonucleic acid (DNA) and ribonucleic acid (RNA) are used as a genetic information carrier and a functional module in nature. Gene regulatory network (GRN) focuses on the topology of how genes coded in DNA interact each other. In this chapter, we rather focus on direct interactions among nucleic acids than reactions through genes.
Specifically, we regard nucleic acids as a programmable material to directly implement artificial dynamic systems. Basic reactions employed in a system are simple base-pairing and enzymatic reactions. Functional systems, which we call nucleic acid reaction systems, can be programmed and driven by cascading such basic reactions.
Typical modules of nucleic acid reaction systems are combinatorial circuit [1, 2, 3], sensing switch [4, 5], and autonomous actuators [6, 7]. By combining such modules, applications such as molecular sensors [8, 9, 10], drug delivery system [11], cell diagnosis system [12], and implementation of neural network [13] have been demonstrated. Such systems are designed to contribute to subjects which can be categorized as follows: engineering nano-scale machines, reconstructing living organism, and the treatment of diseases.
To explore further complex systems, techniques to analyze and strategies to design a new module with the aid of a computer play an important role in the field. Straightforward way to represent nucleic acids and simulate their dynamic behaviour is employing atomic [14, 15] and coarse-grained [16, 17] models. Simulations based on such molecular dynamics, however, are computationally expensive to predict the behavior of large dynamic nucleic acid reaction systems. To overcome the problem, relatively abstract modeling, programming language, and frameworks for composable enzyme-free nucleic acid reaction systems have been proposed [18, 19, 2]. Computer-aided design tool is also developed for scaling up an enzymatic reaction network [20].
With such modeling and simulating techniques, however, designing nucleic acid reaction system that has desired functionality still requires human trial and error to find out a topology of interest. The design process becomes difficult when the number of molecular species in a system increases. It is because the whole network of the system is extremely large by cross-talks among nucleic acids, which makes it unintelligible to prevent undesired reactions.
To eliminate the human trial and error in the designing process, it is possible to apply an evolutionary computation using heuristic algorithms that search for a semi-optimal system. In the case of GRN, evolutionary computation has been successfully applied to various dynamic systems such as oscillatory behavior [21, 22]. Although the evolutionary computations had significant impact because of the design of nontrivial topologies, the designed GRNs were not so easy to implement as actual systems. One of the reasons for the problem comes from unrealistic models employed in the design of GRN. For instance, the models are based on pseudo-gene [23], simple network [24, 25], and a combination of standard parts library [26]. Those models are in the higher level of abstraction and assume unrealizable properties of genes and their regulation. For actual implementation, a system composed of nucleic acids has more advantage than GRN because they are programmable materials and their reactions are realizable as simple chemical reactions [27].
We introduce our original approaches to model, simulate, and automatically design nucleic acid reaction systems with desired functions. This chapter is composed of five sections, which are arranged in the following order. In Section 9.1, we have overviewed the potential applications of nucleic acid reaction systems and pointed out the problems of conventional modeling, simulation, and designing methods. In Section 9.2, our graph-based modeling of nucleic acids is illustrated using simple examples. In Section 9.3, we explain a technique to simulate a nucleic acid reaction system represented by our graph-based modeling. Section 9.4 describes our automatic design algorithm capable of searching for a system with desired function. Finally we discuss the limitations of our approaches in Section 9.5.
9.2 NUCLEIC ACID REACTION SYSTEM
9.2.1 Domain-Level Modeling
Basic properties and a standard representation of nucleic acid reaction systems are first explained. From a chemical point of view, a strand of DNA is a polymer of deoxyribonucleotide monomers. Each nucleotide contains one of the four bases adenine, thymine, guanine, and cytosine (written as “A”, “T”, “G”, and “C”, respectively). On the other hand, RNA is a polymer of ribonucleotide monomers, which employs “U” (uracil) instead of “T.” Due to the chemical structure of each base, nucleotides are capable of forming hydrogen bonds between complementary pairs (“A”-“T” and “G”-“C” for DNA and “A”-“U” and “G”-“C” for RNA). As a consequence, two complementary strands hybridize into a well known double stranded structure [28]. To illustrate dynamic systems, a simple representation of nucleic acids has been exploited (Figure 9.1), which focuses on the topological information of DNA [29, 30]. In the representation, single stranded DNA (ssDNA) is drawn as a straight arrow representing the direction from 5′ to 3′ ends of DNA. Only complementary strands in anti-parallel directions can hybridize. A sequence of nucleotides is divided into subsequences in accordance with reaction units (called domain or abstract base), where each unit is denoted by a letter. We use uppercase and lowercase letters to represent complementary domains and connect them by a line that corresponds to hydrogen bonds.
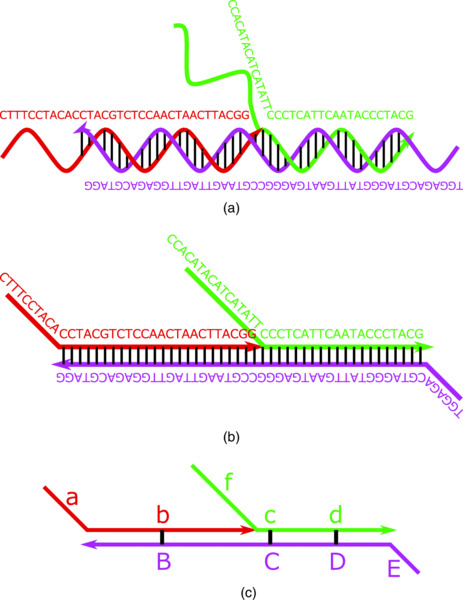
Figure 9.1 Domain level representation is explained in a step-by-step manner using DNA catalytic gate [31] as an example. (a) All sequences of nucleotides and hydrogen bonds are shown using double helical arrows and lines. (b) Single stranded DNA is represented as a straight arrow. (c) Letters are allocated to domains that are units of reactions.
Nucleic acid reaction systems using RNA can be also represented by the domain level representation. To distinguish RNA from DNA, zigzag arrow is assigned for RNA [32]. Since DNA is more stable and less reactive compared with RNA, one can select DNA or RNA (or both of them) as a material for nucleic acid reaction system depending on interest. For example, DNA is favorable for constructing a dynamic nano-scale device that requires geometric structure [33, 34]. In contrast, it is possible to take advantage of RNA to moderate gene expressions by a mechanism called RNA interference (RNAi) [35, 36, 37].
9.2.2 Hydrogen Bond Reactions
Dynamics of reaction systems can be achieved by repeating basic reactions of nucleic acids. We exploit two types of reactions—hydrogen bond and enzymatic reactions. The reactions of hydrogen bond are classified into three basic reactions, which are hybridization, denaturation, and branch migration. In contrast, the variation of enzymes can cause a wide variety of basic reactions.
In the domain level representation, hybridization and denaturation are association and dissociation between complementary domains, respectively. By branch migration, unhybridized domain displaces neighboring hybridized domain that has the same sequence.
Only the three hydrogen bond reactions (simply called hybridization reactions) take place in the example of catalytic reaction (Figure 9.2). Without a catalyst, the substrate and the fuel cannot react because domains of the substrate are not accessible to the fuel strand. In the presence of the input, however, they hybridize together and release the output and the signal strands. Since the input serves as catalyst that can promote multiple cycles of reactions, the concentration of output can be larger than that of input.

Figure 9.2 Hydrogen bond reactions of catalytic gate [31]. One cycle of reaction starts from the top and continue in anticlockwise direction. The gate consists of the substrate (S) and the fuel (F), while the catalyst (C) serves as an input of the gate. S and C first hybridize together and result in an intermediate structure. By branch migration and denaturation, the structure separates into the signal (G) and the intermediate 1 (I1). The I1 and the F turn into the intermediate 2 (I2) and the output (O) by another sequential hybridization and branch migration. Finally, I2 releases C and becomes the waste product (W) by denaturation.
9.2.3 Enzymatic Reactions
Further functionalities can be implemented by employing enzymatic reactions. Enzymes that react with nucleic acids include, but not limited to, polymerase, nuclease, and ligase. Polymerase synthesizes a new sequence that is complementary to template nucleic acids. The polymerase is called DNA-directed or RNA-directed polymerase depending on the nucleic acids of the template. Furthermore, depending on nucleic acids of the newly synthesized strand, it is called DNA or RNA polymerase. For example, RNA-directed DNA polymerase synthesizes a new DNA strand from RNA template.
DNA polymerase is fundamentally primer-dependent, in which the enzyme always extends the 3′ end of primer strands. This type of polymerase has been exploited to amplify the amount of DNA by polymerase chain reaction (PCR) to detect small amount of DNA. On the other hand, some of RNA polymerases employ primer-independent polymerization. If a new RNA strand is polymerized from double stranded DNA (dsDNA) template starting from a special promoter region, the reaction is called transcription.
Nucleases cleave phosphate backbone of nucleic acids in various manners. For instance, DNA and RNA are decomposed by deoxyribo- and ribo-nuclease, respectively. In contrast, ligase join 3′ and 5′ ends of two DNA strands, which plays an important role in replicating DNA [38].
Reverse-transcription-and-transcription-based autonomous computing system (RTRACS) [32, 39, 40] makes use of polymerization reactions to implement a logic operation (Figure 9.3). The primer ssDNA of RTRCS is extended by a collaboration of two ssRNA inputs and polymerization. The extended structure and the converter then form a full duplex DNA structure by hybridization and polymerization. Promoter region in the double stranded structure is recognized by a primer-independent polymerase to initiate transcription. The system can be regarded as an AND gate because the output ssRNA is synthesized if and only if both inputs are given.

Figure 9.3 Enzymatic reactions of the AND gate of RTRACS [32]. The gate consists of DNA primer and converter, while the inputs and output are ssRNA. After the primer and the input 1 hybridize together, the primer is extended by an RNA-directed primer-dependent DNA polymerase. Ribo-nuclease then decomposes only the input 1. The remained ssDNA hybridizes to the input 2 for another polymerization and decomposition, which results in a partially double stranded DNA. The structure hybridizes to the converter and forms fully double stranded DNA by polymerization. Since promoter region (indicated by “T” in the figure) becomes double stranded, downstream of the dsDNA is transcribed to the output by a primer-independent RNA polymerization.
9.2.4 Graph-Based Model
To systematically predict the dynamic behavior of a nucleic acid reaction system, we propose a model based on a graph data structure that is derived from the domain level representation. As an example, the graph-based model of three examples including the DNA catalytic gate are shown in Figure 9.4. We represent domains, hydrogen bonds, and phosphate backbones as nodes, undirected edges, and directed edges of graph data structure, respectively. The advantage of the model compared with other conventional models is the flexibility to represent various secondary structures of nucleic acids. A flexible representation is useful not only for the semi-automated simulation of nucleic acid reaction systems but also for the design of modules that take advantage of complex structures of nucleic acids.

Figure 9.4 Graph-based models of the (a) catalytic gate [31], (b) hairpin loop, (c) bulge loop, and pseudoknot. Domain level representations and corresponding graph-based models are shown in the top and the bottom of the figure, respectively. Domain “c” of (b), “b” of (c), and from “d” to “F” of (c) are hairpin loop, bulge loop, and pseudoknot, respectively. We surround a connected graph with a rectangle shape because a connected graph corresponds to one molecule.
One parameter is allocated to each domain in order to tell the differences among domains. The parameter corresponds to the length of nucleotides sequence in a domain. As shown in the domain level representation of the DNA catalytic gate (Figure 9.1), 10, 24, 4, 16, 6, and 16 are allocated to the domains “a”, “b”, “c”, “d”, “e”, and “f” in Figure 9.4(a), respectively. The parameter determines the kinetic constant of denaturation reaction, which is explained in detail in the next simulation section.
We further model basic chemical reactions to systematically illustrate the topology of nucleic acid reaction systems. Since a DNA molecule is represented by a graph based model, a chemical reaction is defined as a transformation of graph, or graph rewriting. A graph rewriting rule is in a form L → R that is similar to normal chemical equation. L and R correspond to patterns of graph data structures before and after the reaction of the rewriting rule, respectively. By replacing a subgraph that matches L into R, a new graph is derived from a graph. The topology of the catalytic gate is shown in Figure 9.5 as an example. All basic rewriting rules are summarized in the following section.

Figure 9.5 Transition of graph-based model of the catalytic gate [31] by applying graph rewriting rules. The figure is arranged in the same way as Figure 9.2. Although each reaction corresponds to a transition of graphs, the transition of branch migration reaction is applied twice for the reaction on the right to displace both “b” and “d” at once. A graph can be separated into multiple connected graphs as a result of graph transitions such as branch migration and denaturation.
9.3 SIMULATION BY CHEMICAL KINETICS
9.3.1 Enumeration of Structure
The graph rewriting model provides a simulation method based on chemical kinetics. From an initial configuration, ordinary differential equations (ODEs) can be systematically built. The initial configuration is a set of structures and their concentrations. By numerically solving the ODEs, the dynamic behavior of a system can be predicted. Our simulator has two parts of calculations: enumerating structures that are producible from initial configuration and analyzing the concentration changes by a numerical method.
At the beginning of a simulation, the simulator enumerates whole structures in a system to determine the number of variables. By iteratively applying rewriting rules from the initial configuration, all the producible structures are derived. During the enumeration, the simulator prohibits a structure that contains multiple identical strands because it is necessary to prevent an explosion of structure space.
After the enumeration process, the simulator assigns variables, which represent concentrations of molecules, to all the structures. Based on chemical kinetics, the simulator formalizes ODE for each variable. The ODEs are numerically solved to predict the time evolution of the concentrations of molecules. We actually carry a standard numerical calculation called Runge–Kutta–Fehlberg-4,5 method to solve the ODEs [41]. The rate constants of basic reactions are defined by changing the order of magnitude while the units of concentration and time are arbitrary.
Transitions of basic rewriting rules for hybridization reactions are summarized in Table 9.1. Although the rate constants of hybridization and branch migration are fixed, that of denaturation depends on the length parameter. Suppose the length parameter of a domain to dissociate is l, the rate constant kd is calculated by 8.0 × ( − 2)l. The function is chosen because we assume that the free energy of double helix decreases proportional to the length of nucleotide sequence [42]. Note that time-derivation term of each structure becomes a summation of all expressions of possible reactions. For example, if both bimolecular hybridization and denaturation reactions in the Table 9.1 take place, the term of C2 is formalized as ![]() .
.
Table 9.1 Transition by basic hybridization reactions. Basic rewriting rules of hybridization reactions are summarized
| Reaction name | Schematic example | Equations | Rate constant |
| Bimolecular hybridization |  |
kh1 = 0.1 | |
| Unimolecular hybridization by extending |  |
kh2 = 1.0 | |
| Unimolecular hybridization with interval |  |
kh3 = 0.1 | |
| Denaturation |  |
kd is defined as a function | |
| Branch migration |  |
kb = 0.01 |
First column describes the name of reaction rule. Second column illustrates a typical example of graph rewriting by applying the reaction rule. Concentration of a structure is denoted by a variable written in the upper left of the rectangle that is surrounding the structure. ODEs and rate constant for the reaction rule are listed in the third and fourth column, respectively.
Similarly, basic rewriting rules of enzymatic reactions are summarized in Table 9.2. Unlike the hybridization reactions, rules of enzymatic reactions are capable of operating directed arrows that represent phosphate backbones of nucleic acids. Any enzymatic reactions that produce a structure with more than two identical strands are also prohibited as in the case of hybridization reactions.
Table 9.2 Transition by basic enzymatic reactions. Meaning of columns are the same as in the previous Table
| Reaction name | Schematic example | Equations | Rate constant |
| Primer-dependent DNA-directed DNA polymerization |
 |
kddd = 0.005 | |
| Primer-dependent RNA-directed DNA polymerization |
 |
kdrd = 0.005 | |
| Primer-dependent RNA-directed RNA polymerization |
 |
kdrr = 0.005 | |
| Primer-independent DNA-directed RNA polymerization |
 |
kidr = 0.005 | |
| Decay |  |
kdecay = 0.001 |
Nodes of RNA are represented by zigzag shapes, which is consistent with the domain level representation of RTRCS. In the case of primer-independent DNA-directed RNA polymerization, downstream of promoter double stranded domain ‘T’ is transcribed to an mRNA. By a decay reaction, all the RNA nodes disappear from a graph. When the result of graph rewriting by a decay reaction is an empty graph, it is denoted by Φ.
Even the simulator prohibits some reactions, combinatorial explosion of structure space is inevitable. To ignore unimportant structures that may not be the main products of a system, we introduce a threshold. Structures that have a concentration lower than 10− 5 are disregarded. By the threshold, the rewriting rules are applied to produce new structures only when the enumeration process becomes necessary. The simulator produces structures dynamically and checks whether the concentration of each structure exceeds the threshold. To be more precise, the duration of a simulation is divided into intervals so that the simulator is able to check the concentration at the beginning of each interval.
9.3.2 Time Evolution of Catalytic Gate and RTRACS
To show that graph-based model is capable of predicting the behavior of nucleic acid reaction systems, the catalytic gate [31] and the AND gate of RTRACS [32] are selected as benchmarks. The result of kinetic simulations of the catalytic gate is shown in Figure 9.6. Catalytic amplification was verified because the concentration of output increased higher than that of input in most of the cases. The results were in good agreement with the experimental results shown in the original paper. We then simulated the AND gate of RTRACS [32] to examine the effect of enzymatic reactions. As in the result (Figure 9.7), the concentration of RNA output increased if and only if both RNA inputs were added. Since the output is synthesized by transcription, the concentration of output showed no increase for the false combinations of inputs where promoter region cannot form dsDNA. This result indicates that the simulator can predict the behavior of a nucleic acid reaction system driven by enzymatic reactions. It is possible to adapt the simulator for further design automation by using the simulator as a tool to evaluate nucleic acid reaction systems.

Figure 9.6 Simulation result of the catalytic gate [31]. x and y axes are time and concentration of the output strand, respectively. First changes in first 2000 time units were caused by making a gate. Input was added at 2000 time units, which leads to the increase of the concentration of output. The graph legends indicate the concentration of input. When the concentration of input was 0.01, that of output did not increase because the concentration of input was too small so that an intermediate structure could not exceed the threshold.

Figure 9.7 Simulation result of the AND gate of RTRACS [32]. x and y axes are time and concentration of the output strand, respectively. The inputs were added at 1000 time units. The concentration of the output began to increase from about 2000 time units when both of the inputs were added. The graph legends indicate the combination of inputs.
9.4 AUTOMATIC DESIGN OF NUCLEIC ACID REACTION SYSTEM
9.4.1 Algorithm of Evolutionary Computation
In this section, our strategy and the results of automatic design of nucleic acid reaction systems are explained. First, we briefly overview genetic algorithm (Figure 9.8). The algorithm tries to maximize a fitness value, which is a typical approach for combinatorial optimization problem.

Figure 9.8 Flowchart of automatic design algorithm. After generating a set of random initial candidates, the algorithm iterates the process of simulation, evaluation, selection, and generation until the terminal condition is satisfied.
Starting from a set of randomly generated candidates, the algorithm searches for a topology with bigger fitness value by iterating from one generation to another. Fitness value of each candidate is first calculated by predicting the dynamical behavior of the candidate. A new set of candidates is then generated by using two operations, which are crossover and mutation. After that, fitness values are again calculated for the new candidates. From old and new sets, the algorithm selects candidates with higher fitness values and keeps them as a current set. After iterating the processes, the method outputs a system with the biggest fitness value among produced candidates as a semi-optimal solution.
9.4.2 Genotype of Nucleic Acid Reaction System
The target of our evolutionary algorithm is a gate made of nucleic acid reaction system. To carry the algorithm, a model to represent genotype, a method to predict its phenotype, an evaluation function to calculate the fitness, and operations of crossover and mutation over the genotype are necessary. As a genotype of a single candidate, we adopted sequences of letters. The genotype defines the search space of the algorithm.
We chose 13 letters as an alphabet, which consists of letters from “a” to “f”, from “A” to “F,” and null letter. A genotype of a gate is represented as a sequence of 16 letters, which are divided into four four-letter sequences. The alphabet is regarded as a set of domains for nucleic acid reactions while each four-letter sequence corresponds to a single stranded nucleic acids. Once a candidate is represented by a sequence of letters, it is possible to chemically implement the system by applying sequence design method to each domain.
The null letter is included in the alphabet to represent a strand with less than four letters and a gate with less than four strands. These parameters such as 13 and 16 that restrict the search space are imposed to eliminate an ineffective search. The parameters may be adjusted depending on the function of interest in order to optimize the search space of the automatic design.
For example, a genotype in the following sequence of letters
represents the substrate of the catalytic gate whose phenotype is shown by a graph-based model in Figure 9.4(a). Thanks to the flexibility of the graph-based model, the search space comprises a system that utilizes various secondary structures such as hairpin loop, bulge loop, and pseudoknot. To simplify the notation, the genotype is described by ignoring null letters. The example can be written as “ab”, “fcb”, “EDCB”.
To represent inputs to the gate, additional sequences are introduced to the genotype depending on the target. We target two types of gates, one of which is a combinatorial circuit (logic gate) and the other is a state transition machine (automaton). In the case of logic gate that utilizes single stranded nucleic acids as inputs, two four-letter sequences are added to the genotype to represent the input strands. In contrast, two letters are added for the automaton to represent domains that are stimulated by inputs.
By those definitions, a random candidate can be generated by randomly choosing 24 (for logic gate) and 18 (for automaton) letters from the alphabet. The size of the set of candidates is set to be 256. The length parameter of each domain is also randomly chosen between 3 and 34 for each trial of evolutionary computation.
The operations of crossover and mutation are defined in a straightforward manner. For the crossover, one positions of the letters is randomly selected. From two candidates, a new candidate is generated by swapping letters after the position (known as one-point crossover). A mutation is defined as an operation to flip a randomly chosen letter into another random letter. More precisely, the mutated candidate is produced by repeating such flip for random times (five times at most).
9.4.3 Simulation of Phenotype, Generation, and Selection
The graph-based model is capable of simulating the dynamic behavior of a given genotype. A gate is constituted by hierarchical simulations, in which four strands are simulated separately in the beginning. Then, the results of the first two simulations are merged for another round of simulations, while the same simulation is carried for the last two. Finally, both results are further merged and simulated to constitute a gate, to which inputs can cause successive reactions.
From the result of the simulation, a fitness value is calculated by an evaluation function. The evaluation functions differ from target to target depending on the function of interest. Concrete definitions of the evaluation functions of logic gate and automaton are explained in Sections 9.4.4 and 9.4.5, respectively.
For a new set, 256 new candidates are generated from the current set one by one. One candidate is generated by either crossover or mutation. The probability to choose crossover is 50% and to choose mutation is also 50%. We set relatively high probability for the mutation because the effect of mutation was large in our problem. In the case of crossover, two candidates are chosen from the current sets with the probability proportional to the fitness value (known as roulette wheel selection). The same probability is also applied for mutation though only one candidate is chosen.
When a new set is generated, the current set becomes an old set. After evaluating the new set, top 50% of the candidates among the old and the new sets are selected for the next current set. As a terminal condition, we run the algorithm for 100 and 200 generations for the designs of logic gate and automaton, respectively.
9.4.4 Evaluation Function of Logic Gate
To calculate a fitness value that determines how well a system behaves as a desired system, an evaluation function is required. We define the evaluation function of a logic gate by three criteria. The first criterion v1 is calculated as
where S is a set of single stranded structures in a system, and T(s) and F(s) are sets of concentrations of single strand s after simulations by adding specific combinations of inputs to the gate. T(s) contains only the results from the combinations of inputs that satisfy the logic, while F(s) contains only the results from the combinations of inputs that do not satisfy the logic.
In an AND gate for example, T(s) has only one element that is the concentration of s after simulating with both inputs. In contrast, F(s) has three elements that are the concentrations of s after simulations with remaining three combinations. This value indicates the smallest difference between true and false states, which means how well the system works as desired logic gate.
The second criterion v2 is given as
where S, T(s) and F(s) are the same sets in the first criterion, and average calculates an average value from the elements of a given set. This criterion is introduced to make the evaluation function smoother.
The last criterion v3 is calculated as
where C(s) = T(s)∪F(s). This value indicates how well each strand is involved in the reaction, which is an important factor to minimize unnecessary strands.
Finally, the fitness value of a candidate is calculated as a weighted average of these criteria by a function
The output of the gate is dynamically selected in the process of evaluation by
which is a strand that decides v1.
9.4.5 Evaluation Function of Automaton
Another target is an automaton in which the order of inputs can control the output. We assume that the automaton is a gate composed of DNA that has the following features.
- The gate has two inputs and one output.
- Inputs to the gate are a small molecule and light that block the hydrogen bond between complementary domains.
- Other state transitions of the gate are driven by hybridization reactions.
- The final states of the automaton can be different if the orders to add inputs are different.
- The gate emits the output when the state changes to one of the final states.
To apply the automatic design method to the automaton, we extended the simulator to support the second feature.
Extended version of the simulator has an operation to change the rate constants of hybridization and denaturation of specific domain at specific time units. If the operation is executed, the rate constants of hybridization and denaturation turn to 0.0 and 1.0, respectively, which leads to the separation of the domains. For chemical implementation of such feature, the strategies of ATP [43] and UV [44] sensors can be adopted.
To evaluate an automaton, we defined an evaluation function by the following expression,
where C1, 2(s) and C2, 1(s) are the concentrations of the structure s after simulations that adds inputs in the orders denoted by the indexes. This fitness value indicates the difference between the two ordering of inputs, and we can distinguish the two states when this fitness value is large. Similar to the logic gate, the output of the gate is dynamically selected during the evaluation process by
9.4.6 Automatically Designed Logic Gates Driven by Hybridization Reaction
As a result of executing the automatic design method, logic gates with novel topologies were successfully designed. Examples of OR and AND gates utilizing only hybridization reaction are shown in Figures 9.9 and 9.10, respectively. Note that letters and its order of the genotype are rearranged to make them intuitively understandable. Because unused domains do not effect the evaluation function, such domains can be preserved during the evolution process.

Figure 9.9 Designed enzyme-free OR gate. Obtained genotypes of the gate were “cab,” and “A”, while those of inputs were “BA” and “BAD”. (a) Two transitions to produce the output with either of inputs are illustrated. Domains “c” and “D” were unused for the reaction. (b) The simulation result of the OR gate is shown. x and y axes are time and concentration of the output, respectively. The concentration of output increased if at least one input was added at 1000 time units.

Figure 9.10 Designed enzyme-free AND gate. Obtained genotypes of the gate were “A,” “ba,” and “dca,” while those of inputs were “AB” and “AC.” (a) Transitions to produce the output with both inputs are illustrated. Domain “d” was unused for the reaction. (b) The simulation result of the AND gate is shown. x and y axes are time and concentration of the output, respectively. The concentration of the output increases if and only if both inputs are added at 1000 time units.
In the designed OR gate, both input 1 and input 2 can release the output by sequential hybridization and branch migration. The design of OR gate was too simple so that all trials of evolutionary computation converged to a system that had the same topology.
In the designed AND gate, the gate and input 1 first hybridize to temporarily release the output which will hybridize to the remaining gate immediately. Eventually, input 2 can completely release the output. The evolutions of the highest fitness value among candidates in respect to the number of generation are shown in Figure 9.11. The evolutions were successively achieved for all trials because fitness values converged to relatively high values (bigger than 0.75). Interestingly, the designs of AND gate did not converge to a single topology, which indicates that AND operation can be achieved by multiple topologies.

Figure 9.11 Evolutions of fitness values of the AND gate. x and y axes are the generation and fitness value, respectively. Each line connects a sequence of plots, which reflects the transition of the highest fitness value in candidates during the evolutionary computation. All the trials obtained relatively high fitness values.
9.4.7 Automatically Designed AND Gate Driven by Enzymatic Reaction
To demonstrate the ability of the kinetic simulator and the automatic design method, a logic gate that utilizes enzymatic reaction was also designed. The gate consists of DNA while inputs and output of the gate are RNA, which is inspired from RTRACS. The enzymatic reactions involved in the system are also the same to RTRACS, that are decay, primer-dependent DNA polymerization, and transcription.
The designed AND gate is shown in Figure 9.12, in which the gate first hybridizes to input 1 and then, the 3′ end of DNA strand is extend by polymerization. After a decay reaction of input 1, input 2 hybridizes to the extended domain. By extending hybridized input 2, the promoter region denoted by “T” become double stranded DNA. The downstream of the promoter is transcribed to produce the output RNA.

Figure 9.12 Designed AND gate that utilizes enzyamtic reactions. Obtained genotypes of the gate were “CTA,” and “c”, while those of inputs were “Bat” and “B”. (a) The gate and its transitions to produce the output with both inputs are illustrated. (b) The simulation result of the AND gate is shown. x and y axes are time and concentration of the output, respectively. The concentration of output increased if and only if both inputs were added.
Although the mechanism of the behavior of the gate was similar to that of RTRACS, the topology of the system was not the same. The result indicates that our methodology can apply to design a system using not only DNA but also RNA and enzymatic reactions.
9.4.8 Automatically Designed Automaton Sensing the Stimuli from Environment
The design of logic gates was rather regarded as a proof of concept, because important criteria to cascade such gates were not included. For example, one of the inputs of the OR gate or enzymatic AND gate was a subsequence of the other input. Such properties are undesirable to implement a logic circuit by integrating multiple modules in a real system.
The design of the automaton does not need to care such undesirable phenomenon. This is because the inputs of the automaton are assumed to be irrelevant to each other. Furthermore, the output of the automaton is rather a dynamic control of nucleic acids than a cascadable single strand.
One of the nontrivial designed automaton by the algorithm is illustrated in Figure 9.13. In the initial state, the gate is in one of the two states which can switch back and forth by branch migration reactions. When either of inputs is added, the systems promotes the reaction irreversibly.
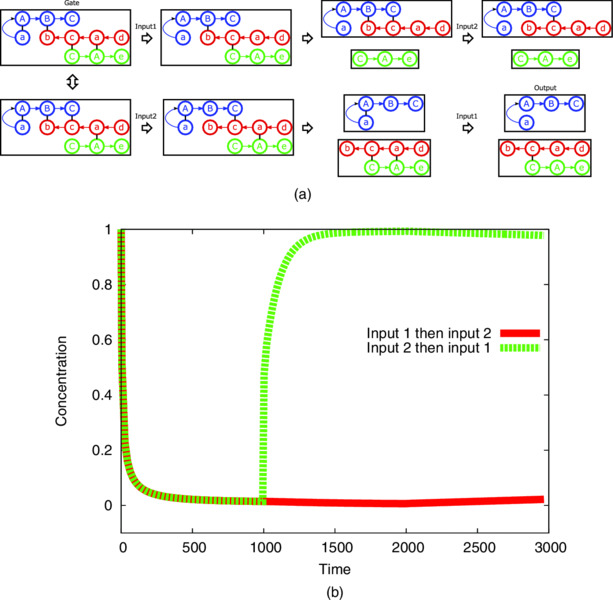
Figure 9.13 Designed automaton. Obtained genotypes of the gate were “aABC”, “dacb”, and “CAe”, while the domains to be blocked by inputs were “a” and “b.” (a) Transitions to produce the output with two ordering of inputs are illustrated. Domains “d” and “e” were unused for the reaction. (b) The simulation result of the automaton is shown. x and y axes are time and concentration of the output, respectively. First and second inputs are added in 1000 and 2000 time units. The concentration of output increased if input 2 was added before input 1.
By input 1, hybridization between domains “a” and “A” is blocked. The reaction keeps the output connected to the gate. Subsequent input 2 blocks the hybridization between “b” and “B,” which has nothing to do with the output. In contrast, when the connection between “b” and “B” is first blocked by input 2, the output is released by a branch migration reaction. Subsequent input 1 does not affect the output. The reaction mechanism of this topology matches the features of desired automaton.
The evolutions of fitness values among five trials are shown in Figure 9.14. Unlike the design of enzyme-free AND gate, some of the trials to design the automaton did not reach high fitness values. Even in the successive trials, the number of generations required to obtain the solution was longer than the design of AND gate. This may be due to the complexity of the function.

Figure 9.14 Evolutions of fitness values of the automaton. x and y axes are the generation and fitness value, respectively. Each line connects a sequence of plots, which reflects the transition of the highest fitness value in candidates during the evolutionary computation. Although trials 1, 2, and 5 obtained relatively high fitness values, trials 3 and 4 did not.
9.5 DISCUSSION AND CONCLUSION
9.5.1 Discussion
In this section, we discuss the advantages and limitations of our methods by comparing with related researches.
One of the strongest points of the proposed graph-based model was the ability to represent various structures of nucleic acids. Flexible representation of nucleic acid was important because conventional modules have taken the advantage of various secondary structures such as hairpin loop [45], nonlinear structure [46], and kissing structure [47]. The model was capable of analyzing and designing such modules due to a flexible representation by graph. In contrast, conventional techniques to analyze and design reaction systems limited the structure of nucleic acids to hairpin loop [18], linear structure [19], and simple gate [2].
The flexibility of graph-based model allowed the representation of various chemical reactions as rewriting rules. In general, graph rewriting has been commonly applied in chemistry [48], molecular biology [49], and biological pathway [50]. In this chapter, we proposed a set of transition rules for nucleic acid reactions, which were directed to analyze and design nucleic acid reaction systems with hybridization and enzymatic reactions.
The target structures of the graph-based model were nucleic acids with Watson–Crick complementary hydrogen bonds and normal phosphate backbone. Nodes of the graph-based model have at most one for each undirected, incoming directed, and outgoing directed edges. Obviously, the model does not cover other structures such as triplex with Hoogsteen base pairs [51], G-quadruplex [52], and so on. Hydroxy group modification of the end of phosphate backbone was also not supported, although the information is important for some enzymatic reactions such as ligation.
We applied the graph-based model to predict the dynamic behavior of a system by solving ODE-based on chemical kinetics. Conventional programming languages and simulation techniques for nucleic acid reaction system, however, were further applied to a model checking of chemical system [53], integrating large scale circuit [54], and the implementation of arbitrary chemical reactions [27] with the aid of limitations of those models. In contrast, our simulation technique cannot be directly applied to such purposes since the combinatorial explosion became a crucial problem.
Our simulation method did not thoroughly apply all possible rewriting rules due to the threshold and the restriction on graph imposed in order to minimize the number of structures. The threshold was introduced to eliminate unimportant structures, which leads to an efficient simulation. Simulation becomes incorrect, however, when the concentration of important structure cannot exceed the threshold. Without the restriction on graph, the simulation can spontaneously produce unbounded number of structures, which made the simulation intractable.
We focused on continuous simulations because target nucleic acid reaction systems follow the law of mass action. Our graph rewriting model, however, can be directly applied to stochastic simulation [55]. In that case, fitness value of nucleic acid reaction system always differs for each run, which may require further refinement for evolutionary computation.
Applying simulation technique to design a new topology of nucleic acid reaction by evolutionary computation is our original idea. In the area of genetic network, such evolutionary computations were commonly applied to design an interesting topology (e.g., oscillatory behavior). Some of them were based on graph models [24, 25]. In those researches, however, the implementation of the designed topology into a real gene regulatory network seems extremely difficult because inverse problem to construct genes from given topology was a challenging task to solve. On the other hand, nucleic acid reaction system is ready for implementation because sequence design methods using other types of evolutionary computations are well researched [56, 57].
In fact, we implemented the automatically designed enzyme-free AND gate (Figure 9.12) in in vitro chemical experiment as a demonstration. The result of the chemical experiment is shown in Figure 9.15. The fluorescent intensity of output strand increased if and only if both inputs were added. Because input 1 can temporally release the output, the intensity slightly increased when only input 1 was added. Although we observed such undesired increase, the experimental result has an agreement with the simulation result. It may be possible to further optimize our simulation method by employing realistic rate constants that are derived by chemical experiment [42, 58].

Figure 9.15 Chemical experimental result of automatically designed enzyme-free AND gate. x and y axes are time in second and fluorescent intensity in arbitrary unit, respectively. To read out the output, fluorophore and quencher molecules were attached to the output and gate. Fluorescent intensity was normalized by the maximum intensity recorded in advance. Inputs were added at 0 s. For technical reason, unnecessary domains in the system were omitted for the experiment.
The number of single strands is a simple scale to measure the complexity of nucleic acid modules. For example, the modules of hairpin pathway [18], see-saw gate [2], and enzyme-free logic gate [1] consist of 1, 5, and 3 strands, respectively. It may be possible to state that the ability of the automatic design method catches up with a design by human trial and error in some functions, because there are not so many differences between the numbers of molecular species. The limits to design much complex systems by evolutionary computation lied in the search space of the topology. The combinatorial optimization method cannot escape from the trade-off between the broadness of the search space and the efficiency of the heuristic algorithm.
The design of DNA automaton was a challenging task because molecular machine that detects the ordering of inputs was nontrivial for human. The state transitions of the designed automaton were not so simple to understand intuitively even though there were only four steps to release the output. Since the search spaces were the same among evolutionary computations, difference of the target function affected the efficiency of the design. It suggests that the evaluation function to calculate the fitness value requires further optimization to design much optimal solution.
9.5.2 Conclusion
A novel graph-based model to predict the dynamics of nucleic acid reaction systems is proposed since analyzing and designing the systems become rapidly important from biological and engineering aspect. Employing graph brings about a flexible representation of nucleic acid compared with other conventional methods to design or program a system driven by hybridization reactions. The graph-based model includes not only hybridization reactions but also enzymatic reactions as graph rewriting rules. As a result, the behavior of nucleic acid reaction systems are successfully explained in terms of the time evolution of concentration.
As an application of kinetic simulation, design automation of the topology of nucleic acid reaction system by evolutionary computation is addressed. By defining appropriate search space and evaluation function, logic gate and state transition machine are successfully designed. Implementation of automatically designed system is possible, which is verified by chemical experiment of one of the logic gates. Expected applications of this research is the development of a nontrivial nucleic acid reaction systems that can serve as modules of molecular device.
REFERENCES
- Georg Seelig, David Soloveichik, David Yu Zhang, and Erik Winfree. Enzyme-free nucleic acid logic circuits. Science, 314(5805):1585–1588, 2006.
- Lulu Qian and Erik Winfree. A simple DNA gate motif for synthesizing large-scale circuits. Journal of the Royal Society Interface, 8(62):1281–1297, 2011.
- Johann Elbaz, Oleg Lioubashevski, Fuan Wang, Françoise Remacle, Raphael D. Levine, and Itamar Willner. DNA computing circuits using libraries of DNAzyme subunits. Nature Nanotechnology, 5(6):417–422, 2010.
- David E. Huizenga and Jack W. Szostak. A DNA aptamer that binds adenosine and ATP. Biochemistry, 34(2):656–665, 1995.
- Louis C. Bock, Linda C. Griffin, John A. Latham, Eric H. Vermaas, and John J. Toole. Selection of single-stranded DNA molecules that bind and inhibit human thrombin. Nature, 355(6360):564–566, 1992.
- Tosan Omabegho, Ruojie Sha, and Nadrian C. Seeman. A Bipedal DNA Brownian motor with coordinated legs. Science, 324(5923):67–71, 2009.
- Jonathan Bath, Simon J. Green, and Andrew J. Turberfield. A free-running DNA motor powered by a nicking enzyme. Angewandte Chemie International Edition, 44(28):4358–4361, 2005.
- Sara Tombelli, Maria Minunni, and Marco Mascini. Analytical applications of aptamers. Biosensors and Bioelectronics, 20(12):2424–2434, 2005.
- Teresa Mairal, Veli Cengiz Özalp, Pablo Lozano Sánchez, Mònica Mir, Ioanis Katakis, and Ciara K. O’Sullivan. Aptamers: molecular tools for analytical applications. Analytical and Bioanalytical Chemistry, 390(4):989–1007, 2008.
- Eun Jeong Cho, Joo-Woon Lee, and Andrew D. Ellington. Applications of aptamers as sensors. Annual Review of Analytical Chemistry, 2:241–264, 2009.
- Shawn M. Douglas, Ido Bachelet, and George M. Church. A logic-gated nanorobot for targeted transport of molecular payloads. Science, 335(6070):831–834, 2012.
- Suvir Venkataraman, Robert M. Dirks, Christine T. Ueda, and Niles A. Pierce. Selective cell death mediated by small conditional RNAs. Proceedings of the National Academy of Sciences, 107(39):16777–16782, 2010.
- Lulu Qian, Erik Winfree, and Jehoshua Bruck. Neural network computation with DNA strand displacement cascades. Nature, 475(7356):368–372, 2011.
- Prabal K. Maiti, Tod A. Pascal, Nagarajan Vaidehi, Jiyoung Heo, and William A. Goddard. Atomic-level simulations of seeman DNA nanostructures: The paranemic crossover in salt solution. Biophysical Journal, 90(5):1463–1479, 2006.
- Mahmoud Moradi, Volodymyr Babin, Christopher Roland, and Celeste Sagui. Reaction path ensemble of the B-Z-DNA transition: a comprehensive atomistic study. Nucleic Acids Research, 41(1):33–43, 2012.
- Thomas E. Ouldridge, Ard A. Louis, and Jonathan P. K. Doye. DNA nanotweezers studied with a coarse-grained model of DNA. Physical Review Letters, 104(17):178101, 2010.
- Jonathan P. K. Doye, Thomas E. Ouldridge, Ard A. Louis, Flavio Romano, Petr Šulc, Christian Matek, Benedict E. K. Snodin, Lorenzo Rovigatti, John S. Schreck, Ryan M. Harrison, and William P. J. Smith. Coarse-graining DNA for simulations of DNA nanotechnology. Physical Chemistry Chemical Physics, 15(47):20395–20414, 2013.
- Peng Yin, Harry M. T. Choi, Colby R. Calvert, and Niles A. Pierce. Programming biomolecular self-assembly pathways. Nature, 451(7176):318–322, 2008.
- Andrew Phillips and Luca Cardelli. A programming language for composable DNA circuits. Journal of the Royal Society Interface, 6(Suppl 4):S419–S436, 2009.
- Nathanaël Aubert, Clément Mosca, Teruo Fujii, Masami Hagiya, and Yannick Rondelez. Computer-assisted design for scaling up systems based on DNA reaction networks. Journal of The Royal Society Interface, 11(93):20131167, 2014.
- Hongqing Cao, Francisco J Romero-Campero, Stephan Heeb, Miguel Cámara, and Natalio Krasnogor. Evolving cell models for systems and synthetic biology. Systems and Synthetic Biology, 4(1):55–84, 2010.
- Yasuaki Kobayashi, Tatsuo Shibata, Yoshiki Kuramoto, and Alexander S. Mikhailov. Robust network clocks: Design of genetic oscillators as a complex combinatorial optimization problem. Physical Review, 83(6):060901, 2011.
- Barry Drennan and Randall D. Beer. Evolution of repressilators using a biologically-motivated model of gene expression. Proceedings of the Tenth International Conference on the Simulation and Synthesis of Living Systems, 10:22–27, 2006.
- Dominique Chu. Evolving genetic regulatory networks for systems biology. In Proceedings of IEEE Congress on Evolutionary Computation 2007 (CEC2007), pages 875–882, 2007.
- Yasuaki Kobayashi, Tatsuo Shibata, Yoshiki Kuramoto, and Alexander S. Mikhailov. Evolutionary design of oscillatory genetic networks. The European Physical Journal B, 76(1):167–178, 2010.
- Mario A. Marchisio and Jörg Stelling. Automatic design of digital synthetic gene circuits. PLoS Computational Biology, 7(2):e1001083, 2011.
- David Soloveichik, Georg Seelig, and Erik Winfree. DNA as a universal substrate for chemical kinetics. Proceedings of the National Academy of Sciences, 107(12):5393–5398, 2010.
- James D. Watson and Francis H. C. Crick. Molecular structure of nucleic acids. Nature, 171(4356):737–738, 1953.
- Akio Nishikawa, Masayuki Yamamura, and Masami Hagiya. DNA computation simulator based on abstract bases. Soft Computing—A Fusion of Foundations, Methodologies and Applications, 5(1):25–38, 2001.
- Luca Cardelli. Strand algebras for DNA computing. Natural Computing, 10(1):407–428, 2011.
- David Yu Zhang, Andrew J. Turberfield, Bernard Yurke, and Erik Winfree. Engineering entropy-driven reactions and networks catalyzed by DNA. Science, 318(5853):1121–1125, 2007.
- Masahiro Takinoue, Daisuke Kiga, Koh-Ichiroh Shohda, and Akira Suyama. Experiments and simulation models of a basic computation element of an autonomous molecular computing system. Physical Review E, 78(4):041921, 2008.
- Hongzhou Gu, Jie Chao, Shou-Jun Xiao, and Nadrian C. Seeman. A proximity-based programmable DNA nanoscale assembly line. Nature, 465(7295):202–205, 2010.
- Kyle Lund, Anthony J. Manzo, Nadine Dabby, Nicole Michelotti, Alexander Johnson-Buck, Jeanette Nangreave, Steven Taylor, Renjun Pei, Milan N. Stojanovic, Nils G. Walter, Erik Winfree, and Hao Yan. Molecular robots guided by prescriptive landscapes. Nature, 465(7295):206–210, 2010.
- Peter Brodersen and Olivier Voinnet. The diversity of RNA silencing pathways in plants. TRENDS in Genettics, 22(5):268–280, 2006.
- David C. Baulcombe. Amplified silencing. Science, 315(5809):199–200, 2007.
- Julia Pak and Andrew Fire. Distinct populations of primary and secondary effectors during RNAi in C. elegans. Science, 315(5809):241–244, 2007.
- Reiji Okazaki, Tuneko Okazaki, Kiwako Sakabe, Kazunori Sugimoto, and Akio Sugino. Mechanism of DNA chain growth, I. Possible discontinuity and unusual secondary structure of newly synthesized chains. Proceedings of the National Academy of Sciences, 59(2):598–605, 1968.
- Masahiro Takinoue, Daisuke Kiga, Koh-Ichiroh Shohda, and Akira Suyama. RNA oscillator: limit cycle oscillations based on artificial biomolecular reactions. New Generation Computing, 27(2):107–127, 2009.
- Anton Kan, Koh-Ichiroh Shohda, and Akira Suyama. A DNA based molecular logic gate capable of a variety of logical operations. Lecture Notes in Computer Science, 7433:86–97, 2012.
- E. Fehlberg. Klassische Runge-Kutta-Formeln vierter und niedrigerer Ordnung mit Schrittweiten-Kontrolle und ihre Anwendung auf Wärmeleitungsprobleme. Computing, 6(1):61–71, 1970.
- David Yu Zhang and Erik Winfree. Control of DNA strand displacement kinetics using toehold exchange. Journal of the American Chemical Society, 131(47):17303–17314, 2009.
- Razvan Nutiu and Yingfu Li. Structure-switching signaling aptamers. Journal of the American Chemical Society, 125(16):4771–4778, 2003.
- Xingguo Liang, Hidenori Nishioka, Nobutaka Takenaka, and Hiroyuki Asanuma. A DNA nanomachine powered by light irradiation. ChemBioChem, 9(5):702–705, 2008.
- Kensaku Sakamoto, Hidetaka Gouzu, Ken Komiya, Daisuke Kiga, Shigeyuki Yokoyama, Takashi Yokomori, and Masami Hagiya. Molecular computation by DNA hairpin formation. Science, 288(5469):1223–1226, 2000.
- Wei Li, Yang Yang, Hao Yan, and Yan Liu. Three-input majority logic gate and multiple input logic circuit based on DNA strand displacement. Nano Letters, 13(6):2980–2988, 2013.
- Georg Seelig, Bernard Yurke, and Erik Winfree. Catalyzed relaxation of a metastable DNA fuel. Journal of the American Chemical Society, 128(37):12211–12220, 2006.
- Martin Mann, Heinz Ekker, and Christoph Flamm. The Graph Grammar Library - a generic framework for chemical graph rewrite systems. Lecture Notes in Computer Science, 7909:52–53, 2013.
- Francesc Rosselló and Gabriel Valiente. Graph transformation in molecular biology. Lecture Notes in Computer Science, 3393:116–133, 2005.
- Vincent Danos, Jérôme Feret, Walter Fontana, and Jean Krivine. Scalable simulation of cellular signaling networks. Lecture Notes in Computer Science, 4807:139–157, 2007.
- Marco Brucale, Giampaolo Zuccheri, and Bruno Samori. The dynamic properties of an intramolecular transition from DNA duplex to cytosine-thymine motif triplex. Organic & Biomolecular Chemistry, 3(4):575–577, 2005.
- Satoru Nagatoishi, Takahiko Nojima, Elzbieta Galezowska, Bernard Juskowiak, and Shigeori Takenaka. G quadruplex-based FRET probes with the thrombin-binding aptamer (TBA) sequence designed for the efficient fluorometric detection of the potassium ion. ChemBioChem, 7(11):1730–1737, 2006.
- Matthew R. Lakin, David Parker, Luca Cardelli, Marta Kwiatkowska, and Andrew Phillips. Design and analysis of DNA strand displacement devices using probabilistic model checking. Journal of the Royal Society Interface, 9(72):1470–1485, 2012.
- Lulu Qian and Erik Winfree. Scaling up digital circuit computation with DNA strand displacement cascades. Science, 332(6034):1196–1201, 2011.
- Daniel T. Gillespie. Exact stochastic simulation of coupled chemical reactions. The Journal of Physical Chemistry, 81(25):2340–2361, 1977.
- Fumiaki Tanaka, Masashi Nakatsugawa, Masahito Yamamoto, Toshikazu Shiba, and Azuma Ohuchi. Towards a general-purpose sequence design system in DNA computing. In Proceedings of the 2002 World on Congress on Computational Intelligence. IEEE, 2002.
- Soo-Yong Shin, In-Hee Lee, Dongmin Kim, and Byoung-Tak Zhang. Multiobjective evolutionary optimization of DNA sequences for reliable DNA computing. IEEE Transactions on Evolutionary Computation, 9(2):143–158, 2005.
- Kevin Montagne, Raphael Plasson, Yasuyuki Sakai, Teruo Fujii, and Yannick Rondelez. Programming an in vitro DNA oscillator using a molecular networking strategy. Molecular System Biology, 7:466, 2011.