
18
CAPITAL MANAGEMENT AND CASH FLOW
Long‐Term Assets
CHAPTER INTRODUCTION
In Chapter 17, we described capital efficiency as a key value driver and explored operating capital in detail. This chapter examines the remaining components of capital effectiveness, including property, plant, and equipment and intangible assets. Figure 18.1 drills down into the components of capital investment and asset management.

FIGURE 18.1 Drill‐Down Illustration: Capital Effectiveness and Asset Management
CAPITAL INTENSITY
The term capital intensity is used to describe the level of property, plant, and equipment (PP&E; also known as fixed assets) that is required to support a business. Capital intensity will vary significantly from firm to firm, from industry to industry, and from one business model to another. Key among the drivers of capital intensity are the nature of the industry, the effectiveness of capital processes, and the degree of vertical integration.
Nature of Industry
Certain industries, such as automotive manufacturing, refining, and transportation require high levels of capital assets. Others, such as consulting, require very little in the way of capital assets. Other industries fall somewhere in the middle of these two extremes.
Effectiveness of Capital Process
Companies that require substantial investments in capital assets must develop effective decision and control processes over capital spending and asset management. Key process controls will include review of proposed expenditures to ensure business and economic justification, reviews to monitor project implementation, postaudits, physical control over existing assets, and identification and disposal of underutilized assets. The process of making capital investment decisions is discussed in detail in Chapters 20 and 21.
Vertical Integration
Vertical integration refers to the extent to which a company directly owns supply chain activities and resources. A company that is considered vertically integrated will produce a substantial part of the final product. An example of a vertically integrated organization would be a company engaged in growing, harvesting, processing, and distribution of food products. Other companies, by contrast, will purchase or acquire a substantial part of the product from third parties, commonly referred to as contract manufacturing or outsourcing. In recent years, there has been a strong movement toward outsourcing activities such as manufacturing, so that the enterprise can focus attention and resources on core activities such as product design and marketing. A company that outsources a substantial part of its manufacturing will require substantially less plant and equipment (and of course inventory) than a company that is more vertically integrated.
Depreciation Policy
Capital assets are defined as assets with a utility greater than one year. Accounting practices require that these investments be “capitalized” (recorded as assets) and depreciated over an estimated useful life. While there are general guidelines for depreciation methods and periods for each type of asset, companies can adopt either a conservative or an aggressive practice within the acceptable range. Companies that use shorter lives and faster depreciation methods will depreciate assets faster, resulting in higher depreciation expense and lower book values for these assets on the balance sheet.
TOOLS FOR IMPROVING THE MANAGEMENT OF LONG‐TERM CAPITAL
Tools and best practices can be employed to improve the utilization and effectiveness of long‐term assets. These include developing an effective capital investment process, monitoring projects, and conducting postimplementation reviews.
Effective Capital Review and Approval Process
A fundamental driver of effective utilization of capital is the strength of the capital investment process. Figure 18.2 recaps key steps in an effective capital investment process.

FIGURE 18.2 Capital Investment Process Overview
Companies should identify potential capital projects as part of their strategic and annual operating planning activities. The capital budget will be an important element of each plan. For strategic plans, the managers should look out three to five years and anticipate significant capital expenditures to support growth, strategic initiatives, and other requirements. Integrating the capital plan into the financial projections will afford the opportunity to review cash flow projections and determine the adequacy of returns over the strategic planning horizon.
For significant expenditures, a capital investment proposal (CIP) should be prepared to document key aspects of the project, including business justification, economic case, alternatives, and implementation plan. The scope of the CIP and the management approval level should scale with the size and importance of the project. The CIP would typically include:
- Business case
- Economic case
- Alternatives
- Implementation plan
If a capital project has been supported by a well‐documented proposal, including a detailed implementation plan, managers can review the progress of the project at various points. Is the project on schedule? If not, why? Have the underlying assumptions changed? If so, is the project still worth doing? The capital investment decision process is covered in detail in Chapter 20.
Postimplementation Review
A terrific way to improve the utilization of capital and the capital investment process is to review the actual performance of capital investments compared to the original CIP (see sidebar: “Postaudit Review of Projects”). While this can be a difficult exercise for many projects, there is great value in the effort. First, managers will know, in advance, that the project results will be formally evaluated. This will encourage well‐thought‐out and realistic proposals. Second, even where the results may be difficult to measure, much can be learned about the project results as well as lessons for future projects. Third, the review can identify improvement opportunities in the capital investment process or management issues such as unrealistic projections or inadequate project oversight.
My first attempt at postimplementation reviews of capital projects was both difficult and modest. Managers complained that they didn't have adequate systems to measure the incremental savings for many projects. So we simply met to discuss the project and physically inspected the asset, where appropriate. On one occasion, we discovered that a substantial piece of equipment had been essentially abandoned shortly after purchase. We were able to sell the equipment, generating cash and reducing asset and depreciation levels. We also worked with the managers to ensure that the process to develop capital project proposals was improved to decrease the chances of this occurring in the future.
Asset Inventory and Utilization Review
Periodically, companies should perform a physical inventory of fixed assets and compare to accounting records. This process should be part of a company's internal control framework. The inventory can easily be expanded to review the estimated utilization of significant assets. If certain assets are not utilized, these assets may be sold (or otherwise disposed of), which will generate cash, reducing associated expenses (e.g. taxes, depreciation, maintenance, and insurance), and increase asset turnover.
In some cases, an asset's fair value may appreciate significantly over the value carried in the accounting records. This occurs frequently with real estate assets. Management should consider if the potential value realized by liquidating that asset exceeds the value of continuing to hold and operate that asset. Table 18.1 illustrates an asset utilization recap for the top 20 line items in property, plant, and equipment.
TABLE 18.1 Asset Utilization Review ![]()
| Asset Description | Service/Acq Date | Original Cost | Net Book Value | Estimated Utilization | Market Value | Indicated Action |
| Machining Station | 1992 | 800,000 | 0 | 10% | 200,000 | Sell and outsource machining |
| Warehouse 1 | 1990 | 2,400,000 | 160,000 | 90% | 3,700,000 | No action |
| Warehouse 2 | 1994 | 1,600,000 | 177,778 | 10% | 1,800,000 | Consolidate into Whse. 1, sell |
| Corporate Headquarters | 1997 | 1,350,000 | 300,000 | 80% | 1,250,000 | Lease excess space |
| R&D Facility‐wet lab | 2005 | 900,000 | 360,000 | 0 | 750,000 | Project terminated; lease or sell |
| Manufacturing Line 1 | 1995 | 600,000 | 22,000 | 0.8 | 20,000 | No action |
| Manufacturing Line 2 | 2004 | 850,000 | 340,000 | 88% | 800,000 | No action |
| Land | ||||||
| Lots‐Sheridan Business Park | 2004 | 1,600,000 | 1,600,000 | 0% | 2,200,000 |
New complex indefinitely postponed; consider selling |
Ensure Key Business Decisions Include Capital Requirements
Frequently, capital requirements are not fully considered in business decisions. This is may occur in companies with a narrow focus on sales and earnings per share (EPS) growth and in companies with cash surpluses. Capital is sometimes viewed as “free” in these situations because of the muted effect of capital on EPS (depreciation expense is spread out over several years) and limited alternatives for utilizing excess cash.
PROJECTING CAPITAL INVESTMENTS AND DEPRECIATION
Estimating future capital expenditures, depreciation, and related balance sheet accounts is an important part of developing projected profits, asset requirements, and cash flow.
Estimated capital expenditures should be integrated with the strategic and operational planning process as well as the short‐term forecast or business outlook. Drivers of capital expenditures include growth and expansion; new product development, introduction, and production; replacement and refurbishment; and statutory requirements (e.g. environmental regulations). Developing and reviewing capital investment decisions is covered in Chapter 20.
There is a tendency to shortcut the process of estimating depreciation expense and accumulated depreciation in the balance sheet. Unlike many other financial elements, depreciation generally cannot be trended or extrapolated. It is driven by the timing of acquisitions, depreciation methods, and lives. Significant changes in depreciation occur:
- When an asset is acquired or placed in service.
- When an asset has been fully depreciated.
TABLE 18.2 Projecting Property and Equipment and Accumulated Depreciation ![]()
| Property and Equipment | 2017 | 2018 | Total Year | |||||||||
| Q1 | Q2 | Q3 | Q4 | Q1 | Q2 | Q3 | Q4 | 2017 | 2018 | |||
| Beginning Balance | 139.0 | 149.0 | 161.0 | 166.0 | 178.0 | 203.0 | 265.0 | 307.0 | 139.0 | 178.0 | ||
| Additions | 10.0 | 12.0 | 5.0 | 12.0 | 25.0 | 62.0 | 42.0 | 12.0 | 39.0 | 141.0 | ||
| Retirements | – | – | – | – | ||||||||
| Other | – | – | ||||||||||
| Ending Balance | 149.0 | 161.0 | 166.0 | 178.0 | 203.0 | 265.0 | 307.0 | 319.0 | 178.0 | 319.0 | ||
| Accumulated Depreciation | 2,017.0 | 2,017.0 | Total Year | |||||||||
| Q1 | Q2 | Q3 | Q4 | Q1 | Q2 | Q3 | Q4 | 2,017.0 | 2,018.0 | |||
| Beginning Balance | 70.0 | 74.7 | 79.7 | 84.8 | 89.6 | 95.3 | 103.2 | 112.3 | 70.0 | 89.6 | ||
| Depreciation Expense | 4.7 | 5.0 | 5.0 | 4.8 | 5.7 | 7.9 | 9.1 | 9.6 | 19.6 | 32.3 | ||
| Retirements | – | |||||||||||
| Other | – | – | ||||||||||
| Ending Balance | 74.7 | 79.7 | 84.8 | 89.6 | 95.3 | 103.2 | 112.3 | 121.9 | 89.6 | 121.9 | ||
| Depreciation Estimate | Acquisition | 2017 | 2018 | Total Year | Avg | |||||||
| Acquisition Period | Cost | Q1 | Q2 | Q3 | Q4 | Q1 | Q2 | Q3 | Q4 | 2017 | 2018 | Depr Life |
| Prior | 40.0 | 0.8 | 0.8 | 0.7 | 0.7 | 0.7 | 0.6 | 0.6 | 0.7 | 3.1 | 2.6 | 12 |
| 2012 | 50.0 | 1.8 | 1.7 | 1.6 | 1.0 | 1.0 | 1.0 | 0.9 | 0.9 | 6.0 | 3.8 | 7 |
| 2013 | 15.0 | 0.5 | 0.5 | 0.5 | 0.5 | 0.5 | 0.5 | 0.4 | 0.4 | 2.1 | 1.9 | 7 |
| 2014 | 10.0 | 0.4 | 0.4 | 0.4 | 0.4 | 0.4 | 0.4 | 0.4 | 0.3 | 1.4 | 1.4 | 7 |
| 2015 | 12.0 | 0.4 | 0.4 | 0.4 | 0.4 | 0.4 | 0.4 | 0.4 | 0.4 | 1.7 | 1.7 | 7 |
| 2016 | 12.0 | 0.4 | 0.4 | 0.4 | 0.4 | 0.4 | 0.4 | 0.4 | 0.4 | 1.7 | 1.7 | 7 |
| Total 2016 and Prior | 139.0 | 4.4 | 4.2 | 4.1 | 3.5 | 3.5 | 3.4 | 3.1 | 3.2 | 16.1 | 13.1 | |
| Q12017 | 10.0 | 0.4 | 0.4 | 0.4 | 0.4 | 0.4 | 0.4 | 0.4 | 0.4 | 1.4 | 1.4 | 7 |
| Q22017 | 12.0 | 0.4 | 0.4 | 0.4 | 0.4 | 0.4 | 0.4 | 0.4 | 1.3 | 1.7 | 7 | |
| Q32017 | 5.0 | 0.2 | 0.2 | 0.2 | 0.2 | 0.2 | 0.2 | 0.4 | 0.7 | 7 | ||
| Q42017 | 12.0 | 0.4 | 0.4 | 0.4 | 0.4 | 0.4 | 0.4 | 1.7 | 7 | |||
| Q12018 | 25.0 | 0.9 | 0.9 | 0.9 | 0.9 | ‐ | 3.6 | 7 | ||||
| Q22018 | 62.0 | 2.2 | 2.2 | 2.2 | ‐ | 6.6 | 7 | |||||
| Q32018 | 42.0 | 1.5 | 1.5 | ‐ | 3.0 | 7 | ||||||
| Q42018 | 12.0 | 0.4 | ‐ | 0.4 | 7 | |||||||
| Total Projected Acquisitions | 180.0 | 0.4 | 0.8 | 1.0 | 1.4 | 2.3 | 4.5 | 6.0 | 6.4 | 3.5 | 19.2 | |
| Total Depreciation | 319.0 | 4.7 | 5.0 | 5.0 | 4.8 | 5.7 | 7.9 | 9.1 | 9.6 | 19.6 | 32.3 | |
Table 18.2 illustrates the methodology for forecasting depreciation expense. The worksheet captures the estimated depreciation for assets already in service, including the timing of reduced depreciation when assets become fully depreciated. The depreciation for expected acquisitions is then estimated based on projected service date, cost, and useful life. Note the dramatic falloff in depreciation of prior assets and the subsequent increase when new assets are placed in service.
A version of this method for long‐term projections is included in Chapter 14.
KEY PERFORMANCE INDICATORS FOR CAPITAL INTENSITY
Managers can utilize performance measures to provide visibility into drivers of capital intensity and the effectiveness of capital management. We will use the financial information introduced in Chapter 2 for Roberts Manufacturing Company (RMC).
Capital Asset Intensity (Fixed Asset Turnover)
Capital asset intensity or fixed asset turnover is computed as follows:

For RMC in 2018,

This measure reflects the level of investment in property, plant, and equipment relative to sales. Some businesses are very capital intensive (i.e. they require a substantial investment in capital), whereas others have modest requirements. For example, electric utility and transportation industries typically require high capital investments. On the other end of the spectrum, software development companies would usually require minimal levels of capital.
Capital Asset Intensity at Cost (Fixed Asset Turnover at Cost)
This is a variation of the previous formula that uses the original cost of the assets instead of the net book or depreciated value. It may be more useful in those situations where capital remains employed far beyond the original depreciation period, or to level set comparisons across companies with different depreciation policies.

Capital Reinvestment Rate
One way of measuring the rate of investment in capital is to compute the ratio of capital spending to depreciation.

For RMC in 2018,

Changes in depreciation levels lag capital investment because assets are depreciated over several years. For businesses with little or modest top‐line growth, a reinvestment index of 1 or lower may be appropriate. For high‐growth businesses, capital expenditures will typically exceed depreciation, resulting in a high capital reinvestment rate.
Asset Write‐Offs and Impairment History
Significant charges to write off or write down assets may indicate an ineffective decision or implementation process for capital investment. Companies that have frequent asset write‐offs and impairment charges (and other nonrecurring charges) likely have an opportunity to improve capital investment, strategic, and related processes.
INTANGIBLE ASSETS
Unlike tangible fixed assets, intangible assets are not associated with a specific identifiable asset like property or equipment. Intangible assets typically arise from acquisitions, where the purchase price of an acquisition target exceeds the fair market value of tangible assets. The excess of the purchase price is recorded as goodwill or assigned to other intangible assets as shown in Table 18.3.
TABLE 18.3 Acquisition Purchase Price Allocation ![]()
| Purchase Price | $ 100,000 |
| Assigned to Tangible Assets: | |
| Accounts Receivable | 15,000 |
| Inventories | 12,000 |
| Property, Plant, and Equipment | 17,000 |
| Other Assets | 2,000 |
| Accounts Payable | (4,000) |
| Accrued Liabilities | (6,000) |
| Net Tangible Assets | 36,000 |
| Excess of Purchase Price over Tangible Assets | 64,000 |
| Value of Identifiable Intangibles* | 15,000 |
| Remainder (“Goodwill”) | 49,000 |
*Includes Patents, Trademarks, Customer Lists, etc.
A company that has made one or several acquisitions is likely to have a substantial balance in goodwill and intangible assets. Companies that focus exclusively on internal growth will not have goodwill or related intangibles.
Figure 18.3 compares goodwill and intangibles as a percentage of total assets of several well‐known companies with a range of acquisition activity ranging from minimal to extensive.
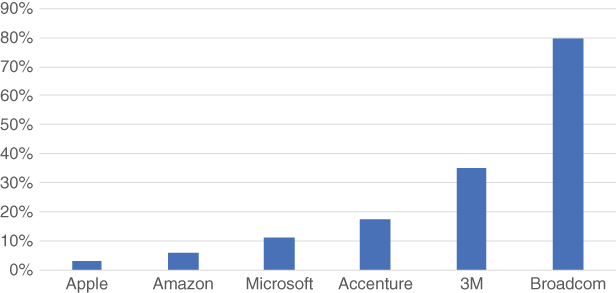
FIGURE 18.3 Goodwill and Intangible Assets as a Percentage of Total Assets 
Source: Author analysis of company reports.
Companies that have done a poor job in evaluating, valuing, and integrating acquisitions will likely have been forced to write off or write down goodwill arising from failed acquisitions. Companies that are successful with mergers and acquisitions (M&A) will continue to carry the goodwill as an asset. Goodwill and certain acquisition intangibles must be evaluated each year to determine if the assets are “impaired.” Stated simply, the performance of acquisitions is monitored to determine if the purchase price paid and resulting assets on the balance sheet are supported by current performance expectations.
The level of goodwill and related intangibles for firms that have completed acquisitions must be evaluated in the context of other value drivers, including sales growth and return on invested capital (ROIC). Refer to the analysis and economics of M&A in Chapter 23 for additional discussion of acquisitions.
KEY PERFORMANCE INDICATORS: GOODWILL AND INTANGIBLE ASSETS
Intangible Asset Turnover
Intangible asset turnover is a ratio helps explain the overall measure of asset turnover. A company that has made significant acquisitions will have a larger intangible balance and lower asset turnover than a company that has grown organically. The measure provides an indication of how significant acquisition activity has been relative to sales levels, and is computed as:

For RMC, the intangible asset turnover is:

Goodwill Impairment Charges
Goodwill impairment charges result from acquisitions failing to perform to expectations that supported the original purchase price. Significant charges to write off or write down assets may indicate an ineffective decision or implementation process for business acquisitions. Companies that have recorded impairment (and other nonrecurring) charges likely have an opportunity to improve acquisition and strategic processes.
Performance of Acquisitions: Synergies and Strategic Objectives
One way to determine if the intangibles related to a specific acquisition are safe or will be required to be written down in the future is to track key performance indicators on the value drivers that are critical to the success of the acquisition. Examples include key integration milestones such as sales force consolidation, the introduction of new products based on combined technologies, sales growth resulting from distribution synergies, and headcount reductions. Achieving these objectives, as set out in the acquisition plan and reflected in the acquisition pricing, should result in a favorable impairment test result.
EXCESS CASH BALANCES
In Chapter 17, we indicated that we would exclude financing accounts from our discussion of capital efficiency. However, we do need to address the impact of holding excessive levels of cash or short‐term investments. What is excess cash? Most businesses need a minimum level of cash to operate the business. The minimum level of cash to operate will be a function of several factors, including business seasonality, cash generation and requirements, life cycle stage, international complexities, and management preference. This minimum level may be reduced if the company has ready access to a short‐term credit facility. Many companies hold cash at a level significantly higher than levels necessary to support operations. Typically, this occurs in profitable firms with good returns where investments to support future growth have declined. Many firms retain excess cash as a cushion against unforeseen challenges or as a “war chest” to allow the company to pursue large investments, including acquisitions. In some cases, what appears as excess cash for US‐based multinationals is often a result of a surcharge tax that would be due if the cash and earnings were repatriated to the United States. Some of these firms hold on to the excess cash year after year despite their stated intention to invest the cash. One of the most notable cash hoarders is Apple, having amassed a cash and investment balance exceeding $66 billion as of September 30, 2016. The combination of high growth and low cash requirements has created this “challenge” for one of the most successful companies over the past quarter century.
Maintaining this flexibility by holding excess cash dilutes shareholder returns. The interest earned (after tax) on cash and short‐term investments is typically much lower than the firm's cost of capital. Table 18.4 illustrates the impact of retaining excess cash. Retainage Inc. has a $600 million cash balance, of which $100 million is required to support the business. The firm has net income of $150 million and total assets of $1,500 million. The cash earns 6% and is taxed at 30%. The firm's cost of capital is 15%.
TABLE 18.4 Estimating the Economic Cost (Penalty) of Retaining Excess Cash ![]()
| Retainage Inc | ||||
| Estimate of “Excess Cash” | $m | |||
| Year end cash balance | 600.0 | |||
| Assume $100k required to support business | −100.0 | |||
| “Excess Cash” | 500.0 | |||
| Estimate of Impact on Economic Profit | ||||
| Earnings (6% interest rate, 30% tax rate) | ||||
| After‐tax interest rate of | 4.2% | |||
| Profit after Tax | 21.0 | |||
| Cost of Capital: | 15.0% | |||
| WACC | 500.0 | −75.0 | ||
| Excess Cash | ||||
| Economic Profit (Loss) on Excess Cash | −54.0 | |||
| Estimated Impact on ROA | Including | Excess | Excluding | |
| Cash | Cash | Cash | % Change | |
| Net Income | 150.0 | −21.0 | 129.0 | −14.0% |
| Assets | 1,500.0 | −500.0 | 1,000.0 | −33.3% |
| ROA | 10.0% | 4.2% | 12.9% | 29.0% |
The analysis estimates that retaining excess cash reduces economic profit by $54 million and reduces return on assets by 29.0%.
Managers and boards should carefully evaluate the trade‐off involved in retaining excess cash. In some situations, some (or all) of the excess cash should be returned to shareholders in the form of dividends or share repurchases. This methodology can also be used to estimate the economic impact of retaining other underperforming assets, for example a unit with low profitability or returns.
LONG‐TERM CAPITAL DASHBOARD
Based on the specific facts and circumstances, managers can combine several key performance measures into a dashboard to monitor key drivers of long‐term capital assets (Figure 18.4).

FIGURE 18.4 Long‐Term Capital Dashboard
SUMMARY
The capital required to support a business and the effectiveness of management in managing capital assets are significant drivers of performance and value. Major components of capital include operating capital; property, plant, and equipment; and intangible assets. The level of assets required to support a business is driven by a number of factors, including the nature of the industry, the business model, and the level of efficiency in key businesses processes. Improvements to the capital investment process such as postimplementation and utilization reviews can lead to improved cash flow, profitability, asset turnover, and return on equity. Goodwill and intangibles are largely a function of acquisition activity and the effectiveness of the acquisition process, including the evaluation, valuation, and integration of acquisitions. Companies should estimate the economic impact of retaining excess levels of cash and other underperforming assets and consider this in their evaluation of these assets.