We will now look at the graph and loss function using TensorBoard. Start TensorBoard and point to the log directory /tmp/models defined in the code or any other path that you have set for saving the TensorFlow logs. The following is the visualization of the graph:

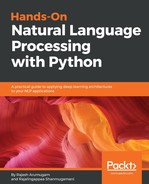
We can quickly find the resemblance between this model and the model architecture of the original DeepSpeech paper. We have the input nonrecurrent layers, followed by the RNN layer and the output hidden layers. We will now look at how the average CTC loss varies with the training:

The CTC loss can be seen to steadily decrease with the training steps. Though our model replicates the architecture of DeepSpeech, we only trained on a small dataset. To achieve good transcription accuracy (word error rate, CRT loss, and so on, which is speaker agnostic), we may need to train it on a large dataset. For further details, you may also look at another DeepSpeech implementation that can be found at https://github.com/mozilla/DeepSpeech. There, they use datasets of several 10's of Gigabytes and utilize distributed training on multiple GPUs. The purpose of the implementation we showed here is to quickly come up with a simple model and training.