As we will see in the next sections, some efficient techniques used in state-of-the-art TTS systems (deep learning-based, or otherwise) rely on tricks that come from the signal processing world. For instance, generating a spectrogram instead of a waveform of a signal, and then applying a conversion algorithm, is often preferred over directly predicting a waveform. This can provide better results in a faster way. This section is a quick recap on spectrograms, and it will help you to understand many ideas that will be presented later in the chapter.
Essentially, a spectrogram is a way to represent the strength of an audio signal. It can be shown on a two-dimensional graph, where the x axis is the time and the y axis is the frequency of the signal. A third dimension is represented by a heatmap, which tells us what is the importance of each frequency at a particular time. Usually, cold colors are used for smaller amplitudes and hot colors are used for larger amplitudes.
To compute the spectrogram of a given digital signal, one needs to first use the short-time Fourier transform (STFT). We can get the STFT by calculating the Fourier transform for consecutive frames in the signal:

In the preceding formula, w is the chosen sliding window.
We can then obtain the spectrogram:

In practice, the non-squared magnitude of the STFT is used.
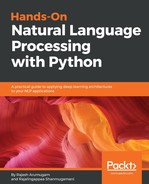
In order to exploit a representation that is closer to the way human beings perceive sounds, a mel scaled spectrogram is sometimes favored. The mel scale is designed so that consecutive mel-frequencies are perceived (by listeners) to be equally spaced. Its definition was established based on subjective experiments, involving people listening to sounds with different frequencies and then estimating the distances between those sounds, based on how they perceived pitches. Different experiments lead to the definitions of different conversion formulas. One of the most popular (and the one that we will use) is the following:

For those who prefer to visualize functions, the following is the graph associated with this formula, where the x axis represents frequencies and the y axis represents mel-frequencies:

Basically, the frequency component of the spectrogram is transformed into a mel component through the aforementioned formula. This conversion is done together with a binning operation, where a triangular filter bank, with k filters spaced according to the mel scale, is applied on the spectrogram, so that a limited number of mel-frequency bands are extracted.
The following is an example of such a filter bank, with k=20 triangular filters:

Additionally, we prefer to use the decibel scale for both the spectrogram and the mel-spectrogram, because the amplitude of a sound is also perceived by human beings in a logarithmic way:

We can illustrate these notions with the following audio signal (with a sampling rate of 22,050 Hz):

When we look at its spectrogram (the magnitude of its STFT computed with 2,048 points), we can barely distinguish the parts where the amplitude is the most important, because of its logarithmic nature. That is why we use the decibel scale:

When we use the decibel scale, the visualization is neater. It becomes easy to see which frequencies have the biggest amplitude across time:

Applying the mel scale on the frequency, along with an 80-band filterbank, allows us to obtain a more condensed representation of the spectrogram, which has the advantage of reducing the size of the spectrogram matrix and decreasing the number of operations in any next processing steps:

We are now better equipped to tackle the next sections.