

CICS Explorer PA plug-in familiarization
In this chapter, we discuss CICS PA, mainly focusing on the CICS Explorer plug-in for CICS PA.
8.1 Overview of CICS PA
In this section, we provide an overview of CICS PA.
8.1.1 Runtime product
The mainframe product provides system analysts assistance in a wide range of performance-related measurement scenarios with particular focus on:
•System performance analysis
•System tuning
•Capacity planning
The runtime product benefits CICS architects, developers, system managers, and administrators.
8.1.2 The plug-in
The CICS PA plug-in differs from the other CICS Explorer plug-ins because it does not utilize a published API on the host; instead, it uses data extracts from the PA runtime. from these data extracts targeted reports and analysis can be made.
Analysts can visualize their transaction performance data more easily using the graphing and tree views so that they can navigate and identify issues, such as Threadsafe, more readily and with less experience and skill.
At the time of writing, the CICS PA plug-in takes advantage of a subset of the main CICS PA runtime reporting functionality, presenting transaction performance summary data to you in a more understandable and intuitive way.
You can access performance data summaries and reporting scenarios through CSV files or database (DB2).
Information is extracted from the CICS PA runtime by a number of routes and can be saved either as CSV data or using a database. The data represents various measurements that are summarized over a defined time period.The CSV file is a simple portable form of data and is ideal when focused at a very specific data volume level. The database strategy is preferred for the analysis of larger data volumes not only because it can contain so much more historical data, but the performance is better from an application point-of-view rather than handling large CSV files in memory.
Presenting performance data in the context of CICS Explorer allows integration with the base explorer and other tools which compliments the historical performance information by presenting it alongside see the live data and definitions.
8.2 The PA Explorer environment
The Eclipse views that the CICS PA plug-in provides, Figure 8-1, can be used in a number of perspectives including the standard Eclipse resource perspective.

Figure 8-1 CICS PA Eclipse views
Most users' first point of contact is the Project Explorer view in the top left of Figure 8-1. The Project Explorer is a standard Eclipse view presenting resources such as files and folders to a user. In the context of the PA plug-in, files, such as a CSV file extracted from the PA runtime, are contained within a project and folders. There are numerous ways to import these files into the explorer, including Drag-and-Drop, Copy-and-Paste, plus Import. Consult the online help for more detail.
A similar mechanism to the CSV files is used for database references, which allows a consistent interface. The specification and configuration of database connectivity is described elsewhere.
The data that is contained through the CSV or database link is broken down by date, time, Applid, and transaction. This type of taxonomy makes it easy to navigate to a specific point of time to find a particular area of focus. Figure 8-2 shows data exposed using the CSV.

Figure 8-2 Data using CSV
After you identify an area of interest, you can see more information by opening a Sheet View or one of a series of charts, as shown in Figure 8-3 on page 195.
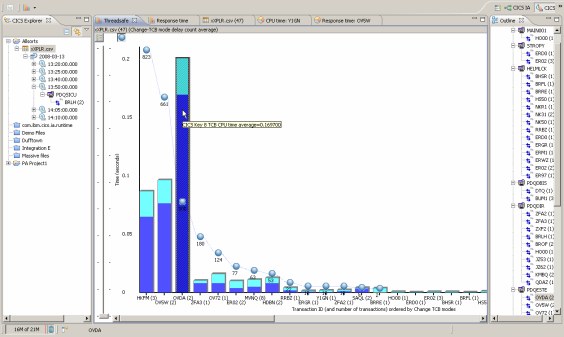
Figure 8-3 Bar chart with overlay
To accompany the main views, you can choose to complement your data picture by showing a taxonomy or outline view. This is a sort of a "where am I?" aid. This view is only enabled with a CSV file because the database equivalent can be immense and adversely affect performance.
You can also use the standard Eclipse Properties View, which shows every detail being held about a transaction instance. Data is organized based upon categorizations, which describe later.
8.3 PA views and editors in detail
In this section, we discuss the PA views and editors.
8.3.1 The Project Explorer
The Project Explorer, Figure 8-4 on page 196, is a standard Eclipse component within the Resource perspective, which is also standard Eclipse. When the PA plug-in is installed the Project Explorer displays conventional projects, folders, and files, but if these files end with a suffix of CSV or CPA further information can be obtained from them, providing that they were created on the PA runtime.
Because we are using summary data with a unique key we can drill into these files and obtain a useful date, time, and applid transaction name taxonomy.
|
Note: Project Explorer can also be used to view and manipulate IA queries and bundles.
|

Figure 8-4 Project Explorer
Contextual menus, Figure 8-5 on page 197, are available on the project explorer view depending upon whether you selected one or more of the following options:
•Date
•Time
•Applid
•Transaction name
Figure 8-5 Contextual menu
8.3.2 The Sheet View
The Sheet View provides access to the raw detail information that is available from a summary report. The data is keyed based upon Start date, Time, the Applid, and Transaction name, which uniquely identifies a record instance.
Those four fields are essential for the PA Explorer to be able to read the CSV or database provided data. If these fields are not present, the application will not provide any functionality over simply displaying raw data.
You can choose the columns that are extracted from the PA runtime, but following the four columns that form the unique record key is the task termination count column. Although not part of the primary key, this value is always required in reports as additional information. Omission of this column limits further functionality.
The subsequent columns are as defined by the data extraction process on the server.
Using standard Eclipse functionality you can sort the retrieved columns and the columns can themselves be moved so that associated data can be placed side by side for visual comparison. However, remember that the sort function, Figure 8-6, only sorts what was retrieved and does not cause a subsequent fetch of data to be executed.
Figure 8-6 Sort function
Other standard Eclipse functionality includes the ability to copy the data in an individual cell to the clipboard to be pasted into a document. Figure 8-7 is an example of how to copy data.
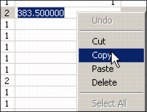
Figure 8-7 Copy data
You can also select and copy complete rows, as shown in Figure 8-8.

Figure 8-8 Copy complete rows
8.3.3 Pie chart view
Pie charts are displayed in the Transaction detail view, as shown in Figure 8-9. The pie charts contain a detailed breakdown of a single transaction ID in the time period selected. To display the Transaction detail view:
1. Select a single transaction in the Project Explorer view or a Sheet View.
2. Right-click the selection, hover over Performance history, and select Detail breakdown. The Transaction detail view is displayed.
3. Click a pie chart to show the details for a specific analysis type. In Figure 8-9, the Transaction detail view is shown with the CPU time pie chart selected, displaying detailed CPU time information for the selected transaction ID.

Figure 8-9 Transaction detail view
The Transaction detail view displays the following information:
•A view tab that shows the analysis type and the name of the transaction ID.
•An information bar below the view tab that contains further details about the transaction ID.
•A pie chart for each type of analysis. You can select each analysis by clicking the relevant pie chart.
The Transaction detail view contains one or more pie charts depending on the data selected and categorization enablement, for example, if the Storage categorization enablement is not selected, the Storage pie is not displayed. Similarly, if there is no file usage data in the selected sample, the File usage pie chart is not displayed.
8.3.4 Bar charts
A bar chart, Figure 8-10, displays a bar for each transaction that is selected. Each bar contains one or more sectors, and each sector represents different information depending on the selection type.
You can access the bar chart through the Performance History Context menu. It is identified by a sub-menu that displays the bar graphic, as shown in Figure 8-10.

Figure 8-10 Creating a bar chart
The charts are described by scenarios, which give a pointer to what type of data is of specific interest. Figure 8-10 shows Threadsafe, which means that the fields that will be analyzed and displayed are important when considering a Threadsafe issue or concern:
1. Select two or more transactions or select a higher tree node, such as an application ID that contains two or more transactions, either in the Project Explorer view or a Sheet View.
2. Right-click the selection, hover over Performance history, and select the type of analysis to perform.
A new view opens displaying a bar chart for the selected analysis. In Figure 8-11 on page 201, a storage analysis is selected, and the Storage view is shown with a bar chart for each of the selected transaction IDs.
Figure 8-11 Bar chart
The bar chart view displays the following information:
•A view tab, containing the name of the analysis in this case, Storage. You can hover over the tab to show the data source file and number of records in the sample.
•An information bar below the view title, that contains the path and name of the data source file that contains the data.
•Stacked bars that consist of one bar for each transaction ID selected. Each bar in a stack consists of one or more sectors, each representing a different field. You can hover over a sector to show further information about the field.
•A Legend icon in the top left corner of the chart. Click this icon to display the chart legend. The legend shows only the colors in use in the current chart.
You can select one or more bars and perform a further analysis on the information by right-clicking and selecting a new analysis from the menu.
8.3.5 Timeline charts
A timeline chart displays all instances of a transaction ID in the selected application ID across either the whole data file or a range of dates specified using the Date dialog when selecting the data, for example, selecting the single record with a transaction ID of CRTP in an application ID of IYCYZC20 displays a bar for every instance of the transaction ID in the application. To display a timeline chart:
1. Select a single transaction, either in the Project Explorer view or a Sheet View.
2. Right-click the selection, hover over Performance history, and select the type of timeline analysis to perform. The restrict analysis time period dialog is displayed, as shown in Figure 8-12 on page 202.

Figure 8-12 Restricting analysis time period
3. Select the time period to restrict the display to show only data between the two dates. Click OK. A new view opens displaying a timeline chart. In Figure 8-13, an analysis of transaction ID CRTP in application ID IYCYZC20 is selected.
Figure 8-13 Transaction ID CRTP in application ID IYCYZC20
The timeline chart displays the following information:
•A view title that contains the name of the analysis, in this case, Response time. You can hover over the tab to show the data source file and number of records in the sample.
•An information bar below the view title that contains the name of the CSV or database file that contains the data, the application ID, and the transaction ID.
•Stacked bars that consist of one bar for each instance of the selected transaction ID in the application ID. Each bar in a stack consists of one or more sectors, each representing a different time field. You can hover over a sector to show the average time value for the CPU time field.
•A Legend icon  in the top left corner of the chart. Click this icon to display the chart legend.
You can select one or more bars and perform a further analysis on the information by right-clicking and selecting a new analysis from the pop-up menu.
By using multiple timeline charts you can compare the way transactions are performing in one CICS region against the way they perform in another CICS region and identify potential problems. Figure 8-14 shows the timelines for the same transaction ID over the same period of time but running under different applications.
Figure 8-14 Multiple timeline charts
For more information about the details in specific timeline charts, see the related links at the end of this book.
8.3.6 Properties View
Another Eclipse view. You can select a single transaction ID from the Project Explorer view or from a chart, and display all of its properties in the Properties View.
1. From the workspace menu, click Window → Show View → Properties. The Properties View is displayed.
2. Select a single transaction in the Project Explorer view, Sheet View, or a chart view.
All of the details for the selected transaction ID are displayed in the Properties View, as shown in Figure 8-15.
Figure 8-15 Properties view
8.3.7 Integrating with other plug-ins
The CICS Explorer provides contextual menus that are populated based upon what type of object is currently selected and what other plug-ins are currently loaded.
A single selection is represented by a row in the Sheet View, a column in a bar chart, and a detail view or a single transaction in the Project Explorer, which represents a single instance of a summary record and has specific information regarding the transaction ID and Applid. Consequently those parameters can be used as contextual parameters within the Interdependency Analyzer plug-in or the System Management plug-in, as indicated in Figure 8-16.

Figure 8-16 Contextual menus
Figure 8-17 shows the dependencies.
Figure 8-17 Dependencies
8.4 CSV data extraction process
In this section, we discuss the CSV data extraction process.
8.4.1 Server process
CICS PA provides report forms to enable a CSV data extract to be created using the Extract and Export option of the CICS PA Report Sets panel.
For CICS PA V2.1 users, a new Sample Summary Extract Report Form EXPLORE3 is provided by APAR PK71846.
For CICS PA V3.1 users, a new Sample Summary Extract Report Form EXPLORE4 is provided with the product.
When you create the CSV extract report, make sure that the Extract Format delimiter is set to a comma rather than the default semicolon. You can then download the CSV file to your workstation to be used within the CICS PA plug-in.
8.4.2 Plug-in process
You can load CSV data into the CICS PA plug-in using three ways:
•Copy and paste
•Drag and drop
•The import function of CICS PA plug-in
|
Other plug-ins: Using an application other than CICS PA plug-in to make changes to the CSV file might cause errors and make the data unusable by CICS PA plug-in.
|
Locate the performance data file that you want to analyze and follow one of the methods below to load the data into the CICS PA plug-in.
Using copy and paste
To copy and paste a file into PA Explorer:
1. Copy the data file by right-clicking and selecting copy from the menu.
2. In the Project Explorer view, select the folder where you want to store the data.
3. Right-click, and select Paste from the menu.
A copy of the data file is now in the CICS PA plug-in and available for analysis.
For further information about loading data and other Eclipse functions, see the Eclipse workspace User Guide.
Using drag and drop
To drag a file from your file manager and drop it into PA Explorer:
1. In your file manager, select the data file.
2. Use your mouse to drag the file across to the Project Explorer view.
3. Put the cursor over the folder where you want to store the data file, and release the mouse to drop the file into the folder.
A copy of the data file is now in the CICS PA plug-in and available for analysis.
Using the Import function
To import a file into PA Explorer from your local file system using the Eclipse import function:
1. Right-click anywhere in the white space of the Project Explorer view, and select Import.
2. In the Import dialog box, select File System. To assist in locating the file system, you can type File System in the text field. Click Next.
3. In the Import wizard, enter the directory path of the data, or click Browse, and select the directory from the list. All of the files in the directory are displayed in the Import wizard.
4. Select the data file to be imported.
5. In the Into folder text box, type the name of the folder where the data will be stored, or click Browse, and select the target from the list. Click Finish.
A copy of the data file is now in the CICS PA plug-in and available for analysis.
8.5 Database extraction process
In this section, we discuss the database extraction process.
8.5.1 Server process
CICS PA also enables SMF data to be loaded into a DB2 table by first loading the data into a Historical Database (HDB). From the HDB, you can export the data to a DB2 table or to a CSV file to use in the CICS PA plug-in.
The steps to Load CICS performance data from an SMF file into an HDB and exporting the data from an HDB file to a DB2 table or a CSV file are in Chapter 4 of the User’s Guide for CICS PA Version 3.1. See IBM CICS Performance Analyzer for z/OS User’s Guide Version 3 Release 1, SC34-7046-00 for more details.
8.5.2 Plug-in process
You can analyze CMF performance data that is produced by CICS Performance Analyzer for z/OS and stored in a database:
1. From the workspace menu bar, click Window → Preferences.
2. Click IBM CICS Performance Analyzer → Data sources. The Data sources dialog for CICS Performance Analyzer is displayed in the Preferences view. If it was pre configured, you see the connection details displayed; otherwise, the fields are blank. Figure 8-18 shows the PA Data sources dialog, which contains sample connection details to a DB2 database.
Figure 8-18 CMF performance data
3. Click New to create a new connection.
4. Complete the fields with the details that your system administrator provided. Table 8-1 provides a description of the fields.
Table 8-1 Option description
|
Option
|
Description
|
|
Name
|
The local name that is used to identify this database connection. The name can be anything you choose and is used only to help you distinguish between different database connections.
|
|
Preferred
|
Denotes the default data connection when accessing the plug-in from another plug-in.
|
|
Server Address
|
The TCP/IP host name of your database server.
|
|
TCP/IP Port Number
|
The port used to access the server.
|
|
Database Name
|
The name of the database on the server.
|
|
Schema (Qualifier)
|
The name of the schema that is used for the database.
|
|
Userid
|
Your authorized user ID for the database.
|
|
Password
|
Your password for the system. If you leave this field blank, you are asked to enter your password when the connection is attempted.
|
|
Save Password
|
Clicking this box saves your password on your computer.
|
5. Click Apply to save the configuration.
6. Click Test Connection.
When Test Connection is clicked CICS PA plug-in attempts to connect to the database that you configured. If you did not previously enter your password, you are asked to enter it now.
If the connection is successful, a message box opens at the bottom of the Data sources dialog showing the status, and you can now select data for analysis.
If the connection is not successful, the message box displays an error message that provides a reason for the failure. Check the values in the fields, correct any errors, and click Connect to test the corrections.
When the connection is successful, click OK to close the Preferences view.
If you did not click Apply, you can cancel the process and close the Preferences view without saving the new connection, by clicking Cancel. If you already clicked Apply, you must click Delete to remove the connection.
You can use the Data sources preference page to maintain multiple connections, which allows you to specify many different databases
Project Explorer CPA file definitions
To use the database table in the Resources View you must define the table based upon the database connection that you previously defined:
1. From the Project Explorer, select either a Project or Folder in which you want to create a link file.

Figure 8-19 CPA file definitions
Figure 8-20 on page 212 shows the data source.
Figure 8-20 CICS Data source
3. Select New CICS Data Source Node, which displays Figure 8-21 on page 213 with default values populated, where available.
4. The Data source defaults to the Default Data Context but can be changed to another. The filename defaults to the data source with an additional cpa extension. The table name defaults to EXPLORER_SUMMARY in accordance with the server data extraction requirements.
5. Press Finish.
A link to the database table is now in CICS PA plug-in and available for analysis.
Click the Properties menu option on a cpa file (Alt-Enter shortcut) to access methods to alter some of these settings and test that the connection with the table works.

Figure 8-21 Properties
Default data context
It is important to note that when CICS PA plug-in is accessed from another plug-in, a default data context is used based upon the Data source that is specified as preferred. In addition, the table name must be described as EXPLORER_SUMMARY.
..................Content has been hidden....................
You can't read the all page of ebook, please click here login for view all page.