This chapter will provide you with step-by-step instructions to access IBM Watson for the very first time, explain the different versions (of IBM Watson) that are currently available, and make recommendations for performing typical configurations or adjustments for use. We will define the "Watson Analytic" landscape by describing the current content analytics architecture, as well as introduce you to the most important concepts and terminologies needed to take advantage of Watson. Finally, we will wrap up with some helpful advice to go forward.
We'll break down the chapter like this:
- Step by step
- The content analytics architecture
- Important concepts and terminologies
- Generally good advice
IBM Watson was named after IBM's first CEO and industrialist Thomas J. Watson. This supercomputing system was specifically developed to answer questions on a quiz show called Jeopardy in 2011, while celebrating the centenary year of IBM. During the last 5 years, IBM has been investing significantly in cognitive computing in business and technology and popularizing the brand name Watson, having multiple products with cognitive power. IBM Watson Analytics is one of the products by IBM, hosted on the cloud with useful analytics capabilities. In this book, most of the important features of Watson Analytics are described with illustrative examples and exercises.
If you haven't been exposed to IBM Watson before, the quickest and easiest way to get going is with the free cloud version. Google it, or (at the time of writing this book) you can visit http://www.ibm.com/analytics/watson-analytics/.
The site content found at this URL is updated regularly. At the time of writing this book, the following is the Watson Analytics page:

It's worth pointing out before we move on from this point that this website is full of valuable information—documents and videos—designed to give you all of the marketing and sales information that you want. I recommend that you take sometime and absorb what you can.
The following are the steps to perform to access IBM Watson Analytics. It's quick and easy, so let's get started!
- I always recommend that you read the privacy statement. This is accessed via a link in the top-right corner of the page: I accept IBM's Privacy Statement. This is important because while you are using Watson, IBM will be collecting your personal use information:
- To fulfill your requests
- To contact you for customer satisfaction surveys
- To support the products or services that you have obtained from IBM
- For marketing purposes
- To personalize your experience
- Create a free account by entering a valid e-mail address in the Email address space and clicking on the Create Free Account button, as shown in the following screenshot:

- From there, you will see the Watson Analytics Registration Form, which you will need to fill out—providing your e-mail address—as shown in this screenshot:

- Once you click on the Register button, you will see the Thank you for registering to use Watson Analytics page, like this:
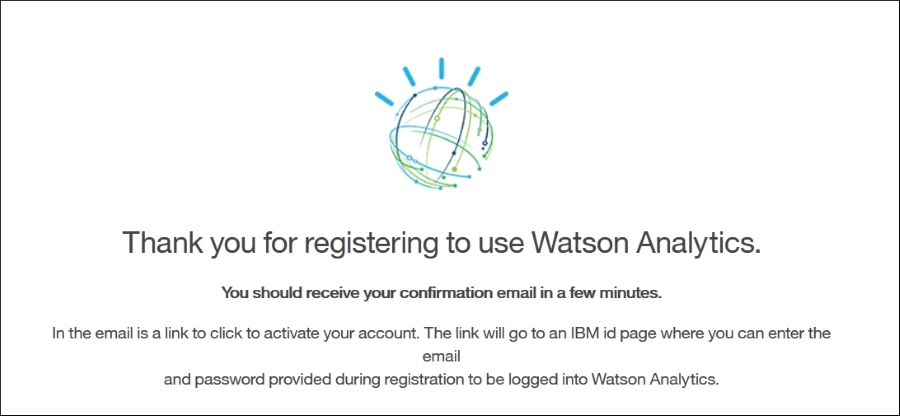
It's that easy! You are now an officially registered Watson user. You can now log in and start using the tool.
Within a short period of time (after completing the registration process), you will receive the Welcome to Watson Analytics e-mail (sent to the e-mail account that you used during registration):

This e-mail will contain some helpful links, such as:
- The login (main page) URL (https://watson.analytics.ibmcloud.com)
- The Watson Analytics Experts Blog
- The Watson Analytics Resources and Quick Find
Use this e-mail to click on just log in and then bookmark the page in your favorite browser.
Let's explore the main page, or the welcome page, of IBM Watson Analytics.
Across the top of the page is the Welcome bar (or panel), as follows:

- Clicking on Welcome (in the middle of the bar) always returns you to the welcome page.
- The name with which you registered will appear as the next link on the bar. Clicking on your name allows you to:
- Clicking on the ? sign will display the
docs/tours/hintspopup. - Clicking on the far-right graph icon accesses the Watson Collection popup (collections will be discussed later in this chapter).
Clicking on your name and then on My Account will display the User account popup, as shown in the following screenshot. This popup will give you the total space allowed (based on your version of Watson) and the space you have used up to date:

If you are interested in upgrading (and you most likely will at some point), you can click on Upgrade. Watson then directs you to a contact page, where you can read (or talk to a person live) how and why to upgrade from your free vision of IBM Watson.
At the time of writing this book, IBM offers three versions:
- Free Watson (you're using it now; it is referred to as the Freemium version)
- Personal
- Professional
Basically, the difference between these versions is in the number of users allowed, the available space to store your data files and Watson's ability to connect to various data sources. Our freeware version basically forces us to use text/delimitated or CSV files and (of course!) Microsoft Excel files.
In earlier versions of Watson, the Main or Welcome page included a Learn more about panel (shown in the next screenshot). This panel included a video link (a large panel to the left) and four subpanels that gave you quick access to the main functionalities of Watson:
- Explore: This is where you can add your data
- Predict: Use this to ask Watson to point out insights within your data files
- Assemble: Use Watson to create presentations of identified insights
- Refine: Tweak your data files for further discoveries:

Note
This panel can be hidden and reshown whenever desired. In the updated version of Watson this panel has been removed, but you can find plenty of information to help you get started with using Watson under Docs and Featured topics (more resources exist, including a library of how-to videos, which we will cover in Chapter 8, Adding Value with Integration).
At the top of the welcome page, you will find Watson's shortcut panel bar, as shown in the following screenshot:

Using this panel, you can perform searches and access the Add, Filter, and Sort features of Watson:
- Search: Using the Search feature, you can quickly locate artifacts and information within the Watson environment. Simply start typing a text string to ask Watson to locate what you are interested in. Oddly, the panel search works differently from the ? help mentioned earlier. For example, using the ? help, you can add a wildcard as follows:
- CON*: The panel search does not support the wildcard, so the following works:

- Add: Clicking on Add (on the shortcut bar) displays the Add popup. Here, you use Create something new or Or add your data:

If you select Add and then Create something new without previously adding data (to the Watson environment), you won't be able to do much with Explore, Predict, Assemble, and Refine, so let's skip these (for the moment) and walk through the Or add your data section.
Starting by clicking on the left Drop file or browse, Watson presents a typical browse dialog so that you can locate a file to upload.
Let's walk through a quick, simple example. I have a file from a transportation-for-hire service with real-time information about the locations of its taxis, as shown in the following screenshot:

Once you select the file, Watson uploads it:

Once Watson is done uploading your data, it's ready for exploration (more about this soon)!
In addition to the Drop file or browse functionality, Watson provides an upload data (displayed in the bottom center of the Add popup). Clicking on this option displays a new and interesting popup:

Browse provides the same functionality as described previously under Drop file or Browse, while Twitter is really an advertisement suggesting that you upgrade to a paid version of Watson; that is, if you click on Twitter, Watson will politely suggest that you upgrade your subscription level:

Now that we have (at least some) data in Watson, we can do something with it! Let's start by clicking on Explore. This will open the Create new exploration popup (shown here):

On this popup, you will see a list of files already uploaded to Watson (we only have one so far—TaxiLocationsData—so it's a pretty straightforward process to find it).
A search is located at the top of the popup (right under Choose a data set), and you can sort the list of files by Name, Type or the Modified date (by clicking on the respective column title).
Can't see your file? You can access Drop file or browse or Upload file from the bottom of this popup without having to go back to the Main or Welcome page and adding it.
Once you click on to select your file, Watson displays the Exploration page, where you can establish your file's starting points. Starting points are a list of (potentially) interesting facts about your data. These facts can lead you to expose additional particulars about your data that may not have been initially obvious.
Watson may provide one or more starting points (depending on your data), which you can select to get going, or you can establish your own (starting points) by asking a question. In our data example, Watson tells us, There are no starting points that match your keywords, like this:

By using Microsoft Excel, I know a few things about the data—what fields (Timestamp, Latitude, Longitude, Device_ID, and DATA_SOURCE) are in the file and how many rows (5,487) there are in the file. But does Watson know? Let's see…

First, notice that across the bottom of the page is now a field ticker, which lists each field that Watson found in our file as well as any fields that it can derive, for example Year, Month, and Day (all derived from the Timestamp field):

Let's start by asking a simple question about one of the fields: what fields are in timestamp. To do this, I just type my question as if I were asking a human and click on the blue magnifying glass icon (on the right). Watson quickly responds with several suggestions for starting points, as follows:

You can click on any of the starting points to begin your exploration. Starting with the upper-left option (What is the trend of the number of Rows over Timestamp?), Watson displays this:

Let's dissect what Watson has provided; the following is the page separated into four sections:

Across the top of the page is the original starting point question, in the left-middle is the visual representation of the result (of the starting point question), in the right-middle is the visualization configuration section, and across the bottom is the starting point tool bar:
- Original starting point: Notice that the field names from the file that are part of the original starting point question are hyperlinks. Clicking on these fields allows you to change the file field reference. Clicking on the circled X mark on the right of the section clears the starting point question.
- Visual representation: This is Watson's visualization for the starting point question based on our data.
- Visualization configuration: This is where you can modify the Watson visualization by clicking on the gear icon in the top-right corner. Watson allows you to filter the selected visualization columns and add or remove columns. The visualization value can also be changed.
- Starting point toolbar: The starting point toolbar is made up of three action sections. They are Filter (far left), Navigate (middle) and Administer (far right): Filtering is accomplished by selecting a column and defining a filter condition:

- Navigate allows you to switch between a thumbnail view and the current page view or (add) a New exploration view:

- Administer provides the ability to add a selected exploration to a Watson collect (of explorations), change visualization types, and set specific options for the selected visualization type:

- Starting point toolbar: The starting point toolbar is made up of three action sections. They are Filter (far left), Navigate (middle) and Administer (far right): Filtering is accomplished by selecting a column and defining a filter condition:
- Filter: Back on the Watson shortcut bar is Filter. This feature allows you to set what Watson displays for you on the welcome (or main) page. By default, Watson is set to show All (as indicated by the check mark to the left of the selection), which means that you'll see panels for your datasets, explorations, predictions, views, and even social media projects. Once you become more familiar with Watson, and based on what you may be currently working on, you may want to clear the page and show only the panels that you are interested in. Simply clicking on Filter and then on the panel type (or types) that you want Watson to display will refresh the welcome page to the desired view:

- Sort: Also available on the shortcut bar is Sort. It allows you to organize the panels on the welcome (or main) page by displaying them:
- In alphabetical order
- By the last modified date
- By the date of creation

Although there is still quite a lot more to learn, we've now touched on the basic mechanisms of the IBM Watson interface. So, we will move on to a discussion on the content analytics architecture. In later chapters of this book, using case studies, we will provide more details.