
9
Route Optimization for Perishable Goods Transportation System
Kowsalyadevi A. K.1*, Megala M.2 and Manivannan C.3
1Department of ECE, PSG Institute of Technology and Applied Research, Coimbatore, India
2Department of AMCS, PSG College of Technology, Coimbatore, India
3Department of Mechanical Engineering, Coimbatore Institute of Technology, Coimbatore, India
Abstract
The chapter aims to provide an optimal solution to find the most suitable routes for a fleet of vehicles performing the transportation of goods by visiting a set of market hubs. Additionally, the method concentrates to minimize the empty trips that tend to cost, vehicle usage, fuel consumption, manpower, travel time, and CO2 emission, respectively, thereby avoiding long routes. Primarily, a clustering algorithm is used to classify the market hubs in the entire city and nearby cities based on a threshold time and distance. Subsequently, deciding the optimal group size, the supply depot, and the required number of vehicles to be transported at a particular time and distance is performed. The dynamic approach is possible for the entire region or state as the concluding procedure in distributing the perishable goods on time with the lowest of trash.
Keywords: Vehicle routing, clustering, perishable goods carrier system, shortest route
9.1 Introduction
- Logistics is not just transporting goods. The human effort involved in planning, managing, and tracking dispatches often that leads to inefficiencies, complications, and unhappy customers. To simplify logistics, there is a need for an advanced algorithm that automates and optimizes deliveries. Through a smarter route planning and better tracking features, it is possible to achieve voluminous returns such as smart events, reporting and simulations, notifications and tracking, quicker and timely deliveries, and robust communication.
- Route optimization determines the most reliable cost-efficient route from one point to another vide a critical process. However, it is not the same in obtaining the shortest distance among the two or three points. Since, there are various relevant factors needs to be considered during route optimization. One of the factors is total number and location of all facilities on the route. Then, another factor is arrival or departure of a time gap, effective loading, etc. The vehicle routing problem (VRP) includes lot of constraints, such as number of vehicles, cost, and time.
9.2 Related Works
There is a significant increase in recognition to the importance of logistics management in present decade [1]. In recent years, a considerable increasing research interest is toward agribusiness that involves supply chain. Earlier, the revolution started in Europe and USA toward consolidation of organizations, along with government deregulation of agribusiness markets [2]. In addition to it, interest in food safety, competition in agribusiness markets, and quality management systems [3] were also increasing [4]. Agriculture logistics denotes handling the relationships between the businesses, which is accountable for efficient supply chain of products from farmers to buyers. Apart from the agriculture produces agriculture logistics should be consistent to meet the consumer requirements in relation with quantity, quality, and price. In spite of a sustainable agribusiness, current status of agriculture logistics in India is not effective and still complicated leading to reduction in the transport quality of the produces from the farmers to the consumer and thereby increasing the cost of produces [5]. Owing to high importance of the logistics in agriculture, researchers are trying for the integration of agricultural marketing system and logistics that starts from what to produce and how to produce [6]. Also, the recent work infers a strategy to reach the destination by ensuring high quality and quantity of the products.
Assuming the current state of Indian agriculture logistics sector discloses that various technical and structural changes lead to high requirements for quality management [7]. In agriculture logistics, there is a continuous change in the quality with respect to time. Additionally, the quality degradation begins as soon as the raw material leaves from the farmers to the consumer. Therefore, the management of the timely delivery of produces [8] and services at the lowest possible cost is an effective practice for achieving sustainable agribusiness success.
At present, the consumer expectation is in the direction of “fresh on demand” with higher supply. In addition to that, their specific need in terms of agriculture logistics is tracking and tracing on quality management systems [9]. Therefore, agriculture market is not only toward harvesting and consuming but also considering the effective transportation from harvesting area to consumer place. In Indian agriculture logistics, the produces are transported in an inappropriate way through the unorganized market [10].
Therefore, Indian agriculture logistics demands the need for implementing optimized agriculture logistics network [11]. In general, the distribution of fresh-agriculture produces such as vegetables, fruits, and cereals from farmer to consumer is complicated process, owing to the perishable nature of this agricultural produce [12]. Consequently, the development of proper agriculture logistics network is most important to retain freshness and reduce post-harvest losses [13].
In developing countries, post-harvest loss is about 24% and 40%. As in developed countries, the post-harvest losses are 2% and 20%. Therefore, this leads to increase in price and the farmer facing profit losses [14]. Mostly fresh produces are harvested by farmers, but those fresh produces do not reach the consumer with good quality. Likewise, those produces are transported to another market in the same way but in different packing. Intermediaries acquire variety of produces from farmers and offer to the consumers. The intermediaries consequently develop relationships with consumers and farmers. In addition to that, they are maintaining exchange relationships for which they compete with others [15]. Therefore, intermediaries practice the essential business functions of exploring market exchange chances [16]. The intermediaries play a major role in the economy by bridging the gap present in the market network. Intermediaries are specialized individuals’ person in performing various marketing roles and interpretation participating in the marketing of agriculture produces [16].
The complexity of agriculture logistics network and mishandling by the intermediaries has significant role in agriculture logistics management and the post-harvest loss management [17]. The Indian agriculture logistics needs optimized network to retain freshness and reduce post-harvest loss. The above sections explained about the need of optimization in Indian agriculture logistics. Therefore, it is clear that agriculture logistics need to be optimized without eliminating markets. The optimization begins with modeling and ends with solutions. The modeling is a most powerful tool to optimize any system. That modeled system can be solved using many algorithms. The algorithms are nothing but optimizing tool for any modeling and are classified into heuristic and metaheuristic. The researcher can choose any one of the algorithm to solve their modeling.
9.2.1 Need for Route Optimization
It is essential to handle hundreds and even thousands of delivery points every day. For an assumption, a fleet contains 100 trucks and there is a need to draw a delivery plan for those trucks in “n” locations every day. The system needs to plan for minimizing the cost and, at the same time, maximizing the efficiency. It is possible to achieve and manage the system with appropriate vehicle routing planning. Solving mathematical model with many constraints like number of vehicle, vehicle capacity, time, distance, number of produces, number of depots, fragmented deliveries, human resources, and traffic and road conditions is challenging. Although finding a solution is challenging, it will be useful if the solution is found.
When the VRP is solved, it is certainly feasible to improve the utilization of vehicles. Scilicet means the possibility to transport more quantity of goods at the same time. Consequently, the traveling time of fleets will be reduced. So, it is possible to save lots of logistics cost which combining all these make customers more satisfied with services. As per the literature, routing problem can be solved in three approaches. The first manual approach is the most effective way to solve with the given constraints. But this approach takes several hours to find solution. The second approach is a bit faster by using pre-set solvers, but those solutions only meet some basic constraints. These can only be used in mathematical education systems that do not apply to the real world. The utilization of advanced computing is the final and efficient approach. Overall, the route optimization technique is needed to solve the route problem in instants. The chapter proposes the routing optimization which eliminates all manual planning and generates the optimal route automatically.
9.3 Proposed Methodology
The proposed method of routing is divided into three phases. Namely,
- Hub Count Identification,
- Key Hub Identification, and
- Vehicle Route Identification
In the hub count identification phase, being the initial stage involves the process of collecting the details of the market hubs location for the entire city or state in the mode of a distance matrix vector. A distance matrix is the two-dimensional square matrix containing the distances, taken pair wise, between the elements of a set. As all diagonal values are zero, there will be no distance between the same location. Therefore the distance matrix is symmetric. Being the initial stage, the hub count identification phase involves the process of collecting the details of the market hub’s location for the entire city or state in the mode of a distance matrix vector. A distance matrix is the two-dimensional square matrix which contains the distances, taken pair wise, between the elements of a set. This distance matrix is symmetric in nature and therefore all diagonal values are zero which means that the distance between the same location is zero. The distance matrix which holds the distances between different market hub locations is an array that is denoted with a measurement unit called meters. The term referred as num_locations which is the count of the number of market hub locations. The term num_vehicles denote the number of vehicles in the fleet, and the term depot represents the index or the unique id of the depot is for denoting the location where all vehicles start and end their routes. It is mandatory to assign the appropriate XY coordinates to the market locations in the state after the process of computation of the distance matrix. In the considered problem, the distance matrix is precomputed since the location coordinates are not included in the problem data which is required to solve the routing problem. The precomputed distances between the market locations are calculated using Manhattan distance by considering the distance between two points, (x1, y1) and (x2, y2) that is defined to be |x1 − x2| + |y1 − y2|. Google distance API can also be a handbook to acquire the relevant distance matrix for any given set of locations in the world. This phase involves a distance call-back which effectively return the distances between the market locations and passes it to the next step. The call-back method also sets the curve costs, which define the cost of travel, to be the distances of the curves.
Silhouette analysis is performed to obtain the optimal number of clusters. The separation distance between the resulting clusters trained using Silhouette analysis. Silhouette plot displays that each point of a cluster is closer to the points in neighboring clusters. This measure has a range from −1 to +1. It provides a way to visually estimate parameters such as multiple clusters. If the sample is far away from the neighboring clusters, then silhouette coefficients will be near the range +1. A value of zero indicates that the end between two neighboring clusters is near or significantly closer to the boundary. Negative values indicate that those samples may have been assigned to the incorrect cluster.
In the key hub identification phase (Table 9.1), clustering begins by calculating the distance between each pair of units facing the threshold distance. The method intends to the key hub optimization through city planning via clustering. The K-means clustering algorithm is preferred for grouping the market hubs based on the adequate distances for all market depot locations in the entire state/city region. The algorithm is necessary to reduce the sum of the distances between the points and the respective cluster centroid. These cluster centroids for each group becomes the key market hub of each cluster. Once the key market hub is identified from K-means algorithm, it is essential to optimize the routes at this centroid. Examples are customer segmentation (what people kind of belong together, group them together), social network analysis (might look at sentiments, what kind group of people like something and dislike something), and city planning (segmenting like industrial zone and commercial zone). Key market hubs in the middle of whole city and neighborhood cities or centroid point (location) of each group need to be identified for the requirement of route optimization centred on threshold distance.
Table 9.1 Phase 2: algorithm for key hub identification.

Key market hubs in the middle of whole city and neighborhood cities or centroid point (location) of each group are identified.
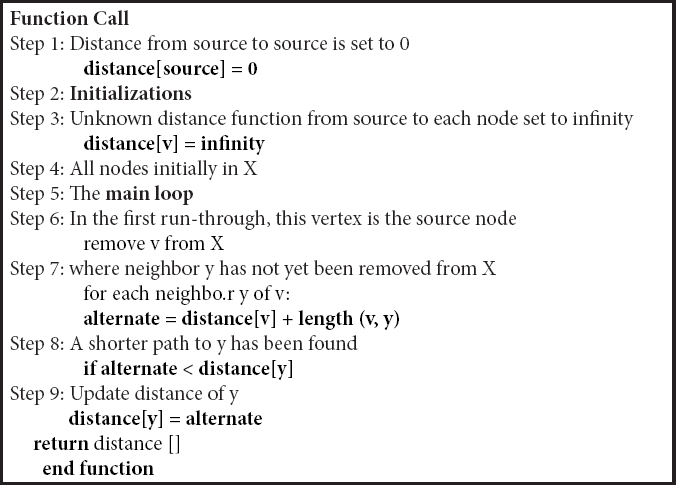
Finally, it is necessary to work for an individual cluster and find the minimum length of the longest single route in a sufficient number of vehicles. The vehicle route identification phase (Table 9.2) should define the optimal routes to reduce the length of the longest single route between all vehicles. This is the perfect explanation if you want to complete all deliveries as soon as possible with time and distance constraints. Vehicles are required to pick up goods at each market they visit, but capacity control and time window are required to visit each market. The vehicle should reach the market with maximum carrying capacity and reach within a specific time window are major constraints. To imitate the requirements, link state algorithm is applied. Each node creates a connection map with the network where the nodes are connected to the other nodes. The next best logical path is calculated from each independent node and at every possible point in the network. The routing table of the node is formulated from the collection of best paths. Dijkstra algorithm is used to identify the next node internally.
Table 9.2 Phase 3: algorithm for vehicle routing.
9.4 Proposed Work Implementation
The first phase of the proposed method is integrated with a .csv file containing the real-time market data of Tamilnadu state. A 282 × 282 data is being considered for simulation, i.e., distance matrix used for processing. By applying the silhouette method, it is possible to choose the optimum number of clusters.
If the cluster is further increased more than the optimum point, then cost would be increasing exponentially and the benefit decreases drastically. Since it is difficult to achieve more gains for higher clusters, hence K becomes the decision point.
From the result and Figure 9.1a, the highest value of s(i) exists for k = 3. Therefore, the optimal number of clusters for the worked out data is 3. For the reason that the cost would be large, whereas increasing the number of clusters and taking decisions at this point is essential for the case. Figure
9.1a illustrates that significant benefit is obtained at optimization of the cost when the K is 3. Optimum number of clusters is obtained from selecting the number of cluster with silhouette analysis.
The main aim of the key hub identification phase is to determine the key market hubs/centroid point from each group and utilize the cluster space. The determination of key market hubs is derived from the K-means clustering process. This process needs to visit its other submarket locations in a city represented using the identical rectangular blocks. Figure 9.2 shows an example city with the key market hub marked in red and the submarket locations to visit in blue. This red node acts an initial supply point, thereby proceeding to the vehicle routing phase.
In the vehicle route identification phase, it is necessary to create the distance dimension, which calculates the total distance each vehicle will travel in its path. In each case, cost proportional can be set to the maximum ratio of the total distances. Routing programs are used as dimensions to track the number of the vehicle accumulated in the path of a vehicle. Finally, the function shows the total distances of routes and direction to the vehicles. Alternatively, initial routes are saved a list or array and then can be printed.

Figure 9.1 Silhouette analysis on K-means clustering on sample data with n_clusters = 2, 3, 4, 5, and 6, respectively.

Figure 9.2 City market hub marked in red and the market locations to deliver goods in blue.

Figure 9.3 Assigned vehicle route for a key market hub.
The complete procedure is the one that minimizes the longest single route and the output is shown in Figure 9.3. The routing methodology is growing popularly in the transport and logistics industry. Since it reduces the time consumed traveling and at the same time lessens the incurred cost in the process. This should accomplish the optimal routes identified from a depot to a specific location. Each route has separate business-specific constraints, such as vehicle limitations, cost controls, time windows, and resource limitations concerning the loading process at the depot, etc.
Market locations along the routes are marked with their codes in the list of locations. All routes begin and end at the depot (0). The diagram above shows the assigned routes in which the location codes are converted to the corresponding x-y coordinates The above procedure is applied to all main market hubs along with the K-means clustering process. As a part the value of the maximum distance parameter in the distance dimension to the threshold value (e.g., in the region of 150 km) is set. When the modified program is executed, it returns the following output as in Figure 9.4.
Google distance matrix API can also be used to create the distance matrix for any set of locations defined by latitudes and longitudes. It is feasible to use the API to calculate the distance matrix for many types of routing problems. Additionally, if the threshold exceeds the value of 150 km, then new subclusters can be formulated inside the existing cluster group and can iterated with the second and third phase.
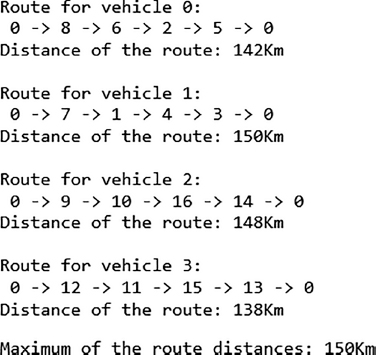
Figure 9.4 Sample output for the depot (0).
9.5 Conclusion
The chapter solves the perishable good delivery problem with silhouette algorithm for identifying the optimal grouping of the sales depot. The key hub identification, i.e., the key sales depot is identified K-means algorithm, thereby leading to the vehicle routing solution. The optimum route is solved by the link state route protocol. The process provides a framework to combine the results, diversify and intensify the search process. The proposed system will be able to identify optimal routes for a set of vehicles traveling in different directions in the city and between states. The solution is much satisfactory for the delivery points ranging between hundreds and thousands. Heuristic approaches would be preferred for large sized applications with varied considerations and set of decision rules. The formulated methods must be robust in order to deal with varied constraints.
References
1. Bosona, T. and Gebresenbet, G., Food traceability as an integral part of logistics management in food and agricultural supply chain. Food Control, 33, 1, 32–48, 2013.
2. Wallenfeldt, J., Agricultural revolution, ed. Encyclopaedia Britannica, inc, 2015, https://www.britannica.com/topic/agricultural-revolution
3. Nordenskjöld, J., Implementation of a quality management system in food production, Master’s Thesis, Swedish University of Agricultural Sciences, 2012, https://stud.epsilon.slu.se/4676/7/nordenskjold_j_120815.pdf
4. Haggblade, S., Modernizing African agribusiness: reflections for the future. J. Agribus. Dev. Emerg. Econ., 1, 1, 10–30, 2011.
5. Sasmal, J., Food price inflation in India: The growing economy with sluggish agriculture. J. Econ. Finance Adm. Sci., 20, 38, 30–40, 2015.
6. Li, J., Liu, Y.-C., Gao, H.-M., Requirement Analysis for the Collaborative Supply and Logistics Management of Fresh Agricultural Products. The 4th Annual International Conference on Information Technology and Applications, EDP Sciences, 2017.
7. Rais, M. and Sheoran, A., Scope of supply chain management in fruits and vegetables in India. J. Food Process. Technol., 6, 3, 1–7, 2015.
8. Zarei, M., Fakhrzad, M.B., Jamali Paghaleh, M., Food supply chain leanness using a developed QFD model. J. Food Eng., 102, 1, 25–33, 2011.
9. Zhong, R., Xu, X., Wang, L., Food supply chain management: systems, implementations, and future research. Ind. Manage. Data Syst., 117, 9, 2085–2114, 2017.
10. Kitinoja, L., Saran, S., Roy, S.K., Kader, A.A., Postharvest technology for developing countries: challenges and opportunities in research, outreach and advocacy. J. Sci. Food Agric., 91, 4, 597–603, 2011.
11. Mishra, A. and Gupta, S., Innovation of agriculture logistics managing food inflation’, KPMG International, India, 2011.
12. Nunes, M.C.D.N., Nicometo, M., Emond, J.P., Melis, R.B., Uysal, I., Improvement in fresh fruit and vegetable logistics quality: berry logistics field studies. Philos. Trans. R. Soc. A: Math. Phys. Eng. Sci., 372, 1–19, 2014.
13. Shukla, M. and Jharkharia, S., Agri-fresh produce supply chain management: a state-of-the-art literature review. Int. J. Oper. Prod. Manage., 33, 2, 114–158, 2013.
14. Adepoju, A.O., Post-harvest losses and welfare of tomato farmers in Ogbomosho, Osun state, Nigeria. J. Stored Prod. Postharvest Res., 5, 2, 8–13, 2014.
15. Haveripeth, K.D., A critical study of law relating to agricultural produce marketing in india, PhD Thesis, Karnatak University, 2013, https://shodhganga.inflibnet.ac.in/handle/10603/14594
16. Kishori, D., Management of regulated markets: A micro study of Duggirala regulated market, A.P., PhD Thesis, Acharya nagarjuna university, 2012, https://shodhganga.inflibnet.ac.in/handle/10603/9832
17. Negi, S. and Anand, N., Cold chain: A weak link in the fruits and vegetables supply chain in india. IUP J. Supply Chain Manage., 12, 1, 48–62, 2015.
- *Corresponding author: [email protected]