
2
An Empirical Study on Paddy Harvest and Rice Demand Prediction for an Optimal Distribution Plan
W. H. Rankothge
Sri Lanka Institute of Information Technology, Colombo, Sri Lanka
Abstract
Rice is one of the main types of nutrient supplying foods in Asian communities and has a direct impact on the socioeconomic development of the communities. Generally, paddy harvest, price, and demand for rice depend on several factors: rainfall, humidity, paddy cultivation area, temperature, etc. Therefore, precisely predicting the future harvest of paddy and consumption demand of rice is complicated. It creates a necessary requirement of a management platform to predict future paddy harvest and rice demands considering important parameters. Such platform will help the countries in the processes of national strategy development, to maintain a sustainable approach between paddy cultivation and rice demand.
We have proposed a centralized management platform, where we would analyze numerous factors affecting on the amount of crop yield on the next harvesting season and the factors affecting on future demand for rice. The proposed platform follows the smart agri/farm approach for paddy related processes, with three functional features: (1) paddy harvest prediction module, (2) rice demand prediction module, and (3) an optimal planning module for crop distribution. Two popular machine learning algorithms, Recurrent Neural Network (RNN) and Long Short-Term Memory (LSTM), are used to develop the prediction modules. The optimal planning module was developed using a heuristic-based approach: Genetic Algorithms (GAs). The algorithm performances were evaluated for Sri Lankan context, using real data sets.
Keywords: Recurrent Neural Networks (RNN), Long Short-Term Memory (LSTM), prediction, planning, and scheduling, genetic algorithms
2.1 Introduction
Rice is considered to be one of the most popular crop grains in Southeast Asia [1]. In the context of Sri Lanka, socioeconomic development of the country is directly affected by rice consumption, as it is one of the major items in any Sri Lankan’s diet. An accurate understanding, with a prediction mechanism for paddy harvest and rice consuming demand, is crucial, as the fluctuations of paddy crops and rice demand directly affect Sri Lanka’s economy, its food security, and citizen’s sustainable lifestyle.
In Sri Lanka, rice is cultivated during “Yala” (September to March) and “Maha” (May to August) cropping seasons, but currently, there is no any systematic approach to predict the paddy harvest or demand of the next season [2]. With the help of machine learning approaches, development of such systematic approach is a timely requirement, as it will be useful for many stakeholders of the process: farmers, traders, consumers, and Paddy Marketing Board of Sri Lanka. A single platform with modules: (1) to predict the harvest on next Yala/maha cropping season, (2) to estimate the demand for rice, and (3) to develop an optimized distribution schedule for rice crop yields, will help to keep the sustainability between supply and demand and ensure food security and enhance farmers as well as consumers standards of living [3].
Therefore, this research aims to find most suitable prediction models using suitable machine learning approaches, that describe trends in past paddy harvest and rice consumption data and then implement an optimized crop distribution schedule. We have implemented a centralized online platform: “isRice: Intelligent and Sustainable Approach for Paddy Harvest and Rice Demand”, with three main components: (1) predict paddy harvest, (2) predict rice demand, and (3) plan crop distribution considering the end users: farmers, traders, consumers, and Paddy Marketing Board of Sri Lanka.
The annual paddy yields and rice consumption can be seen as a sequence of time series, and therefore, when predicting the seasonal paddy harvest and rice demand, many methods applied in prediction of time series can be considered. Recurrent Neural Network (RNN) is one of these methods and it is used with tasks that have sequential data to capture their time dependencies [4]. RNNs have hidden units (state vector) to keep the history of all past elements sequentially and process input sequence accordingly, one element at a time. RNNs are considered to be powerful models for sequence modeling; however, training process of RNNs is very challenging. Therefore, RNNs are further strengthened by LSTM (Long Short-Term Memory) cells: a set of repeated neurons that have been designed to perform well in sequence modeling applications [5]. LSTM cells use a special unit (memory cell) for remembering inputs for a long time and for preventing the problem of vanishing gradient. Therefore, two prediction modules of “isRice” platform are developed using RNN and LSTM.
Traditionally, achieving an optimal plan or an optimal schedule is modeled as an optimization of Integer Linear Programming (ILP), but the process suffers from the inherent characteristic as a NP-complete problem. As such, obtaining solutions for limited, small scenarios might take long time [6]. Hence, for dynamic natured optimization problems, the ILP calculation is considered to be unfeasible, although we can expect an exact solution though an ILP formalization of the problem. With the dynamic nature of rice distribution process, use of an approximation approach (heuristic-based approach) would be better, when planning the rice distribution. Therefore, the distribution panning module is developed a heuristic-based optimization approaches: Genetic Programming (GP) [6, 7].
The front-end of the system is implemented in a user-friendly manner, as a combination of an android platform and a web platform. The android application is for consumers, farmers, and rice mill owners. The web platform is for Paddy Market Board and Rice Research and Development Center.
2.2 Background
Rice is one of the major essential food in Asian communities, and therefore, multiple researches have been carried out on paddy harvest as well as rice demand prediction, as well as planning an optimal distribution for rice crop using well-known approaches. Most of these empirical studies are carried out in the Asian context, as rice is most sought-after crop grains in Asian countries.
2.2.1 Prediction of Future Paddy Harvest and Rice Consumption Demand
To maintain a sustainable balance between rice production and demand of a country, it is necessary to implement proper forecasting models to support decision-making processes. Currently, the Government of Sri Lanka is conducting the “the crop cutting survey” to estimate the average yield of paddy in Sri Lanka at the district level, by calculating the means of a sample survey [8]. A sample of 3,000 villagers for the main season “Maha” and 2,000 villagers for the second season “Yala” are considered for this study. This process requires a considerable amount of manpower, resources, and it is time-consuming [8]. Therefore, it is essential to introduce a systematic approach to gather required data and forecast the paddy harvest and rice consumption, so that the supply and demand is well-known in advance.
Several studies have used a machine learning approach to build models to identify these trends on paddy harvest as well as rice demand. The review work of [9] uses machine learning approaches to predict rice crop of India. Their approach used sequential minimal optimization (SMO) as the classifier, adopting the “WEKA” framework for a data set that covers 27 districts in Maharashtra state (India). They have explored a set of parameters: precipitation, min/max/average temperature, crop evaporation, cultivation area, final production, and yield (Kharif season: mid-June to mid-November) from year 1998 to 2002. The authors of [10] have analyzed the trends of paddy harvest of Sri Lanka for past, present, and future and developed a time series model to predict long-term trends (for 3 years). Following their results, the ARIMA (2, 1, 0), was observed as the as the best fitted model to the used data set, with minimum Akaike Information Criterion (AIC) and Bayesian Information Criterion (BIC). The authors of [11] have identified one of the main reasons for paddy industry problems; that is, dissatisfaction of farmers, even with the self-sufficiency because of the increase in average yield and extent of cultivation. They have explored several variables which are important for paddy production: extent sown with distinct water suppliers, percentage of crop failure, crop production, min/max/average harvest, etc., to investigate the causes for major problems in paddy industry and used statistical techniques as well as time series analysis.
As observed over past few years, paddy price fluctuation is a huge problem for socioeconomic development, and therefore, it is very crucial to have an accurate approach for rice demand forecast. This will create a sustainable balance in the rice industry and avoid unexpected price raises, especially during rice scarcities and manage the surpluses effectively. The authors of [12] present a platform for information gathering/management and a decision-making process for paddy production targeting decision-making authorities as well as farmers. They considered parameters that control the rice demand and predicted the price that is to be expected for rice in well advance using a systematic approach: a decision tree following classification model. The authors of [13] have studied rice production and consumption from the viewpoint of supply and demand in each region and used population of each region to approximate the rice consumption using simple and multiple regression curves. A study on [14] analyzed of food consumption patterns in Sri Lanka. They have examined the variation of food consumption patterns and economic parameters determining the demand for the period. The analysis has done using ADIS model. They have relieved that food consumption patterns are moving from starch-foods to non-starched foods and that Sri Lanka consumers are more responsive for price changes in rice.
2.2.2 Rice Distribution
The Genetic Algorithm (GA) approach is a well-established algorithmic approach for planning and scheduling [15–23]. However, there are only a limited set of research works related to harvest distribution that have used GAs. The study [24] uses a GA-based approach to identify cost-effective cropping pattern that maximizes profits for an Indian irrigation development project. They have considered a set of constraints: continuity, land/water requirements, crop diversification, and storage restrictions. Their results show that GA approach provides reasonable solutions fast, compared to traditional linear programming approach. The authors of paper [25] discuss a novel approach for the logistics facilities for rice distribution, which is a problem that can be categorized as a Vehicles Routing Problem. They have implemented a Taboo Search–based algorithm and optimize the process of distribution centers based on GA. They have mainly focused on sugar production industry and milled rice distribution centers of Thailand, specially targeting export. They propose a framework to minimize the cost of sugar and milled rice transports from the mills to a seaport. The research work on [26] has used Linear Programming method for the optimization of rice allocation for the poor in Bandung. Their work shows that the proposed model plans the rice distribution with minimum transportation and warehouse cost. The work on [27] explores the design of logistics network, including rice supplier, onsite warehouse, and customer distribution centers in Indonesia: the province of Sulawesi. A mixed ILP model has been used to adopt the problem, to minimize the procurement, inventory, and transportation costs.
2.3 Methodology
We have implemented a centralized online platform: “isRice: Intelligent and Sustainable Approach for Paddy Harvest and Rice Demand”, with three main components: (1) predict future harvest of paddy, (2) predict future demand for rice, and (3) plan crop distribution to maintain a sustainable balance between paddy harvest and demand for rice. Two popular machine learning algorithms: RNN and LSTM have been used to develop the prediction modules. The distribution panning module is developed using a heuristic-based optimization approach, adopting GP. The system diagram of “isRice” is shown in Figure 2.1.

Figure 2.1 System diagram of “isRice”.
2.3.1 Requirements of the Proposed Platform
As the initial stage of developing “isRice” platform, we decided to study the existing paddy harvest as well as rice related processes/methodologies in the world. We initiated the process for the Sri Lankan context and carried out interviews (physical and over the phone) and questionnaires to gather information. We have used a data set that includes 80 farmers and 30 rice mill owners covering three districts of Sri Lanka (Anuradhapura, Kurunegala, and Matara).
During our study, we focused on identifying the feasibility and requirements of a management platform for paddy harvest and rice related processes. We expected three responses: (1) a system is highly required (required), (2) a system is required but tends to rely on traditional methods for predictions and planning (not critical), and (3) a system is not required (not required). The results are summarized at the Table 2.1.
Summarized statistics shows that 56.7% of farmers agreed that a proper system is required; 32.5% of farmers agreed for the system but did not see it as a crucial requirement; 17.5% farmers disagreed with the system; nearly, 50.0% of the rice millers’ owners agreed with the requirement of a system; and 38.9% did not see it as a crucial requirement and only 11.1% has disagreed with the system.
Table 2.1 Feasibility study summary.
| District | Farmers | Rice mill owners | ||||
| Required | Not crucial | Not required | Required | Not crucial | Not required | |
| Anuradapura | 80% | 20% | 0% | 50% | 50% | 0% |
| Kurunegala | 50% | 37.5% | 12.5% | 66.67% | 33.3% | 0% |
| Matara | 40% | 40% | 40% | 33.3% | 33.3% | 33.3% |
| Total | 56.7% | 32.5% | 17.5% | 50% | 38.9% | 11.1% |
The statistics proved that the management platform for rice related processes is a timely requirement for both farmers as well as for rice mill owners to keep the sustainability between supply and demand and ensure food security and enhance farmers as well as consumers standards of living.
2.3.2 Data to Evaluate the ‘isRice” Platform
For the training as well as evaluation of the platform, we required historical data about paddy and rice related processes, specifically data on paddy harvest and demands. Since it is a challenging task to gather data from entire country, we decided to select few districts in Sri Lanka that represents the paddy harvesting communities of Sri Lanka.
As observed through our survey, “rainfall” was identified as the major parameter that affects the rice production in Sri Lanka. Sri Lanka can be divided into three climate zones: DZ-Dry Zone, IZ-Intermediate Zone, and WZ-Wet Zone, based on the average annual rainfall. Therefore, we conducted the study for three districts: Kurunegala (covering IZ), Anuradhapura (covering DZ), and Matara (covering WZ).
We gathered paddy harvest and demands statistics for the Anuradhapura, Kurunegala, and Matara districts for year 1990 to 2017, from different sources as follows:
- Paddy cultivation statistics (Yala and Maha seasons): Agriculture Department
- Paddy harvest purchasing statistics: Paddy Marketing Board (PMB) and Department of Census and Statistics.
- Producer’s prices for paddy: Sri Lanka Central Bank.
- Factors affecting annual paddy harvest: Rice Research and Development Institute.
- Factors actors affecting paddy harvesting practices and purchasing prices in different regions: Regional farming centers.
- Consumer behavior factors affecting distribution and transportation: Rice mills owners.
2.3.3 Implementation of Prediction Modules
The two main prediction modules of “isRice” management platform were developed using RNN and LSTM models.
2.3.3.1 Recurrent Neural Network
The RNN is a widely used field of artificial neural networks. In a RNN, connections between each network unit are established sequentially following directed graphs [4]. RNNs have hidden units (state vector) to keep the history of all past elements sequentially and process input sequence accordingly, one element at a time. Therefore, RNNs have the capability to identify the dynamic temporal behaviors of time sequences. With RNN, each element of the sequence will be allocated to the same task, and each node’s output is directly affected by the previous nodes computational value. As RNN utilizes the memory (internal state) to handle the input sequences that are connected, during the training itself, RNN keeps records on relationship of these sequences. Therefore, with the help of these relationship records of all previous inputs, RNN predicts an accurate output. Handwriting recognition, speech recognition, etc., are among the applications that use RNNs to achieve better results.
The structure of RNN is shown in Figure 2.2.
S (a neural network block) takes It (the input) and outputs Ot (the output). A loop is used to pass the information passed from step x to step (x + 1). A RNN can be thought as a collection of n copies of the network a, and each network forwards an output to network a + 1 which is the successor (as output feedback).

Figure 2.2 Structure of RNN.

Figure 2.3 Output feedback for RNN.
An unfolded RNN loop is shown in Figure 2.3, where the chain structure detones that RNNs are generally applied as sequences (and lists).
2.3.3.2 Long Short-Term Memory
The LSTM concept was introduced in 1997 by research Hochreiter and Schidhuber, and they are a special class of RNNs which have the capacity to learn long-term dependencies [5]. Generally, RNNs have a chain of neural network modules, which are repeated, and each repeated module has one tanh layer (as shown by Figure 2.4).
Following the same, LSTMs follow the structure of a chain, with a different structure for repeating modules. As for the LSTM network, a module generally comprises of four neural network layers and three gates (as shown in Figure 2.5).
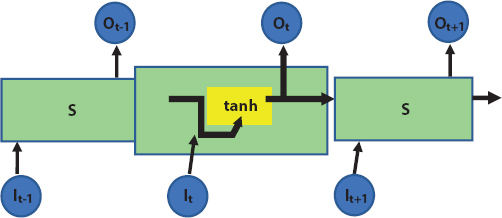
Figure 2.4 Structure of a standard RNN cell.

Figure 2.5 Structure of a standard LSTM cell.
The first gate (forget gate) decides on information that should be removed from the cell state. Considering prior cell output (Ot−1) and present cell input (It), the sigmoid activation layer (σ) is applied for each hidden unit, to get a value between 0 and 1. If the output is a “1”, then network will keep the information whicle if the output is “1”, network will discard the information.
The next gate (update gate) passes Ot−1 and It (the same input), to two activation layers: sigmoid (σ) and tanh (tanh). An element-wise multiplication is performed to two outputs of the respective layers and the result r is obtained. Finally, an elment wise addition is performed to output of “forget gate” and result r. The new indformation is used to update the state.
The third gate (output gate) has the responsible of deciding on the information that will be forwarded to the following state. The layer n’s output, works as the filter that decides the output Ot, that is to be passed to the next LSTM cell.
2.3.3.3 Paddy Harvest Prediction Function
The paddy harvest prediction function was developed with an objective to generate the fittest model for the paddy harvest prediction, with high accuracy. The process was initiated be collecting data, including statistics of paddy harvest for two main seasons (yala and maha) for past 12 years, for three main Sri Lankan districts (Anuradhapura, Kurunegala, and Matara).
The collected statistics comprised of year, annual paddy harvest, and parameters effecting paddy harvest (area of the harvest and annual rainfall). We have selected above parameters considering each parameter’s co-efficient values, especially considering the scale of changes in the paddy production, when changing the input parameters (every 1 unit).
Table 2.2 summarizes the raw data fields used for the study.
For the initial process of organizing the data set, the year was treated as the index of Pandas which is the most widely used python library in data analysis tasks. “Null” values of the data set were substituted with “0”. Next, the fields which are considered to be negligible for the process of prediction (based on the coefficient values) were dropped. The prepared data set is shown in Table 2.3.
The finalized data was used for forecast problem modeling: when the area of paddy cultivation and historical rainfall was given, the system forecasts the future paddy harvest.
Once the data set was finalized, the LSTM was fit to formulate the problem. The data set was prepared for supervised learning approach data set, while input variables were normalized. The harvest prediction was formulated into a supervised learning model; when the area of paddy cultivation and historical rainfall was given, the system forecasted the harvest of the current year (t).
Table 2.2 Harvest prediction: Raw data fields.
| ID | Row number |
| district | Kurunegala/Anuradhapura/Matara |
| season | Yala/Maha |
| year | Corresponding year for data |
| harvest | Seasonal paddy harvest |
| cultivation area | Paddy yield area (per district per season) |
| rainfall | Average rainfall (per crop season) |
Table 2.3 Paddy harvest prediction - Data set.
| Year | Paddy harvest (Mt) | Cultivated area (ha) | Annual rainfall (mm) |
| 2006 | 77,260 | 16,940 | 60 |
| 2007 | 56,500 | 11,760 | 60 |
| 2008 | 170,500 | 38,790 | 60 |
| 2009 | 63,280 | 14,300 | 50 |
| 2010 | 89,630 | 18,340 | 40 |
The organized data set was split into two: train data component and test data component, to fit a LSTM on to the multi-variate inputs. The train data component and test data component were further split into vectors: “x” input and “y” output. Finally, inputs were reformed as to a 3D format, expected by LSTM, with three dimensions: samples, time steps, and features.
The LSTM was defined as first hidden layer with 50 neurons and output layer with a single neuron for prediction of paddy harvest. The MSE (Mean Absolute Error) was used as the parameter to evaluate the model. The model was fit for 250 training epochs with a batch size of 75. We set the “validation data” argument of the fitness function to observe training as well as test losses during the phase of training. Finally, a combination of the forecast and the test data set was inverted for the scaling. The model’s error score was calculated using Root Mean Squared Error (RMSE), using the original scale of forecasts and actual values. Note that the RMSE shows the error value in the similar units of variable.
2.3.3.4 Rice Demand Prediction Function
The rice demand prediction function was developed with an objective to discover the fittest model for the rice demand prediction with high accuracy. The rice demand prediction followed the similar approach (methods and evaluation matrices) as of harvest prediction function.
Table 2.4 summarizes the raw data fields used for the study.
The process of data formatting was same as the paddy harvest predicting function. A final data set sample is given in Table 2.5.
The data set was processed using feature normalization process as input component X and output component Y. The input component X includes annual income, substitute consumptions, and district population, while the output component, Y is the rice consumption. The data set was split into train component (75%) and test component (25%), so that it can be fit to an LSTM for the multi-variate inputs. The data set was fed into LSTM network using Keras, which was built with 100 initial neurons and a single output node. The batch processing ran for 100 epochs with the batch size of 10.
Table 2.4 Demand predict: Raw data fields.
| ID | Row number |
| Year | Corresponding year for data |
| Annual income | District basis, average per person income |
| Annual population | Population for each district |
| Consumption | District basis consumption rates |
Table 2.5 Rice demand prediction: Data set.
| Year | Population of each district | Income (per person) (Rs) | Substitution consumption (Mt) | Rice consumption (Mt) |
| 1990 | 14,846 | 3,549 | 2.6 | 95.2 |
| 1991 | 18,728 | 3,549 | 2.6 | 117.5 |
| 1992 | 19,500 | 3,800 | 2.2 | 118.6 |
| 1993 | 19,600 | 3,540 | 2.5 | 119.9 |
2.3.4 Implementation of Rice Distribution Planning Module
The main objective of rice distribution planning module was to optimize the paddy harvest distribution considering facts such as supply, demand, transportation cost, and storage cost. We have selected four districts of Sri Lanka (Anuradhapura, Polonnaruwa, Kurunegala, and Mathara) as the main rice supplying districts and Colombo, Gampaha, and Kalutara as three main consuming districts.
Traditionally, achieving an optimal plan or an optimal schedule is modeled as an optimization of ILP, but the process suffers from the inherent characteristic as a NP-complete problem. As such, obtaining solutions for limited, small scenarios might take long time [6]. Hence, for dynamic natured optimization problems, the ILP calculation is considered to be unfeasible, although we can expect an exact solution though an ILP formalization of the problem. With the dynamic nature of rice distribution process, use of an approximation approach (heuristic-based approach) would be better, when planning the rice distribution. Therefore, the distribution panning module is developed a heuristic-based optimization approaches: GP [6, 7].
The rice distribution planning module was formulated as a minimization problem, which tries to minimize profit loss due to surplus, profit loss due to deficit, transportation cost, storage cost, etc. Also, we have utilized constraints considering supply availabilities, storage capacities, preferences of consumer for different rice varieties, etc.
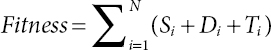
Optimum distribution plan can be derived as the optimization problem given in Equation (2.1):
Minimize:
Where,
| N | Number of consumer districts |
| Si | Profit loss due to surplus in district i |
| Di | Profit loss due to deficit in district i |
| Ti | Total transport cost to deliver rice to district i from supply districts |
2.3.4.1 Genetic Algorithm–Based Rice Distribution Planning
GAs are a subset of evolutionary computing algorithms, which were introduced as a computational analogy of adaptive systems [6, 7]. They are loosely modeled according to natural evolution principles via selection, while having a population of individuals that face the selection process in the presence of different variations, provoking genetic operators: mutation and crossover. Each individual is evaluated using a fitness function, and reproductive success depends on the fitness.
GAs follows five key steps [6, 7]:
- Generation of the initial population P(0) with x solutions.
- Computation of fitness g(p) for every individual solution p in the present population P(t).
- Generation of the following population P(t+1), by selecting y fittest solutions from P(t).
- Application of the genetic operators such as mutation/crossover to population P(t + 1) to produce of offspring.
- Repetition from Step 2 until a termination condition is satisfied.
As shown in Figure 2.6, a solution (optimal rice distribution plan), which is also known as the chromosome is encoded. The n number of chromosomes: CA1, CA2, CA3, and CA4, constructs the solution pool: population.

Figure 2.6 Chromosome structure.
In a chromosome, each gene denotes two main informations: (i) gene index number represents the consumer district and (ii) value in the gene indicates the allocated rice harvest from each supply district. The value of the first gene in first chromosome (CA1) is {100, 200, 300}, demonstrating rice units 100, 200, and 300 have been allocated to first consumer district from first, second, and third supply districts, respectively.
Each of the chromosome in the population is assessed according to a derived fitness function: Equation (2.2).
We have executed mutation and crossover: two genetic operators that produce offspring. The crossover operator is expected to bring in the population to a local min/max and considered as a convergence operation. The mutation operator is expected to pull off one (or multiple) solutions of a population from a local min/max occasionally and explore an improved space. Therefore, the mutation is considered as a divergence operation. Each ith generation of GA approach follows mutations/crossovers.
In the crossover process, as demonstrated in Figure 2.2, we employed the single-point crossover technique to generate an offspring. Initially, we have selected a random point from two chromosomes (CA1 and CA2) and divide each chromosome into two parts. The offspring (CA3) is then created by copying the first part from chromosome 1, and second part from chromosome 2. As demonstrated in Figure 2.7, gene 7 (100, 200, 300) and 2 (400, 600,800) are copied from chromosome 1 (CA1). The gene 3 (400, 900, 140) is copied from chromosome 2 (CA2) to generate the offspring (CA3).
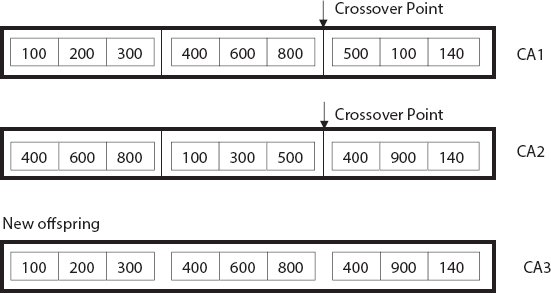
Figure 2.7 One-point crossover.
As the mutation technique, we have used is the swap method, and it shown in the Figure 2.8. Initially, we have selected two genes from a randomly selected chromosome (CA1). The offspring (CA4) is then created by swapping the values of these two genes. The newly generated offspring (CA4) consists of the swapped genes values.
The freshly generated solutions are assessed according to the derived fitness function. The generation-wise process is repeated until a condition is satisfied: either n generations are executed, or the optimal solution (with the minimum fitness value) is found.

Figure 2.8 Mutation: swap operator.
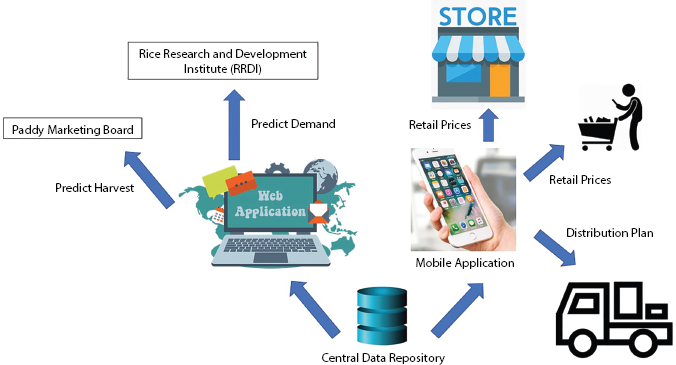
Figure 2.9 Business model of “isRice”.
2.3.5 Front-End Implementation
As shown in Figure 2.9, the front-end of the “isRice” system is implemented in a user-friendly manner, as a combination of an android platform and a web platform. The android application is for farmers, rice mill owners and consumers. The web platform is for Paddy Market Board and Rice Research and Development Center.
Figures 2.10 to 2.12 show main interfaces of the “isRice” system.
Figure 2.10 “isRice” main interface.


Figure 2.12 Demand prediction interface.
2.4 Results and Discussion
This section will discuss the experiments results that measure the performances of “isRice” platform with three main modules: (1) predict paddy harvest, (2) predict rice demand, and (3) plan crop distribution. The prediction functions were implemented using machine learning approaches: RNNs and LSTM. The optimal planning module was developed using a heuristic-based approach: GAs. The proposed algorithms were assessed with real data sets of Sri Lankan context.
2.4.1 Paddy Harvest Prediction Function
The summary for the paddy harvest predicting function is as follows:
- Harvest prediction LSTM network: 200 iterations.
- Performance evaluation: Mean Squared Error (MSE) and RMSE for both training score as well as test score of the models.
- 78% for train score with MSE = 0.04.
- 75% test score with MSE = 0.11.
The MAE for train set as well as test set for paddy harvest prediction function is shown in Figure 2.13.

Figure 2.13 MAE for train set and test set: Paddy harvest prediction.
2.4.2 Rice Demand Prediction Function
The summary for rice demand predicting results is as follows:
- Harvest prediction LSTM network: 90 iterations.
- Performance evaluation: MSE and RMSE for both training score as well as test score of the models.
- 79% for train score with MSE = 0.17.
- 74% test score with MSE = 0.37.
The MAE for train set as well as test set for harvest prediction module is shown in Figure 2.14.
2.4.3 Rice Distribution Planning Module
As the evaluation of rice distribution planning module, we are summarizing the GA approach results, which was used to generate an optimal plan for rice distribution process. As the genetic operators, single-point crossover with two-points swapping mutation were used.
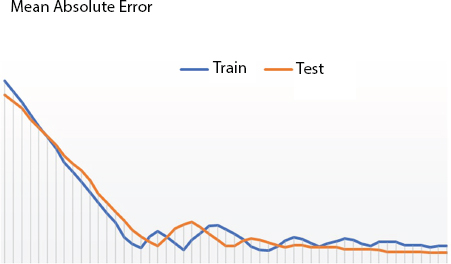
Figure 2.14 MAE for train set and test set: Rice demand prediction.
The key terms used for our experiments are as follows: g (number of generations), Fbest (best fitness value calculated over g generations), AVG (average Fbest), MIN (minimum Fbest), and STD (standard deviation of Fbest), Pm (mutation rate), and P (population size).
As explained in previous sections, the genetic operators: mutation and crossover are utilized to enhance the given initial solution, over n generations. To observe the improvements granted by genetic operators, we performed 30 experiment rounds, where we started with a set of initial solutions, then enhance them by applying GA steps. Since we formulated our problem as a minimization problem, the fitness value needed to be decreased for the solution to be improved. As demonstrated in Figure 2.15, the majority of the enhancements in the fitness function (decrease of the fitness value) were observed during first 200 generations: very early stages of the process.
To identify how the proposed algorithm scales with the increase in number of consumer districts, experiment rounds were performed. We increased the number of consumer districts, to simulate different scenarios and executed the GA with a population with the size of 20 over 200 of generations. Figure 2.16 demonstrates the computational time for different scenarios, as number of consumer districts increases.
We have evaluated our proposed GA to explore an effective mutation rate, to obtain the optimal solutions fast. We have assumed a population with the size of 20 and number of consumer districts are 3. The algorithm was executed for 200 generations. Mutation probability was kept as 0.15 (constant) while the mutation rate was varied. As summarized in Table 2.6, improved solutions are obtained when the mutation rate is low: 0.002: the lowest mutation rate, produced the best fitness value, within a shorter time.

Figure 2.15 Number of generations vs. fitness value.

Figure 2.16 Time vs. number of consumer districts.
Table 2.6 Mutation rate effect.
| Mutation probability | Mutation rate | Average fitness | Best fitness |
| 0.15 | 0.002 | 0.9 | 0.9 |
| 0.15 | 0.012 | 0.95 | 0.9 |
| 0.15 | 0.025 | 1.15 | 1 |
| 0.15 | 0.125 | 1.2 | 1.1 |
Table 2.7 Mutation probability effect.
| Mutation probability | Mutation rate | Average fitness | Best fitness |
| 0 | 0.002 | 1.2 | 1 |
| 0.01 | 0.002 | 1.24 | 1.2 |
| 0.1 | 0.002 | 0.9 | 0.9 |
| 0.15 | 0.002 | 1 | 0.9 |
| 0.25 | 0.002 | 1.15 | 0.9 |
| 0.5 | 0.002 | 1.22 | 1 |
Next, we have evaluated our proposed GA to explore an effective mutation probability, to obtain the optimal solutions fast. We have assumed a population with the size of 20 and 3 consumer districts. The GA is executed for 200 generations. Mutation rate was kept as 0.002 (constant) while the mutation probability was varied. As summarized in Table 2.7, 0.1 mutation probability produced the best average fitness value.
2.5 Conclusion
We have implemented a centralized online platform: “isRice: Intelligent and Sustainable Approach for Paddy Harvest and Rice Demand”, with three main components: (1) predict paddy harvest, (2) predict rice demand, and (3) plan crop distribution considering the end users: farmers, traders, consumers, and Paddy Marketing Board of Sri Lanka. We have analyzed numerous factors affecting the crop yield of the next harvesting season and the factors affecting the future demand for rice. Two popular machine learning algorithms: RNN and LSTM have been used to develop the prediction modules. The distribution panning module is developed using a heuristic-based optimization approach, adopting GP. The algorithm performances were evaluated for Sri Lankan context, using real data sets.
According to our observations, the proposed prediction models can produce precise results in a short period of time. Also, the distribution planning module, which was implemented using GA-based approach, is providing optimal distribution plan within few seconds.
As the future work, we are planning to extend our data set and test our system to have more accuracy and fast performances.
References
1. Dhanapala, M., The Wet Zone Rice Culture in Sri Lanka: A Rational Look. J. Natl. Sci. Found. Sri Lanka, 33, 4, 277, 2005.
2. Crop forecast, Doa.gov.lk, 2018, Colombo, Sri Lanka, [Online]. Available: https://doa.gov.lk/index.php/en/18-english-news/307-crop-forecast-4. [Accessed: 14- Aug- 2018].
3. Pivoto, D., Waquil, P.D. et al., Scientific development of smart farming technologies and their application in Brazil. Inf. Process. Agric., 5, 1, 31, 2018.
4. Hammer, B., Learning with Recurrent Neural Networks, in: Lecture Notes in Control and Information Sciences, Springer, Springer-Verlag London, 2000.
5. Hochreiter, S. and Schmidhuber, J., Long Short-Term Memory. Neural Comput., 9, 8, 1735–1780, 1997.
6. Hartmann, S., A competitive genetic algorithm for resource-constrained project scheduling. Nav. Res. Logist., 45, 7, 733–750, 1998.
7. Mitchell, M., An Introduction to Genetic Algorithms, MIT Press, Cambridge, MA, USA, 1998.
8. Crop forecast, Doa.gov.lk, Colombo, Sri Lanka, 2019, [Online]. Available: https://doa.gov.lk/index.php/en/18-english-news/307-crop-forecast-4. [Accessed: 15- September- 2020].
9. Gandhi, N., Armstrong, L. et al., Rice Crop Yield Prediction in India using Support Vector Machines, in: International Joint Conference on Computer Science and Software Engineering, Khon Kaen, Thailand, July 2016, pp. 1–5.
10. Sivapathasundaram, V. and Bogahawatte, C., Forecasting of Paddy Production in Sri Lanka: A Time Series Analysis using ARIMA Model. Trop. Agric. Res., 24, 1, 21, 2015.
11. Razmy Mohamed, A. and Ahmed Naseer, A., Trends in paddy production in Sri Lanka, Ir.lib.seu.ac.lk. J. Manage., 3, 1, 20–26, 2005, [Online]. Available: http://ir.lib.seu.ac.lk/123456789/47. [Accessed: 30- Oct- 2018].
12. Ponweera, P. and Premaratne, S., Information and decision support system to enrich paddy cultivation in Sri Lanka, Information Technology Research Unit (ITRU) conference, 2018, [online] Dl.lib.mrt.ac.lk. Available at: http://dl.lib.mrt.ac.lk/handle/123/8438.
13. Kubo, M. and Purevdorj, M., The future of rice production and consumption. J. Food Distrib. Res., 35, 1, 15, 2004.
14. Hearath, R.M., Warnakulasuriya, H.W., Thilakarathne, K.G., Gunawardhana, J.A.T.P., Analysis of food consumption patterns in Sri Lanka with special reference to energy intake. Annual Symposium of Department of Agriculture, Sri Lanka, 2013.
15. Rankothge, W., Ma, J., Le, F., Towards making network function virtualization a cloud computing service. Proc. IEEE IM, pp. 89–97, 2015.
16. Rankothge, W., Le, F., Russo, A., Lobo, J., Optimizing Resource Allocation for Virtualized Network Functions in a Cloud Center Using Genetic Algorithms. Proc. IEEE IM, pp. 89–97, 2015.
17. Rankothge, W., Le, F., Russo, A., Lobo, J., Experimental results on the use of genetic algorithms for scaling virtualized network functions. Proc. IEEE SDN/NFV, pp. 47–53, 2015.
18. Muthusinghe, M.R.S., Palliyaguru, S.T., Weerakkody, W.A.N.D., Hashini Saranga, A.M., Rankothge, W.H., Towards Smart Farming: Accurate Prediction of Paddy Harvest and Rice Demand. R10-HTC, 2018.
19. Perera, D., Rathnayaka, C., Dilan, S., Siriweera, L., Rankothge, W.H., Sustainable Tourism: Application of Optimization Algorithms to Schedule Tour Plans. R10-HTC, 2018.
20. Jayasuriya, M.C., Galappaththi, K.T., Sampath, D., Experimental Study on an Efficient Dengue Disease Management System: Planning and Optimizing Hospital Staff Allocation. Int. J. Adv. Comput. Sci. Appl., 9, 11, 50–54, 2018.
21. Fernando, W.D.I. and Rankothge, W.H., Optimization of Customer-Friendly Manual Load Shedding System. ICAC, 2019.
22. Senarath, S.M.M.M. and Perera, M.T.K., Smart Platform for Film Shooting Management. CICT, 2019.
23. Thiranjaya, C., Rushan, R., Udayanga, P., Towards a Smart City: Application of Optimization for a Smart Transportation Management System. ICIAfS, 2018.
24. Komaragiri, S.R. and Nagesh Kumar, D., Irrigation Planning using Genetic Algorithms. Water Resour. Manage., 18, 2, 163–176, April 2004.
25. Ekasingh, B. et al., The Development of Competitive Commercial Agriculture in Northeast Thailand. Multiple Cropping Center, Multiple Cropping Center, Faculty of Agriculture, Chiang Mai University, January 2008.
26. Sutarman, and Hidayat, E., Rice distribution planning for “the poor people” in Bandung, in: Conference Series Materials Science and Engineering, December 2017.
27. Hanafi, R. et al., Logistics Network Design for Rice Distribution in Sulawesi, Indonesia, in: Environmental Sustainability in Asian Logistics and Supply Chains, pp. 45–63, January 2019.
- Email: [email protected]