Chapter 5. Formatting and Sharing Your Plan
Chapter at a Glance
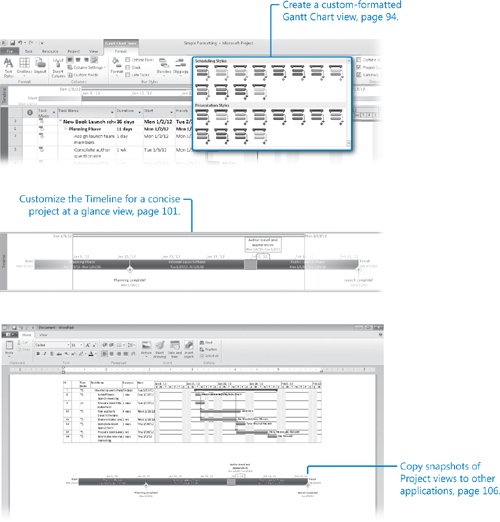
✓ | Customize a Gantt Chart view. |
✓ | Customize the Timeline view. |
✓ | Draw on the chart portion of a Gantt Chart view. |
✓ | Copy snapshots of the Timeline and Gantt chart views to another application. |
✓ | Print views. |
✓ | Edit and print reports. |
In this chapter, you use some of the formatting features in Microsoft Project 2010 to change the way your data appears and then copy and print a project plan.
The primary way in which Project represents tasks graphically is as bars on the chart portion of a Gantt Chart view. These are called Gantt bars. On a Gantt chart, tasks, summary tasks, and milestones all appear as Gantt bars or symbols, and each type of bar has its own format. Whenever you work with Gantt bars, keep in mind that they represent tasks in a project plan.
In some respects, a project plan is really a database of information, not unlike a Microsoft Access database file. You don’t normally see all the data in a project plan at one time. Instead, you focus on the aspect of the plan that you’re currently interested in viewing. Views and reports are the most common ways to observe or print a project plan’s data. In both cases (especially with views), you can substantially format the data to meet your needs.
Tip
This chapter introduces you to some of the simpler view and report formatting features in Project. You’ll find quite a bit more material about formatting, printing, and publishing your project plans in Chapter 11, and Chapter 15.
Practice Files
Before you can complete the exercises in this chapter, you need to copy the book’s practice files to your computer. A complete list of practice files is provided in Using the Practice Files at the beginning of this book. For each exercise that has a practice file, simply browse to where you saved the book’s practice file folder.
Important
If you are running Project Professional, you may need to make a one-time setting change. This helps ensure that the practice files you work with in this chapter do not affect your Project Server data. For more information, see Appendix C.
Customizing the Gantt Chart View
The Gantt chart became a standard way of visualizing project plans when, in the early 20th century, American engineer Henry Gantt developed a bar chart showing the use of resources over time. For many people, a Gantt chart is synonymous with a project plan. In Project, the default view is the Gantt Chart view. You are likely to spend a lot of your time in this view when working in Project.
The Gantt Chart view consists of two parts: a table on the left and a bar chart on the right. The bar chart includes a timescale band across the top that denotes units of time. The bars on the chart graphically represent the tasks in the table in terms of start and finish dates, duration, and status (for example, whether work on the task has started or not). Other elements on the chart, such as link lines, represent relationships between tasks. The Gantt chart is a popular and widely understood representation of project information throughout the project management world.
Tip
By default, Project displays a split view named Gantt with Timeline when you start the program. However, you can change this setting to display any view you want at startup. On the File tab, click Options. In the Project Options dialog box, click General. In the Default View box, click the view you want. The next time you start Project and create a new project plan, the view you have chosen will appear.
The default formatting applied to the Gantt Chart view works well for onscreen viewing, sharing with other programs, and printing. However, you can change the formatting of almost any element on the Gantt chart.
There are three distinct ways to format Gantt bars:
Quickly apply predefined color combinations from the Gantt Chart Style group, which you can see on the Format tab when a Gantt Chart is displayed.
Apply highly customized formatting to Gantt bars in the Bar Styles dialog box, which you can open by clicking the Format tab when a Gantt chart is displayed, then, in the Bar Styles group, click Format, Bar Styles. In this case, the formatting changes you make to a particular type of Gantt bar (a summary task, for example) apply to all such Gantt bars in the Gantt chart.
Format individual Gantt bars directly. The direct formatting changes that you make have no effect on other bars in the Gantt chart. You can double-click a Gantt bar to view its formatting options, or, on the Format tab in the Bar Styles group, click Format, Bar. For more information, see Chapter 15.
In this exercise, you change the formatting of the Gantt chart view.
Set Up
Start Project if it’s not already running.
You need the Simple Formatting_Start project plan located in your Chapter05 practice file folder to complete this exercise. Open the Simple Formatting_Start project plan, and then follow these steps.
On the File tab, click Save As.
Project displays the Save As dialog box.
In the File name box, type Simple Formatting, and then click Save.
To begin, you will display the project summary task to see the top-level or rolled-up details of the project. Project automatically generates the project summary task but doesn’t display it by default.
On the Format tab, in the Show/Hide group, click Project Summary Task.
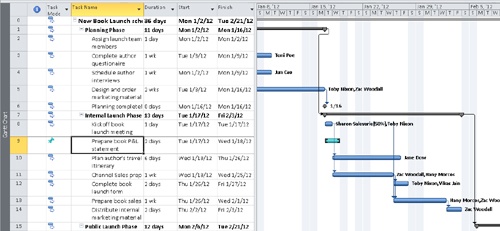
Project displays the project summary task at the top of the Gantt Chart view.
The project summary task, which is always numbered as task 0, contains top-level information such as duration, work, and costs for the entire project. The name of the project summary task comes from the title entered in the plan’s advanced properties in the Backstage view, or if that is blank, Project uses the file name as the project summary task’s name.
Next, you will adjust the colors of the Gantt bars and milestones in the chart portion of the Gantt Chart view. You’ll begin by viewing the Gantt bar for a manual task so you can see how it is affected by the Gantt bar formatting.
In the Task Name column, click the name of task 9, Prepare book P&L statement.
On the Task tab, in the Editing group, click Scroll to Task.
Tip
You can accomplish the same thing by right-clicking the task name and in the shortcut menu that appears, clicking Scroll To Task.
Project scrolls the chart portion of the Gantt Chart view to display the Gantt bar for a manually scheduled task that was previously added to the book launch plan.
Keep an eye on this Gantt bar as we apply a different Gantt Chart style to the project plan.
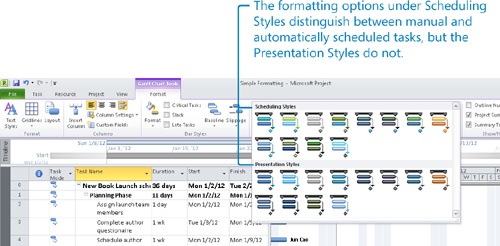
On the Format tab, in the Gantt Chart Style group, click More to display the predefined color styles.
The Gantt Chart styles are divided into two groups:
Scheduling Styles distinguish between manually and automatically scheduled tasks.
Presentation Styles do not.
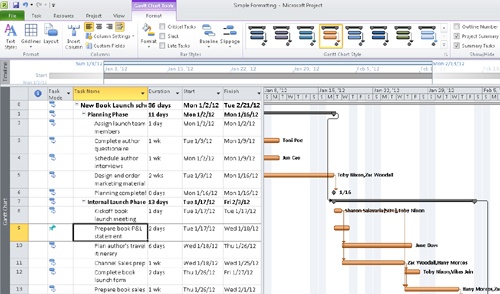
Under Presentation Styles, click the orange color scheme.
Project applies this style to the Gantt bars in the project plan.
The Gantt bar of task 9, the manually scheduled task, is no longer visually distinct from the automatically scheduled tasks.
Applying a presentation style to the Gantt Chart view is an option that you can use when you don’t want to distinguish between manual and automatically scheduled tasks—when showing the Gantt chart to an audience for whom you do not want to make this distinction, for example.
Your next step in this exercise is to reformat a task name so it will visually stand out.
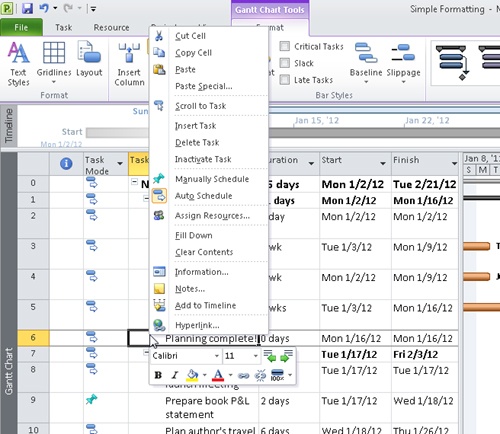
In the Task Name column, right-click the name of task 6, Planning Complete!
This is a milestone task that describes the end of the first phase of the new book launch at Lucerne Publishing. You’d like to highlight this task name.
In addition to the regular shortcut menu, note the mini-toolbar.
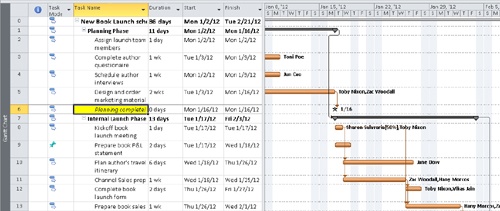
On the mini-toolbar, click the arrow next to the Background Color button, and under Standard Colors, click yellow.
Project applies the yellow background color to the task name’s cell.
Right-click the task name again, and on the mini-toolbar, click the Italic button.
Now the milestone name stands out. You can also format the milestone indicator in the chart. You’ll do this next.
On the Format tab, in the Bar Styles group, click Format and then click Bar.
In the Format Bar dialog box, under Start, click the Shape drop-down list.
Project displays the symbols you can use as a Gantt bar edge, or, in this case for a milestone, as a milestone symbol.
Click the star symbol, and then click OK.
Project uses the star symbol as the milestone symbol for this task.
Tip
In this exercise, you used the Bar command to format a single Gantt bar. You can also customize entire categories of Gantt bars, such as all milestones, via the Bar Styles command. For more information, see Chapter 15.
To conclude this exercise, you will add horizontal gridlines to the chart portion of the Gantt Chart view so you can more easily associate Gantt bars with their tasks.
On the Format tab, in the Format group, click Gridlines, and then click Gridlines.
Under Lines to change, leave Gantt Rows selected, and in the Type box under Normal, select the small dashed line (the third option down), and then click OK.
Project draws dashed lines across the chart portion of the Gantt Chart view.


Customizing the Timeline View
The Timeline view is best suited to display some tasks from the Gantt Chart view in a less complicated format. The Timeline view is especially well suited for conveying quick summaries of project plans, as you will see in this exercise. Later in this chapter, you will also copy a Timeline view to another application as a quick “project at a glance” image.
In this exercise, you customize the Timeline view and adjust some display details on the Timeline.
Click anywhere in the Timeline view.
Project shifts focus to the Timeline view, and displays the Timeline Tools on the Format tab.
On the Format tab, in the Insert group, click Existing Tasks.
The Add Tasks to Timeline dialog box appears.
This dialog box contains an outline of the summary and subtasks in the project plan.
Check the boxes for the following task names:
Planning Phase
Planning complete!
Internal Launch Phase
Public Launch Phase
Author travel and appearances
These tasks are summary tasks and a milestone task that you will add to the Timeline view.
Click OK.
Project adds the summary tasks and milestone to the Timeline view. If necessary, adjust the horizontal divider bar so you can see more of the Timeline view.
Next you’ll adjust the formatting of the Author travel and appearances summary task on the Timeline.
In the Timeline view, click the bar for the Author travel and appearances summary task.
Only a portion of the summary task name is visible. Hover over the bar name and Project displays a ScreenTip with the task’s full name and other details.
On the Format tab, in the Current Selection group, click Display as Callout.
Project displays this summary task as a callout, which for this task has the advantage of making the full task name visible.
Next you’ll add the final milestone task to the Timeline, but you’ll use a different technique.
In the Task Name column, click the name of task 24, Launch complete!
On the Task tab, in the Properties group, click Add to Timeline.
Tip
You can also right-click the task name and click Add to Timeline in the shortcut menu that appears.
Project adds this milestone task to the Timeline view.
As you can see on the Timeline, Project displays the milestone tasks as callouts and uses the diamond marker that is a visual convention for milestones.


Have you noticed the shading and the vertical lines and horizontal bar on the Timeline view? These are pan and zoom controls you can use to scroll the Gantt Chart view horizontally or to change its timescale.

These pan and zoom controls appear in the Timeline view when the Gantt chart’s timeline shows less than the full project plan’s duration on the screen.
To scroll the Gantt Chart view, click and drag the horizontal bar that appears above a portion of the Timeline. This is a convenient way to display a specific date range in the Gantt Chart view.
To change the timescale in the Gantt Chart view, drag the left or right vertical line on the edge of the scrolling bar in the Timeline view. As you do so, Project adjusts the timescale in the chart portion of the Gantt Chart view so that the time frame that appears in the unshaded portion of the Timeline view is also visible in the Gantt Chart view.
You may find the Timeline view useful not only for creating simplified representations of key details from your project plans, but also for navigating with the Gantt Chart view.
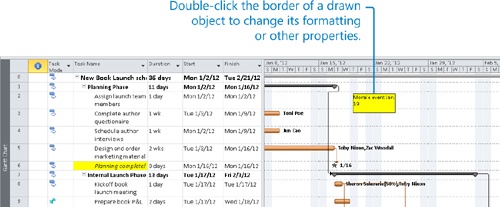
Drawing on a Gantt Chart
Project includes a Drawing tool with which you can draw objects directly on the chart portion of a Gantt chart. For example, if you would like to note a particular event or graphically call out a specific item, you can draw objects, such as text boxes, arrows, and other items, directly on a Gantt chart. You can also link a drawn object to either end of a Gantt bar or to a specific date on the timescale. Here’s how to choose the type of link you need:
Link objects to a Gantt bar when the object is specific to the task that the Gantt bar represents. The object will move with the Gantt bar if the task is rescheduled.
Link objects to a date when the information the object refers to is date-sensitive. The object will remain in the same position relative to the timescale no matter which part of the timescale is displayed.
In this exercise, you add a text box to the Gantt Chart view.
Scroll the Gantt Chart view to the top of the table so task 0 is visible.
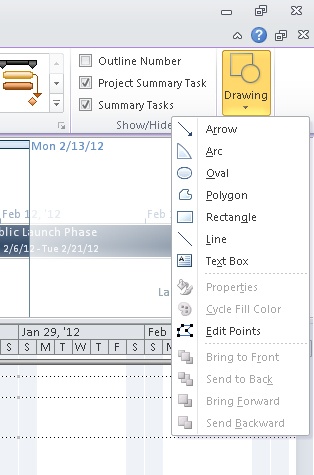
On the Format tab, in the Drawings group, click Drawing.
The menu of drawing objects appears. This includes all the built-in shapes that you can draw, plus other commands for formatting shapes.
Click Text Box, and then drag a small box anywhere on the chart portion of the Gantt Chart view.
In the box that you just drew, type Morale event Jan. 19.
On the Format tab, in the Drawings group, click Drawing, and then click Properties.
The Format Drawing dialog box appears.
Make sure the Line & Fill tab is displayed, and in the Color box under the Fill label, click yellow.
Next, you’ll attach the text box to a specific date on the timescale.
Click the Size & Position tab.
Make sure that Attach To Timescale is selected, and in the Date box, type or click 1/19/12.
In the Vertical box under Attach To Timescale, type .5 (this is the number of inches below the timescale where the top of the box will be positioned), and then click OK to close the Format Drawing dialog box.
Project colors the text box yellow and positions it below the timescale near the date you specified.
Click in an empty area of the Gantt Chart view to unselect the text box.
Because you attached the text box to a specific date on the timescale, it will always appear near this date even if you zoom the timescale in or out or scroll the chart left or right. Had you attached the text box to a Gantt bar, it would move with the Gantt bar if the task were rescheduled.
Copying Views
You may frequently need to share details of your project plans with colleagues who do not have Project, or who may prefer a simple schedule snapshot. In addition to the reports feature described later in this chapter, you can quickly copy or print views from Project. Copied views can then be pasted into e-mail messages, documents, presentations, and other elements.
Both the Gantt Chart and Timeline views are well suited for sharing schedule details—the Timeline is a concise “project at a glance” view and the Gantt Chart is a widely used format of schedules.
In this exercise, you copy the Gantt Chart and the Timeline views to another application.
In the Task Name column, click the name of task 7, Internal Launch Phase.
On the Task tab, in the Editing group, click Scroll to Task.
The Gantt bars for the Internal Launch Phase summary task and its subtasks are displayed. This is close to the image you’d like to copy.
In the Gantt Chart view, select the names of tasks 7 through 14.
These are the Internal Launch Phase summary task and its subtasks.
On the Task tab, in the Clipboard group, click the arrow next to Copy, and then click Copy Picture.
The Copy Picture dialog box appears.
In this dialog box, you can control how Project copies details from the project plan to the Clipboard or saves it to a file. The first two options under Render Image control the size and resolution of the Gantt Chart image you copy; the third allows you to save the copied image as a Graphics Interchange Format (GIF) image file. The Copy and Timescale options let you fine-tune what you want to copy.
For this exercise, you want to copy the selected rows for screen-resolution quality and leave the timescale as shown on the screen.
Click OK.
Project copies a graphic image of the Gantt chart for just the selected rows to the Windows Clipboard.
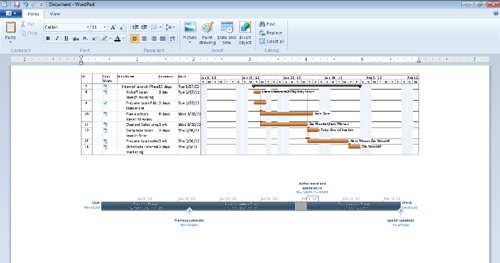
On the Start menu, click All Programs, and in the Accessories program group, click WordPad.
WordPad opens and creates a new document.
In WordPad, click Paste.
WordPad pastes the graphic image of the Gantt Chart view into the new document.
The Gantt Chart view is a standard format for presenting schedules, and it can show quite a bit of schedule detail.
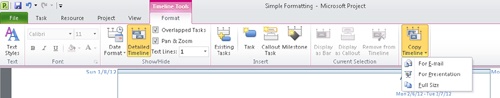
Switch back to Project.
Click anywhere in the Timeline view.
On the Format tab, in the Copy group, click Copy Timeline.
The Copy Timeline options appear.
Click Full Size.
Project copies a graphic image of the timeline to the Clipboard.
Switch back to WordPad and then press the Enter key a few times to add some space below the Gantt chart image.
In WordPad, click Paste.
WordPad pastes the graphic image of the Timeline view into the new document.
Close WordPad without saving the document, return to Project, and then click anywhere in the Gantt Chart view.


Printing Views
Printing views allows you to put on paper just about anything you see on your screen. For a project with many tasks, what you can see on your screen at one time may be a relatively small portion of the full project. When using standard letter-sized paper, it might require several sheets to print the full project plan. For example, a Gantt Chart view of a six-month project with 100 or so tasks can require 12 or more letter-size pages to print in its entirety. Printing out of Project can use quite a bit of paper; in fact, some heavy-duty Project users make poster-size printouts of their project plans using plotters. Whether you use a printer or plotter, it’s a good idea to preview the views you intend to print.
Tip
For advanced instructions on printing views, see Chapter 15.
In this exercise, you will see the Print Preview of the Gantt Chart and Timeline views.
On the File tab, click Print.
The Print Preview appears in the Backstage view with the Gantt Chart in the preview.
The Print Preview has several options to explore. You will start with the page navigation buttons in the lower-right corner of the screen. To observe the broader view of the output, you’ll switch to a multipage view.
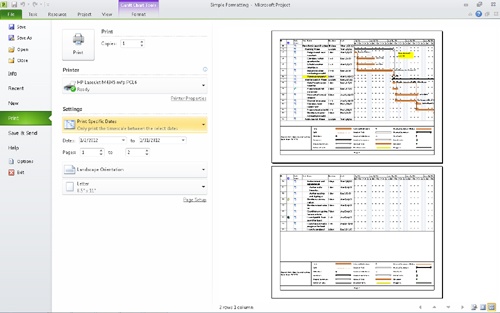
Click Multiple Pages.
The full Gantt chart appears in the Print Preview. Assuming that you have a letter-size sheet as your paper size, you should see the Gantt chart spread across several sheets—what you see in the Print Preview may vary, depending on your specific printer. This is more information than you need to communicate right now, so you’ll adjust the Print Preview to include just the portion of the Gantt chart that covers the month of January.
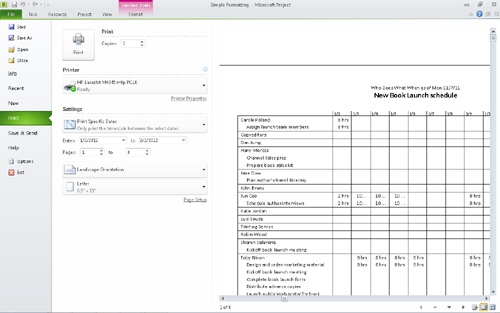
Under Settings, on the left side of the Print Preview window, click Print Entire Project to display additional printing options.
These options let you customize what details will be printed.
Click Print Specific Dates.
Notice the two date fields directly below the Print Specific Dates setting. In the first date field, 1/2/2012 should already be selected. This is the project start date.
In the To date field, select 1/31/2012.
Project adjusts the Print Preview to include just the tasks that appear in the month of January.
Click the Task tab to close the Backstage view.
Next you will work with the Timeline view.
Click anywhere in the Timeline view.
This puts the focus on the Timeline. Project can print only a single view at a time, so when working with a split view, you must specify which view you intend to print.
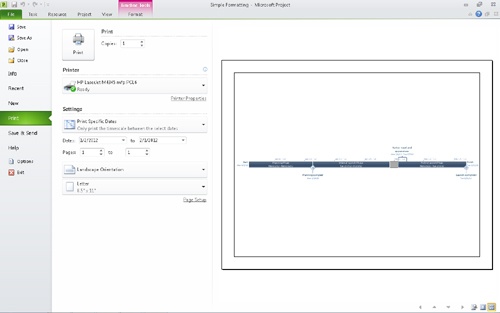
On the File tab, click Print.
The Print Preview appears in the Backstage view.
Click Page Right to display the second page of the Timeline.
Click Multiple Pages.
The entire Timeline view appears in the Print Preview window.
For a simple view like the Timeline, shrinking it to fit on a single page is fine for your communication needs. Next, you’ll adjust the page setup options.
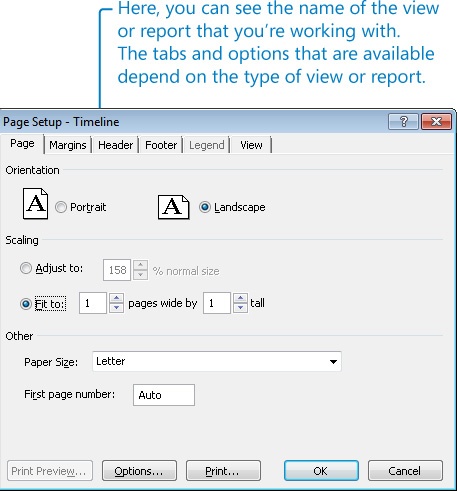
Click Page Setup; this appears at the bottom of the controls, to the left of the print preview.
The Page Setup dialog box appears—note that the dialog box title includes the word “Timeline.” You can customize the page setup options that apply to this particular view.
Make sure the Page tab is visible, and then, under Scaling, click Fit to 1 pages wide by 1 tall.
Click OK.
Project resized the Timeline print preview so it now fits on a single page.


Customizing and Printing Reports
Reports are intended for printing Project data. Unlike views, which you can either print or work with on the screen, reports are designed only for printing or for viewing in the Print Preview window. You do not enter data directly into a report. Project includes several predefined task, resource, and assignment reports that you can edit to obtain the information you want.
You can customize the way you print both views and reports; however, Project has few options for formatting reports. When printing, many of the same options exist for both views and reports, as well as some specific options unique to views or reports.
Tip
For advanced instructions on printing reports, see Chapter 15.
In this exercise, you view reports in the Print Preview window and then edit their formats to include additional information.
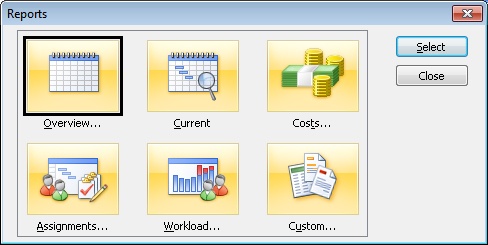
On the Project tab, in the Reports group, click Reports.
The Reports dialog box appears, showing the categories of reports available.
Click Overview, and then click Select.
The Overview Reports dialog box appears, listing the five predefined reports in Project that provide project-wide overview information.
In the Overview Reports dialog box, click Project Summary, and then click Select.
Project displays the print preview of the report in Backstage view.
This report is a handy summary of the project plan’s tasks, resources, costs, and current status. You could use this report, for example, as a recurring status report that you share with the clients or other stakeholders of the project.
Depending on your screen resolution, the text in the report might not be readable when you view a full page.
In the Print Preview window, click the upper half of the page with the mouse pointer.
Project zooms in to show the page at a legible resolution.
At this point in the project life cycle, the most pertinent pieces of information in the report are the planned start and finish dates and the total cost. If any of these values did not fit within the expectations of the project sponsor or other stakeholders, now would be a good time to find out this information.
On the Project tab, in the Reports group, click Reports.
The Print Preview window closes, and the Reports dialog box reappears.
Next, you will preview and edit a different report. For a small, simple project such as the new book launch, a report is a simple way to communicate assignments to the resources involved. To do this, you will work with the Who Does What When report.
Click Assignments, and then click Select.
The Assignment Reports dialog box appears, listing four predefined reports in Project that provide resource assignment information.
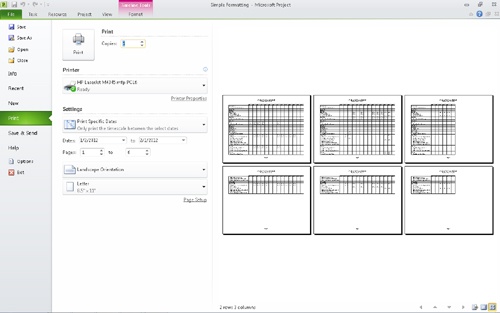
In the Assignment Reports dialog box, click Who Does What When, and then click Select.
Project displays the multiple pages of the Who Does What When report in the Print Preview window.
Click One Page.
The first page of the report appears in the Print Preview window; if it is not legible on your screen, click the upper half of the page with the mouse pointer to zoom in.
To conclude this exercise, you will reformat the project name as it appears in the report title.
Click Page Setup at the bottom of the controls in the print preview.
The Page Setup dialog box appears. This time, it shows the options that you can adjust when working with this report.
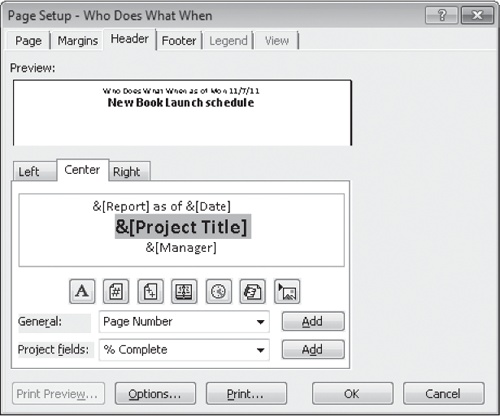
Click the Header tab.
In the upper portion of the tab, you see the preview of the report’s header. Below that, you can see the codes that make up the header text. These codes include the project title and manager name, which are two properties of the project plan you may recall from Chapter 2.
In the Center tab, select the text &[Project Title] and then click Format Text Font.
The Font dialog box appears.
Under Font Style, click Bold, and under Size, click 14. Click OK.
The customized report header appears in the Page Setup dialog box.
Click OK to close the Page Setup dialog box.
The reformatted project name appears in the Print Preview window.
Click the Task tab to return to the Gantt Chart view.
You can change the headers and footers of views in the same way you change them in reports. Keep in mind that changes made to the page setup of any view or report apply only to that view or report. However, the general method used to customize the page setup is the same for any report or view.


Key Points
Presentation styles hide some Gantt chart details that the Scheduling Styles formatting options show.
You can format individual Gantt bars or whole categories of Gantt bars by doing the following: On the Format tab, in the Bar Styles group, click either Bar or Bar Styles.
Customize the Timeline view when you need to show a simplified graphical representation of a project plan.
You can draw or insert graphic objects on the chart portion of a Gantt Chart view but not on the table portion.
Use the Copy Picture feature (accessed by clicking the Task tab in the Clipboard group) to create a graphic image snapshot of the active view and copy it to the Clipboard. For the Timeline view, use the Copy Timeline feature (accessed by clicking the Format tab in the Copy group).
Reports are intended for print-previewing or printing only; you cannot enter or edit data directly in a report.