
Chapter 17. Sharing Project Information with Other Programs
Chapter at a Glance

In this chapter, you will learn how to: | |
✓ | Copy and paste tabular data from Project to another program. |
✓ | Use Project to open a file produced in another program. |
✓ | Save Project data to other file formats using import/export maps. |
✓ | Generate Excel and Visio documents using the Visual Reports feature. |
✓ | See SharePoint and Project Professional task list integration. |
In this chapter, you focus on various ways of getting data into and out of Microsoft Project 2010. In addition to the standard Windows copy and paste features with which you might be familiar, Project offers a variety of options for importing and exporting data.
Throughout this chapter, you’ll see the following terms:
The source program is the program from which you copy information.
The destination program is the program to which you paste information.
Practice Files
Before you can complete the exercises in this chapter, you need to copy the book’s practice files to your computer. A complete list of practice files is provided in Using the Practice Files at the beginning of this book. For each exercise that has a practice file, simply browse to where you saved the book’s practice file folder.
Important
If you are running Project Professional, you may need to make a one-time setting change. This helps ensure that the practice files you work with in this chapter do not affect your Project Server data. For more information, see Appendix C.
Copying Project Data to Other Programs
Project supports copying information out of and pasting information into Project. However because Project information is highly structured, there are a few things to note.
When copying data from Project into other applications, you have some options for the results that you get:
You can copy information (such as task names and dates) from a table in Project and paste it as structured tabular data in spreadsheet applications like Microsoft Excel, or as a table in word processor applications that support tables, like Microsoft Word. In most cases, the table’s column headings for the data you copied will also be pasted, and summary/subtask relationships will be indicated by the subtasks being indented.
You can copy text from a table in Project and paste it as tab-delimited text in text editor applications that do not support tables, like WordPad or Notepad.
When pasting information from Project into an e-mail application, you probably will get tabular results if your e-mail application supports the Hypertext Markup Language (HTML) format.
You can create a graphic image snapshot of the active view and paste the image into any application that supports graphic images. You worked with the Copy Picture feature (on the Task tab) in Chapter 5.
Tip
Many Windows programs, such as Word and Excel, have a Paste Special feature. This feature provides you with more options for pasting data from Project into the destination program. For example, you can use the Paste Special feature in Word to paste formatted or unformatted text, a picture, or a Microsoft Project Document Object (an OLE object). You can also choose to paste only the data or paste it with a link to the source data in Project. When pasted with a link, the destination data in Project can be updated whenever the source data is changed.
You also have options when pasting data from other programs into Project:
You can paste text (such as a list of task or resource names) into a table in Project. For example, you can paste a range of cells from Excel or a group of paragraphs from Word into Project. You can paste a series of task names that are organized in a vertical column from Excel or Word into the Task Name column in Project, for instance.
You can paste a graphic image or an OLE object from another program into a graphical portion of a Gantt Chart view. You can also paste a graphic image or an OLE object into a task, resource, or assignment note, and into a form view such as the Task or Resource Form views.
Important
Pasting text as multiple columns into Project requires some planning. First, make sure that the order of the information in the source program matches the order of the columns in the Project table. You can either rearrange the data in the source program to match the column order in the Project table or vice versa. Second, make sure that the columns in the source program support the same types of data—text, numbers, dates, and so on—as do the columns in Project.
In this exercise, you copy tabular data from Project and paste it into Excel and Word.
Note
The following exercise requires Word and Excel. If you do not have access to one or both of these programs, you can experiment with pasting tabular data from Project into other applications. In general, you should get the expected pasting results if your destination application supports the HTML format.
Set Up
Start Project if it’s not already running.
You need the Sharing_Start project plan located in your Chapter17 practice file folder to complete this exercise. Open the Sharing_Start project plan, and then follow these steps.
On the File tab, click Save As.
The Save As dialog box appears.
In the File name box, type Sharing, and then click Save.
To begin, you’ll copy some task names, durations, and start and finish dates from Project to Word.
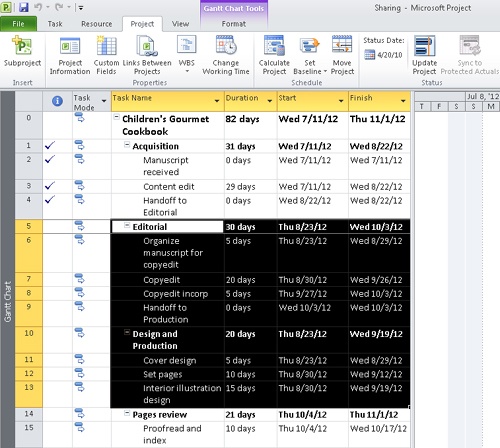
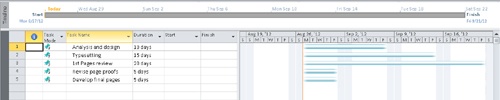
In the Entry table on the left side of the Gantt Chart view, select from the name of task 5, Editorial, through task 13’s finish date, Wed 9/19/12.
On the Task tab, in the Clipboard group, click Copy.
Project copies the selected range to the Clipboard.
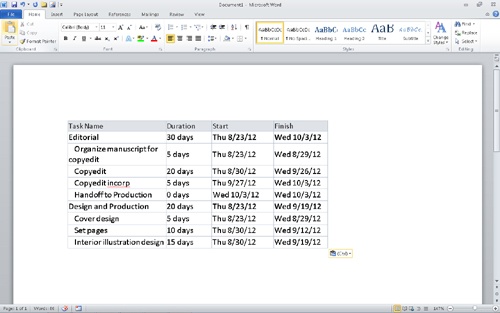
Start Word (or a comparable word processor application), create a new document, and then paste the Clipboard contents into the new document.
If you have Word 2010, your screen should look similar to the following illustration.
Pasting into Word generated a formatted table. The column headings from Project are included in the table, and the summary task and subtask outline structure from Project has been indicated as well.
Next, you’ll paste tabular data from Project into a spreadsheet application.
Start Excel (or a comparable spreadsheet application) and create a new document.
Now you will copy resource cost details from Project to Excel.
Switch back to Project.
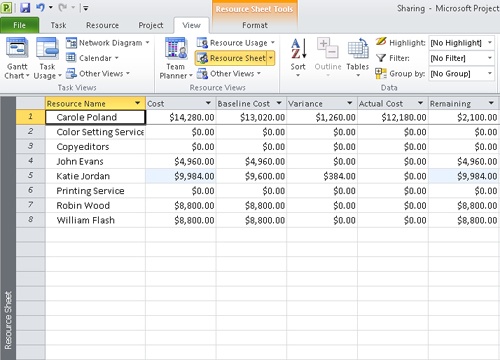
On the View tab, in the Resource Views group, click Resource Sheet.
The Resource Sheet view replaces the Gantt Chart view.
On the View tab, in the Data group, click Tables and then click Cost.
This is the resource cost information you’d like to paste into Excel.
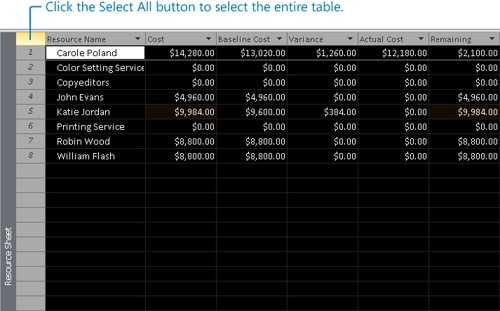
Click the Select All button in the upper-left corner of the Cost table.
Project selects the entire table, although only cells that contain values will be copied.
On the Task tab, in the Clipboard group, click Copy.
Project copies the selected range to the Clipboard.
Switch back to Excel and then paste the Clipboard contents into the new document.
In Excel, if necessary, widen any columns that don’t display the data values and instead display pound signs (##). If you have Excel 2010, your screen should look similar to the following illustration.
As with pasting into Word, note that pasting into Excel generated the correct column headings, and the cell values are the expected data types.
Close Word and Excel, and then switch back to Project.

The pasting of rich tabular data into Word or Excel does not work the same way in all applications. If you were to paste the same data into Notepad, for example, the result would be tab-delimited data and no column headings. Feel free to experiment with this.
Opening Other File Formats in Project
Information that you need to incorporate into a Project plan can come from a variety of sources. A task list from a spreadsheet or resource costs from a database are two examples. You might want to use the unique features of Project to analyze data from another program. For example, many people keep to-do lists and simple task lists in Excel, but accounting for basic scheduling issues, such as distinguishing between working and nonworking time, is impractical in Excel.
When saving data to or opening data from other formats, Project uses maps (also called import/export maps or data maps) that specify the exact data to import or export and how to structure it. You use import/export maps to specify how you want individual fields in the source program’s file to correspond to individual fields in the destination program’s file. After you set up an import/export map, you can use it over and over again.
For this exercise, a colleague has sent you an Excel workbook that contains her recommended tasks, durations, and sequence of activities for some work that Lucerne Publishing may do in the future.
Tip
If you have Excel installed on your computer, open the workbook named Sample Task List in the Chapter17 folder. This is a file you will import into Project. The important things to note about the workbook are the names and order of the columns, and the presence of a header row (the labels at the top of the columns), and that the data is in a worksheet named “Tasks.” When you are finished with the workbook, close it without saving the changes.
In this exercise, you open an Excel workbook in Project and set up an import/export map to control how the Excel data is imported into Project.
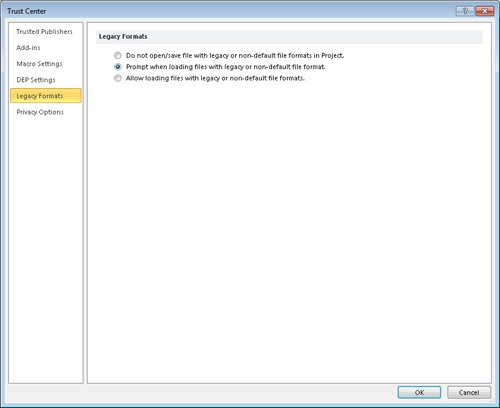
Important
Project 2010 has a security setting that may prevent you from opening files from previous versions of Project, or files in other non-default formats. You’ll change this setting to complete the following activity and then restore it to its original setting.
In Project, on the File tab, click Options.
The Project Options dialog box appears.
Click the Trust Center tab.
Click Trust Center Settings.
The Trust Center dialog box appears.
Click the Legacy Formats tab.
Under Legacy Formats, click Prompt when loading files with legacy or non-default file format.
Click OK to close the Trust Center dialog box, and then click OK again to close the Project Options dialog box.
With this change to Project’s settings completed, you’re ready to import an Excel workbook.
Click the File tab, and then click Open.
Navigate to the Chapter17 practice file folder.
In the file type box (initially labeled Microsoft Project Files), select Excel 97-2003 Workbook.
Select the Sample Task List file, and then click Open.
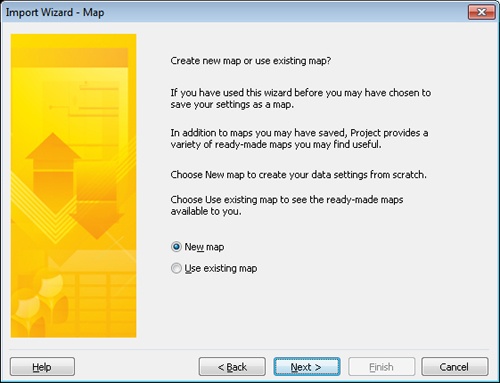
The Import Wizard appears. This wizard helps you import structured data from a different format to Project.
Click Next.
The second page of the Import Wizard appears.
The Import Wizard uses maps to organize the way that structured data from another file format is imported into Project. For this exercise, you will create a new map.
Make sure that New map is selected, and then click Next.
The Import Mode page of the Import Wizard appears.
Make sure that As a new project is selected, and then click Next.
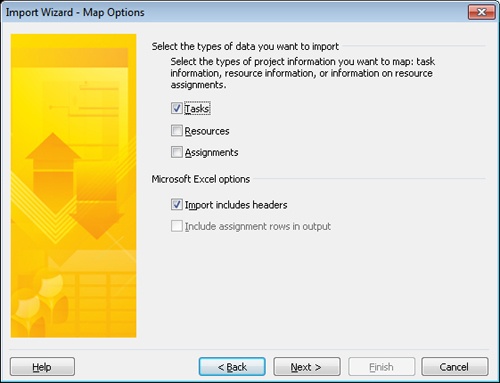
The Map Options page of the Import Wizard appears.
Select the Tasks check box, and make sure that Import includes headers is selected as well.
Headers here refer to column headings.
Click Next.
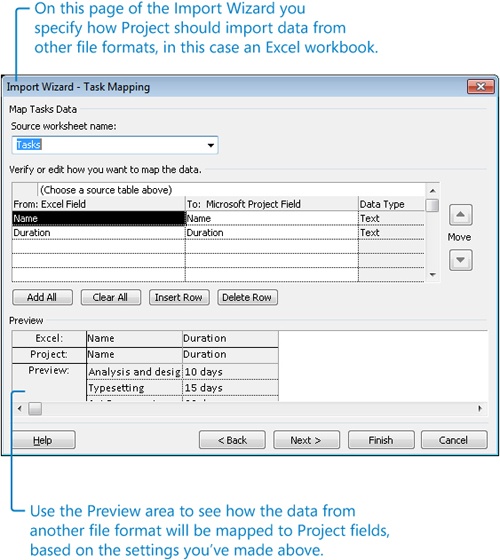
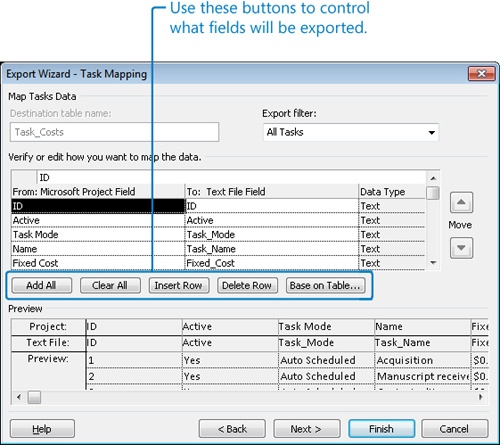
The Task Mapping page of the Import Wizard appears. Here, you identify the source worksheet within the Excel workbook and specify how you want to map the data from the source worksheet to Project fields.
On the Source worksheet name list, select Tasks.
“Tasks” is the name of the sheet in the Excel workbook. Project analyzes the header row names from the worksheet and suggests the Project field names that are probable matches.
Click Next.
The final page of the Import Wizard appears. Here, you have the option of saving the settings for the new import map, which is useful when you anticipate importing similar data into Project in the future. This time, you’ll skip this step.
Click Finish.
A confirmation dialog box appears because Project is now attempting to open a non-default file format.
Project imports the Excel data into a new Project plan. (The dates you see on the timescale will differ from those shown because Project uses the current date as the project start date in the new file.)
Unless you’ve changed the default scheduling setting for new tasks, the task list is manually scheduled.
This is a simple task list with just task names and durations. The process for importing more complex structured data is similar, however.
Close the new file without saving the changes.
The Sharing project plan remains open in Project.
Saving to Other File Formats from Project
Pasting Project data into other programs as you did earlier might be fine for one-time or infrequent needs, but this technique might not work as well if you must export a large volume of data from Project. Instead, you can save Project data in different file formats, which can be accomplished in various ways, including:
You can save the entire project as Extensible Markup Language (XML) format for structured data exchange with other applications that support XML.
You can save only the data you specify in a different format. The supported formats include Excel workbook, Excel PivotTable, and tab-delimited or comma-delimited text. When saving to these formats, you choose the format in which you want to save, pick a built-in export map (or create your own), and export the data.
A financial planner at Lucerne Publishing has requested some project cost data. You’d like to give this data to the financial planner, but the financial planner uses a budget program that cannot work directly with Project files. You decide to provide her with cost data as tab-delimited text, which will allow her the greatest flexibility when importing the data into her budget program.
In this exercise, you save project cost data to a text file using a built-in export map.
On the File tab, click Save As.
The Save As dialog box appears. Project suggests saving the file in the same location from which you opened the practice file.
In the File name box, type Sharing Costs.
In the Save as type box, click Text (Tab delimited) from the list, and then click Save.
A legacy file format confirmation dialog box appears; click Yes.
The Export Wizard appears.
Click Next.
The second page of the Export Wizard appears.
Click Use existing map, and then click Next.
Under Choose a map for your data, select Cost data by task.
On this page of the wizard, you can see your options for the types of data to export, the delimiter between data values (tab, space, or comma), and other options. This time you’ll use the default options.
Click Next.
Here, you can see the detailed field mapping to be applied for this export. You can customize what data to export and how it is organized. For this export, however, you’ll use the default settings.
Click Finish.
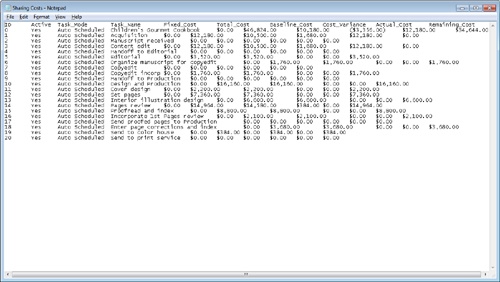
Project saves the text file. To view it, you will open the file in Notepad.
On the Start menu, point to All Programs, click Accessories, and click Notepad.
Notepad starts.
In Notepad, make sure that Word Wrap is turned off. (On the Format menu, Word Wrap should not be selected.)
On the File menu, click Open.
Open the document Sharing Costs in your Chapter17 folder.
In this file, the fields are separated by tabs. It might not be easy for you to read, but this format is imported easily into virtually any data-crunching program.
On the File menu, click Exit. Notepad closes, and you return to Project.
To conclude this exercise, you’ll restore the Trust Center settings.
On the File tab, click Options.
Click the Trust Center tab, and then click Trust Center Settings.
Click the Legacy Formats tab.
Under Legacy Formats, click Do not open/save file with legacy or non-default file formats in Project.
Click OK to close the Trust Center dialog box, and then click OK again to close the Project Options dialog box.


Generating Visual Reports with Excel and Visio
Project 2010 can generate visual reports that focus on sharing schedule details with other applications. Specifically, you can use the Visual Reports feature to export data from Project to either Excel or Microsoft Visio and, once there, visually represent schedule details in compelling formats.
A visual report can include task, resource, or assignment details. When you select a visual report in Project, it generates a highly structured database, called an Online Analytical Processing (OLAP) cube, from your project plan. Project then starts either Excel or Visio (depending on the visual report you selected), loads and organizes the data used by that application, and generates a graphical representation of that data (an Excel chart or a Visio diagram). The specific results you obtain depend on the type of visual report you choose:
Excel visual reports use the PivotTable and PivotChart features in Excel. You can format the chart and modify the details in the PivotTable report from which the chart is derived. PivotTable reports are well suited to analyzing and summarizing the large volumes of data that Project plans can contain. You can create Excel visual reports with Excel 2003 or later.
Visio visual reports use the PivotDiagrams feature in Visio. PivotDiagrams are well suited for presenting hierarchical data and can complement Project very well. Not only can you customize the visual report as a Visio diagram, but you can also filter and rearrange the data from which the diagram is derived. Visio visual reports require Visio 2007 or later.
Project includes several Excel and Visio visual report templates. You can also create your own visual reports from scratch or modify one of the supplied templates. If you are already familiar with Excel PivotTables or you are a Visio power user, and you have the need to analyze and present Project data, you’ll find visual reports of interest. However, if you’re not as experienced with Excel PivotTables or Visio diagrams, you can still look at the Visual Report feature so that you have some exposure to it.
In this exercise, you generate both Excel and Visio visual reports.
Important
If the computer on which you are now working does not have Excel 2003 or later or Visio 2007 or later installed, you cannot complete this exercise. If this is the case, skip to the next section.
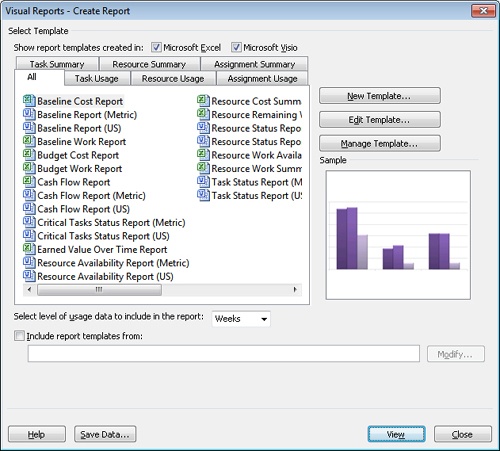
On the Project tab, in the Reports group, click Visual Reports.
The Visual Reports dialog box appears.
This dialog box groups visual reports in a number of ways: all reports; only Excel or Visio reports; and task, resource, or assignment details (divided into summary and usage reports). The dialog box includes a simplified preview of the type of graphic (chart or diagram) associated with each visual report. If desired, you can click the various tabs in the dialog box to see how the visual reports are organized.
The first visual report you’ll generate is Excel-based.
Click the Resource Summary tab.
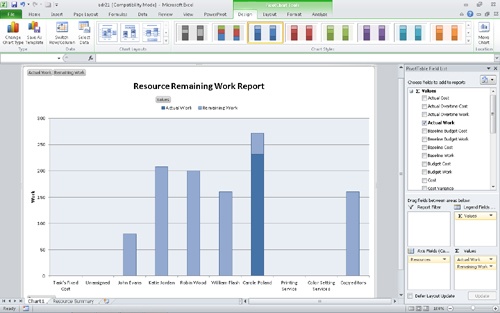
Click Resource Remaining Work Report and then click View.
Project generates the data required by this report, starts Excel, and creates the report. You may need to adjust the zoom level to view the entire chart.
The PivotTable on which the chart is based is on the Resource Summary sheet. If you are familiar with PivotTables, you can view that sheet and modify the PivotTable settings if you wish.
When you are through working with the Excel chart, close Excel without saving the changes.
To conclude this exercise, you will generate a Visio-based visual report.
Important
If the computer on which you are now working does not have Visio 2007 or later installed, you cannot complete this exercise. If this is the case, skip to the next section.
In Project, the Visual Reports dialog box should still be displayed.
Click the Assignment Usage tab.
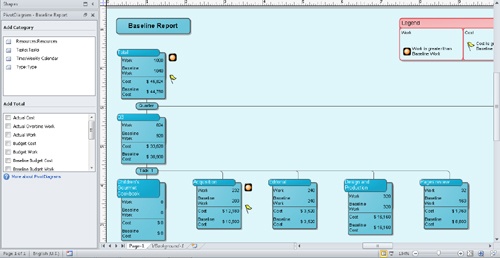
Click Baseline Report (US), and then click View.
Project generates the data required by this report, starts Visio, and creates the Baseline Report diagram.
Next, you’ll take a closer look at the items in this diagram.
Do either of the following:
In Visio 2007, on the View menu, point to Zoom, and then click 100%.
In Visio 2010, in the Zoom slider, set the zoom level to 100%.
If necessary, adjust the vertical and horizontal scroll bars until you can see the diagram details.
At this point, you could adjust the settings in the PivotDiagram pane in Visio to change the details included in the diagram.
When you are through working with the Visio diagram, close Visio without saving the changes.
In Project, click Close to close the Visual Reports dialog box.

Guided Tour: Synchronizing Task Lists Between Project and SharePoint (Project Professional only)
You can store Project 2010 (Standard and Professional) data files in a Microsoft SharePoint 2010 document library. In addition, with Project Professional 2010 you can synchronize tasks between Project and a new type of list in SharePoint called a Project Tasks list. You can either create the initial task list in Project and then synchronize it to the list in SharePoint, or create the initial task list in SharePoint and then create a new project plan based on the task list.
In a Project Tasks list in SharePoint the tasks behave like manually scheduled tasks; you can track progress on a task or add new tasks, but no active scheduling occurs. When the SharePoint task list is synchronized with Project, you can then use scheduling features in Project, such as linking tasks, changing durations, and so on.
For the Project Professional user, you can think of task synchronization with SharePoint as serving two very useful purposes:
You can create an initial task list in SharePoint and invite team members and other stakeholders to add tasks, durations, and other details in SharePoint. You can then synchronize the list with Project and do more scheduling work in Project. Then re-synchronize back to SharePoint so the team can see the results.
You can create an initial task list in Project and then synchronize it with SharePoint. You can then invite team members and other stakeholders to adjust task details as needed. Then re-synchronize back to Project for additional schedule fine-tuning.
In both cases, you use the scheduling engine in Project and the collaborative, multi-user capabilities of SharePoint—the best combination of the strengths of both products.
In this section, you’ll see how one project manager combines Project and SharePoint for collaboration on task lists.
Important
This section does not use practice files or include hands-on activities for you to perform. We do not assume that you have access to both Project Professional and SharePoint as we illustrate them here. Instead, we present an illustrated narrative of how these products can be used together. If you do have access to both Project Professional and SharePoint, feel free to experiment with the kinds of activities illustrated here.
Hany Morcos is a project manager at Lucerne Publishing. Hany uses Project Professional to manage editorial and design work on the various books Lucerne has in its publishing pipeline. Recently, Lucerne has deployed SharePoint, and Hany wants to use the task list synchronizing features to involve her colleagues more directly in schedule development.
Hany has recently been given a basic task list from a colleague and wants to share it within her organization. She’d like her team to adjust the basic task list so it can be used for a new project they may take on. To begin, Hany will synchronize the task list from Project to SharePoint.
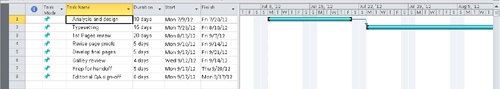
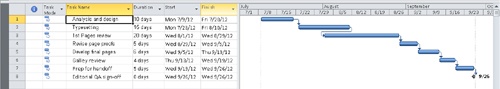
Hany opens the task list in Project.
Hany links the tasks to organize the tasks generally the way she wants them.
This is what she’d like to synchronize with SharePoint and invite her team members to work with.
On the File tab, Hany clicks “Save and Send,” and then clicks “Sync with Tasks List.”
Hany enters the Uniform Resource Locator (URL) of the SharePoint site to which she wants to publish the task list, and then validates it.
Once Project validates the URL, Hany is ready to create the task list. She can either use an existing task list, or create a new one.
Hany enters a new name for the task list, and then clicks Sync.
Project creates the SharePoint task list and then returns to the Gantt Chart view.
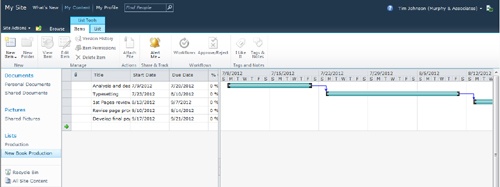
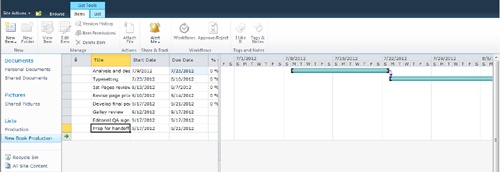
Next, Hany views the new task list in SharePoint.
With the task list now synchronized to SharePoint, Hany can invite her team members to review and modify the task list.
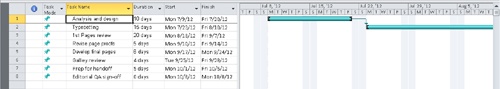
Hany’s team members make changes to the task list, including adding new tasks and changing a due date.
Back in Project, Hany repeats the same synchronization process to refresh her view in Project of the tasks as they now appear in SharePoint.
The latest task list appears in Project.
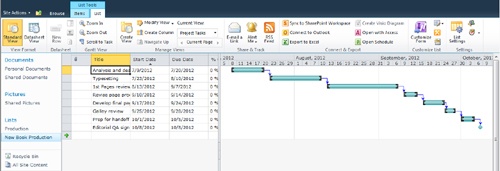
Hany fine-tunes the task list by entering some duration values, linking tasks, and other actions that produce a working schedule.
Finally, Hany again synchronizes the plan to SharePoint so that her team can see the latest details, and they continue to fine-tune the plan.
After additional rounds of fine-tuning the plan and synchronizing between Project and SharePoint, Hany makes schedule adjustments in Project that are not supported by SharePoint, such as setting lead times.


From this point on, Hany will manage this plan in Project.
This section has illustrated just one scenario of Project and SharePoint integration via task list synchronization. Depending on the collaborative practices and tools of your organization, you may find that Project and SharePoint together make a powerful combination.
Key Points
You can both copy from and paste into Project, just as you can with other Windows applications. However, when pasting data into a table in Project, take care to ensure that the data you want ends up in the correct fields.
When opening other data formats in Project, Project uses import maps to help organize the imported data into the right structure for a Project table.
Project supports saving data to common structured data formats, such as XML.
Visual reports help you export Project data to nicely formatted Excel charts and Visio diagrams.
Project Professional users can synchronize task lists with SharePoint.