Chapter 11. Organizing Project Details
Chapter at a Glance
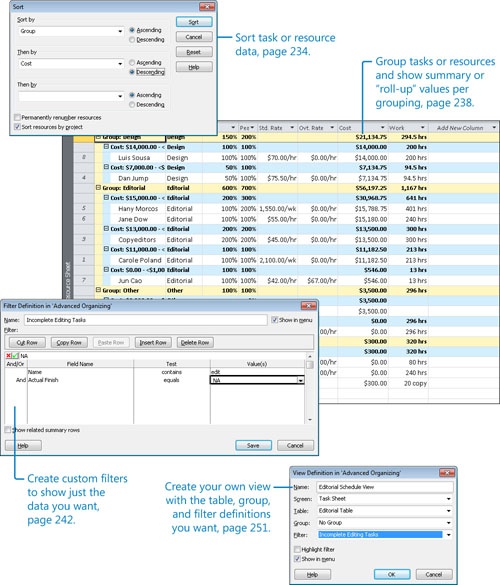
In this chapter, you will learn how to: | |
✓ | Sort task and resource data. |
✓ | Display task and resource data in groups. |
✓ | Filter or highlight task and resource data. |
✓ | Create a custom table. |
✓ | Create a custom view. |
After you’ve built a project plan, chances are you will need to examine specific aspects of the plan for your own analysis or to share with other stakeholders. Although the built-in views, tables, and reports in Microsoft Project 2010 provide many ways to examine a project plan, you might need to organize information to suit your own specific needs.
In this chapter, you use some of the formatting tools in Project to change the way your data appears. Project includes many features that enable you to organize and analyze data that otherwise would require separate tools, such as a spreadsheet application.
Practice Files
Before you can complete the exercises in this chapter, you need to copy the book’s practice files to your computer. A complete list of practice files is provided in Using the Practice Files at the beginning of this book. For each exercise that has a practice file, simply browse to where you saved the book’s practice file folder.
Important
If you are running Project Professional, you may need to make a one-time setting change. This helps ensure that the practice files you work with in this chapter do not affect your Project Server data. For more information, see Appendix C.
Sorting Project Details
Sorting is the simplest way to reorganize task or resource data in Project. You can sort tasks or resources by predefined criteria, or you can create your own sort order with up to three levels of nesting. For example, you can sort resources by resource group (this is the value in the Group field—Design, Editorial, and so on) and then sort by cost within each resource group.
Like grouping and filtering, which you will work with later in this chapter, sorting does not (with one exception) change the underlying data of your project plan; it simply reorders the data you have in the active view. The one exception is the option that Project offers to renumber task or resource IDs after sorting.
When you sort data, the sort order applies to the active view regardless of the specific table currently displayed in the view. For example, if you sort the Gantt Chart view by start date while displaying the Entry table and then switch to the Cost table, you’ll see the tasks sorted by start date in the Cost table. You can also sort in most views that do not include a table, such as the Resource Graph view.
It’s fine to renumber tasks or resources permanently if that’s what you intend to do. For example, when building a resource list, you might enter resource names in the order in which the resources join your project. Later, when the list is complete, you might want to sort them alphabetically by name and permanently renumber them.
In the new book plan at Lucerne Publishing, each resource is assigned to one of several resource groups. These groups have names such as Design, Editorial, and other names that pertain to a book publisher. For your project plans, you might use resource groups to represent functional teams, departments, or whatever most logically describes collections of similar resources.
Sorting all resources by resource group enables you to see the costs associated with each resource group more easily. This can help you plan your project’s budget. You can also sort resources within each group by cost from most to least expensive.
In this exercise, you sort a resource view by cost.
Set Up
Start Project if it’s not already running.
You need the Advanced Organizing_Start project plan located in your Chapter11 practice file folder to complete this exercise. Open the Advanced Organizing_Start project plan, and then follow these steps.
On the File tab, click Save As.
The Save As dialog box appears.
In the File name box, type Advanced Organizing, and then click Save.
On the View tab, in the Resource Views group, click Resource Sheet.
The Resource Sheet view appears. By default, the Entry table appears in the Resource Sheet view; however, the Entry table includes pay rates but does not display the total cost field per resource. You will switch to the Summary table instead.
On the View tab, in the Data group, click Tables and then click Summary.
The Summary table appears.
You are now ready to sort the Resource Sheet view.
Click the AutoFilter arrow in the Cost column heading, and in the menu that appears, click Sort Largest to Smallest.
Tip
If you do not see the AutoFilter arrows in the column headings, try this: on the View tab, in the Data group, in the Filter box, click Display AutoFilter.
The Resource Sheet view is sorted by the Cost column in descending order.
This arrangement is fine for viewing resource costs in the entire project, but perhaps you’d like to see this data organized by resource group. To see this, you’ll apply a two-level sort order.
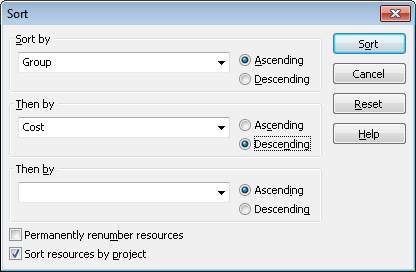
On the View tab, in the Data group, click Sort, and then click Sort By.
The Sort dialog box appears. In it, you can apply up to three nested levels of sort criteria.
Under Sort By, click Group on the drop-down list, and next to that, click Ascending.
Tip
When selecting items from a list like this, you can often begin typing the name of the item you want, and when its full name appears, select it.
Group here refers to the Resource Group field, which, for the new book project, contains values like Design and Editorial; these are the groups with which most of the resources in the project plan are associated. These values were previously added to the project plan for you.
Under Then By (in the center of the dialog box), click Cost on the drop-down list, and next to that, click Descending.
Make sure that the Permanently renumber resources check box is cleared.
Important
The “Permanently renumber resources” (or, when in a task view, the “Permanently renumber tasks”) check box in the Sort dialog box is a Project-level (that is, application) setting; if selected, it permanently renumbers resources or tasks in any Project plan in which you sort. Because you might not want to renumber resources or tasks permanently every time you sort, it’s a good idea to keep this check box cleared.
Click Sort.
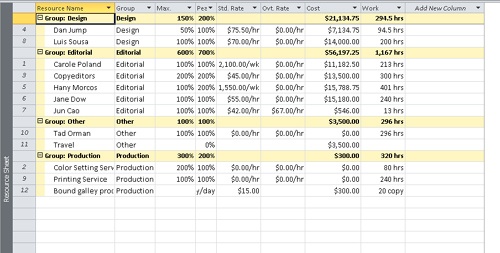
Project sorts the Resource Sheet view to display resources by group (Design, Editorial, and so on) and then by cost within each group.
This sort offers an easy way to identify the most expensive resources in each resource group working on the new book project.
To conclude this exercise, you’ll re-sort the resource information to return it to its original order.
On the View tab, in the Data group, click Sort, and then click by ID.
Project re-sorts the resource list by resource ID.


Reordered ID numbers give you a visual indication that a task or resource view has been sorted. If you see that a sort has been applied but you don’t know which one, you can look in the Sort By dialog box. You cannot save custom sort settings that you have specified as you can with grouping and filtering. However, the sort order that you most recently specified will remain in effect until you re-sort the view.
Grouping Project Details
As you develop a project plan, you can use the views available in Project to view and analyze your data in several ways. One important way to see the data in task and resource views is by grouping. Grouping allows you to organize task or resource information (or, when in a usage view, assignment information) according to criteria you choose. For example, rather than viewing the resource list in the Resource Sheet view sorted by ID, you can view resources sorted by cost. Grouping goes a step beyond just sorting, however. Grouping adds summary values, or “roll-ups,” at intervals that you can customize. For example, you can group resources by their cost, with a $1,000 interval between groups.
Grouping changes the way that you view your task or resource data, allowing for a more refined level of data analysis and presentation. Grouping doesn’t change the underlying structure of your project plan; it simply reorganizes and summarizes the data. As with sorting, when you group data in a view, the grouping applies to all tables that you can display in the view. You can also group the Network Diagram view, which does not contain a table.
Project includes several predefined group definitions for tasks and resources, such as grouping tasks by duration or resources by standard pay rate. You can also customize any of the built-in groups or create your own.
In this exercise, you group resources and create a custom grouping definition.
On the View tab, in the Data group, click the arrow on the Group By: button, and then click Resource Group.
Tip
Since the Group column is visible in the Resource Sheet view, you can also click the AutoFilter arrow in the Group column heading, and in the menu that appears, click Group on this field.
Project reorganizes the resource data into resource groups, adds summary values per group, and presents the data in an expanded outline form.
This grouping is similar to the sorting that you did in the previous section, but this time you will see summary cost values for each resource group.
Project applies light-colored formatting to the summary data rows. Because the summary data is derived from subordinate data, you cannot edit it directly. Displaying these summary values has no effect on the cost or schedule calculations of the project plan.
To give yourself more control over how Project organizes and presents the data, you’ll now create a group.
Before you create a custom group and additional customizations throughout this chapter, however, you’ll make one change to Project’s settings. You’ll make this adjustment to prevent this custom group from becoming available in other project plans that you may work with that are unrelated to this training material.
Click the File tab, and then click Options.
The Project Options dialog box appears.
Click the Advanced tab, and under Display, clear the Automatically add new views, tables, filters, and groups to the global check box.
Click OK to close the Project Options dialog box.
With that housekeeping chore completed, you are ready to create a custom group.
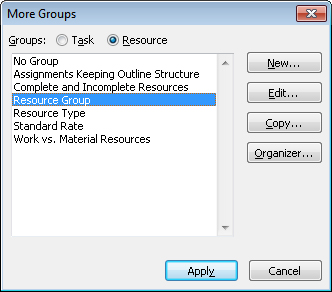
On the View tab, in the Data group, click the arrow on the Group By: button, and then click More Groups.
The More Groups dialog box appears.
In this dialog box, you can see all of the available predefined groups for tasks (when in a task view) and resources (when in a resource view). Your new group will be most similar to the Resource Group, so you’ll start by copying it.
Make sure that Resource Group is selected, and then click Copy.
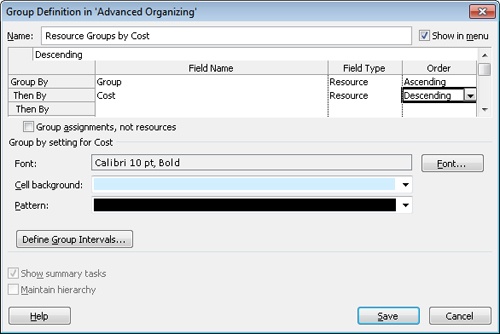
The Group Definition dialog box appears.
In the Name box, select the displayed text, and then type Resource Groups by Cost.
In the Field Name column, click the first empty cell below Group.
Type or select Cost.
In the Order column for the Cost field, select Descending.
The resources will be grouped based on the values in the Group field, and then by the Cost field from highest to lowest.
Next, you’ll fine-tune the cost intervals at which Project will group the resources.
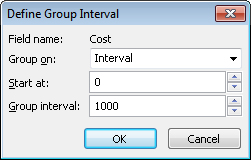
With the Cost row still selected, click Define Group Intervals.
The Define Group Interval dialog box appears.
In the Group on box, select Interval.
In the Group interval box, type 1000.
Click OK.
Click Save to close the Group Definition dialog box.
The new group, Resource Groups by Cost, now appears in the More Groups dialog box.
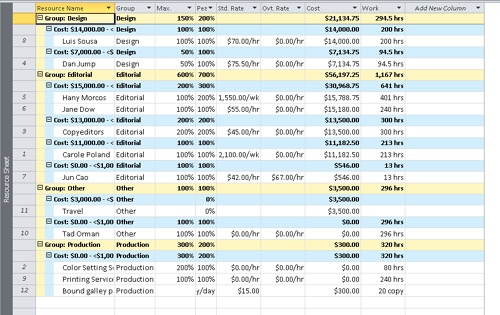
Project applies the new group to the Resource Sheet view.
The resources are grouped by their resource group value (the bands that bind together Design, Editorial, and so on) and within each group by cost values at $1,000 intervals (the light blue bands).
To conclude this exercise, you’ll remove the grouping.
On the View tab, in the Data group, click the arrow on the Group By: button, and click Clear Group.
Project removes the summary values and outline structure, leaving the original data. Again, displaying or removing a group has no effect on the data in the project.
Tip
All predefined groups and any groups you create are available to you through the Group By: button on the View tab. The name of the active group appears in the box next to this button. Click the arrow on the Group By: button to see other group names. If no group is applied to the current table, the words No Group appear on the button.
Filtering Project Details
Another useful way to change the way you view Project task and resource information is by filtering. As the name suggests, filtering hides task or resource data that does not meet the criteria you specify, displaying only the data in which you’re interested. Like grouping, filtering does not change the data in your Project plan; it merely changes the way that data appears.
There are two ways to use filters. You can either apply an AutoFilter or a predefined filter to a view:
Use AutoFilters for ad hoc filtering in any table in Project. Small AutoFilter arrows appear next to the names of column headings. Click the arrow to display a list of criteria by which you can filter the data. Which criteria you see depends on the type of data contained in the column—for example, AutoFilter criteria in a date column include choices such as “Today” and “This month,” as well as a Custom option, with which you can specify your own criteria. You use AutoFilter in Project in the same way you might use AutoFilter in Microsoft Excel.
Apply a predefined or custom filter to view only the task or resource information that meets the criteria of the filter. For example, the Critical Task filter displays only the tasks on the critical path. Some predefined filters, such as the Task Range filter, prompt you to enter specific criteria—for example, a range of task IDs. If a task or resource sheet view has a filter applied, the “Filter Applied” message appears on the status bar. Both types of filters hide rows in task or resource sheet views that do not meet the criteria you specify. You might see gaps in the task or resource ID numbers. The “missing” data is only hidden and not deleted. As with sorting and grouping, when you filter data in a view, the filtering applies to all tables you can display in the view. Views that do not include tables, such as the Calendar and Network Diagram views, also support filtering (through the Filter button on the View tab), but not AutoFilters.
A very similar feature is highlighting. While applying a filter hides information that does not meet your criteria, applying a highlight applies a bright orange format to information that does meet your criteria. Otherwise the two features are nearly identical—you can perform ad hoc highlights or create custom highlights, just as with filters. When a highlight is applied, the message “Highlight Filter Applied” appears on the status bar.
In this exercise, you create a filter that displays only the tasks that include a certain term in their names. Later in the chapter, you’ll combine this filter with a custom table in a custom view.
On the View tab, in the Task Views group, click Gantt Chart.
The Gantt Chart view appears. Before you create a filter, you’ll quickly see the tasks that you’re interested in by applying an AutoFilter.
Click the AutoFilter arrow in the Task Name column heading, point to Filters, and then click Custom.
The Custom AutoFilter dialog box appears. You’d like to see only the tasks that contain the word edit.
Under Name, select contains in the first box.
In the adjacent box, type edit.
Click OK to close the Custom AutoFilter dialog box.
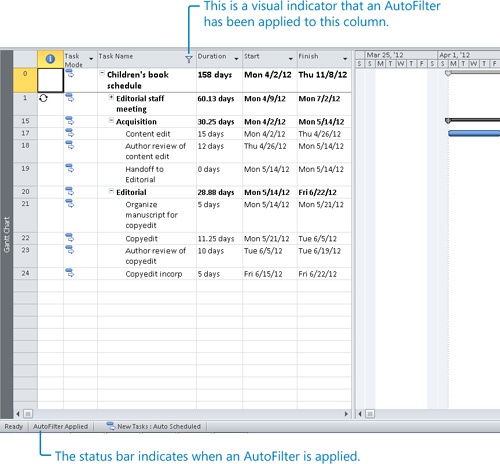
Project filters the task list to show only the tasks that contain the word edit and their summary tasks.
Note that the funnel-shaped filter indicator appears next to the Task Name column label, and the message “AutoFilter Applied” appears on the status bar. These are visual indicators that a custom AutoFilter has been applied to this column.
Tip
When an AutoFilter is applied, you can point to the filter indicator and a summary description of the applied filter appears in a ScreenTip. Pointing to the AutoFilter Applied label on the status bar tells you the fields that have been filtered.
Next, you turn off the AutoFilter and create a custom filter.
Click the funnel-shaped filter indicator in the Task Name column heading, and then click Clear All Filters.
Project toggles the AutoFilter off, redisplaying all tasks in the project plan. Now you are ready to create a custom filter.
On the View tab, in the Data group, click the arrow next to Filter: and then click More Filters.
The More Filters dialog box appears. In this dialog box, you can see all the predefined filters for tasks (when in a task view) and resources (when in a resource view) that are available to you.
Click New.
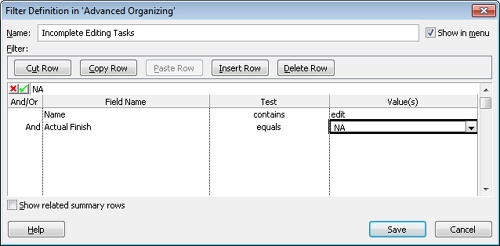
The Filter Definition dialog box appears.
In the Name box, type Incomplete Editing Tasks.
In the first row in the Field Name column, type or select Name.
In the first row in the Test column, select contains.
In the first row in the Value(s) column, type edit.
That covers the first criterion for the filter; next, you’ll add the second criterion.
In the second row in the And/Or column, select And.
In the second row in the Field Name column, type or select Actual Finish.
In the second row in the Test column, select equals.
In the second row in the Value(s) column, type NA.
NA means “not applicable” and is the way that Project marks some fields that do not yet have a value. In other words, any editing task that does not have an actual finish date must be uncompleted.
Click Save to close the Filter Definition dialog box.
The new filter appears in the More Filters dialog box.
In the list of filters, select Incomplete Editing Tasks, and then click Apply.
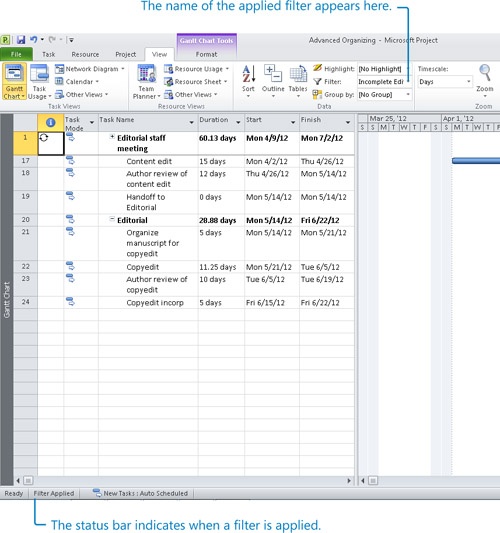
Project applies the new filter to the Gantt Chart view.
The tasks are now filtered to show only the uncompleted editing tasks. Because we haven’t started tracking actual work yet, all the editing tasks are uncompleted at this time.
Tip
When a filter has been applied, you can point to the Filter Applied label on the status bar to see the name of the filter.
To conclude this exercise, you will remove the filtering.
On the View tab, in the Data group, click the arrow next to Filter: and then click Clear Filter.
Project removes the filter. As always, displaying or removing a filter has no effect on the original data.

Customizing Tables
A table is a spreadsheet-like presentation of project data organized into vertical columns and horizontal rows. Each column represents one of the many fields in Project, and each row represents a single task or resource (or, in usage views, an assignment). The intersection of a column and a row can be called a cell (if you’re oriented toward spreadsheets) or a field (if you think in database terms).
Project includes several tables that can be applied in views. You’ve already used some of these tables, such as the Entry and Summary tables. Chances are that most of the time, these tables will contain the fields that you want. However, you can modify any predefined table, or you can create a new table that contains only the data you want.
In this exercise, you create a table to display information about editorial tasks in the new book’s project plan.
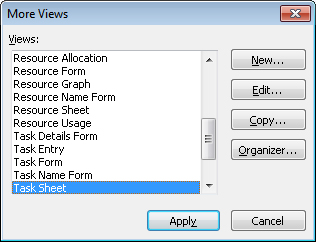
On the View tab, in the Task Views group, click Other Views, and then click Task Sheet.
Project displays the Task Sheet view.
On the View tab, in the Data group, click Tables and then click More Tables.
The More Tables dialog box appears. The Entry table should be selected.
In this dialog box, you can see all the available predefined tables for tasks (when in a task view) or resources (when in a resource view).
Make sure that Entry is selected, and then click Copy.
The Table Definition dialog box appears.
In the Name box, type Editorial Table.
Next, you will remove some fields and then add others.
In the Field Name column, click each of the following field names, and then click the Delete Row button after clicking each field name:
Indicators
Task Mode
Predecessors
Next, you will add a field to this table definition.
In the Field Name column, click Duration, and then click Insert Row.
Project inserts an empty row above Duration.
In the Field Name column, click the arrow in the new row’s empty field name, and then select Editorial Focus (Text9) from the drop-down list.
The customized text field Editorial focus contains some notes about level of edit required per task. This information was previously customized for you in the project plan.
Click OK to close the Table Definition dialog box.
The new table appears in the More Tables dialog box.
Click Apply.
Project applies the new table to the Task Sheet view.


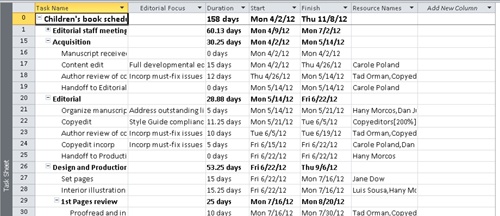
Tip
You can add or remove columns quickly in the current table. To add a column, first select the column to the right of the spot where you want to add a new column. Then, on the Format tab, in the Columns group, click Insert Column. Project displays all fields available for the type of table you have displayed (task or resource); select the one that you want to add. To remove a column, right-click the column heading and click Hide Column.
In the next section, you will combine the custom filter with this custom table to create an editorial schedule view for the new book project.
In this section, you saw a custom field, Text9, that had been customized to say “Editorial focus” and contained details about editing activities in the new book’s project plan. Project supports a wide range of custom fields, and you can add a custom field to any table easily. The rightmost column in a table is labeled “Add New Column,” and you can either click the column heading and select any field you wish to add, or you can just start typing in a cell in the Add New Column column. Project detects the type of data you’re typing and adds the correct custom field type. The custom fields supported by Project include:
Cost (up to 10 cost fields)
Date (up to 10 date fields)
Duration (up to 10 duration fields)
Flag (up to 20 “Yes” or “No” fields)
Number (up to 20 number fields)
Text (up to 30 text fields)
These custom fields are a great way to store additional information about tasks or resources in your project plans. Normally, none of these custom fields have any impact on the scheduling of tasks or resources.
Customizing Views
Nearly all work you perform in Project occurs in a view. A view might contain elements such as tables, groups, and filters. You can combine these with other elements (such as a timescaled grid in a usage view) or with graphic elements (such as the graphic representation of tasks in the chart portion of the Gantt Chart view).
Project includes dozens of views that organize information for specific purposes. You might find that you need to see your project information in some way that is not available in the predefined views. If Project’s available views do not meet your needs, you can edit an existing view or create your own view.
In this exercise, you create a new view that combines the custom filter and custom table that you created in the previous sections.
On the View tab, in the Task Views group, click Other Views, and then click More Views.
The More Views dialog box appears.
In this dialog box, you can see all the predefined views available to you.
Click New.
The Define New View dialog box appears. Most views occupy a single pane, but a view can consist of two separate panes. In fact, the default view in Project is really a two-pane view: the Gantt Chart and the Timeline.
Make sure Single View is selected, and then click OK.
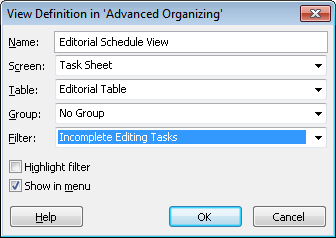
The View Definition dialog box appears.
In the Name box, type Editorial Schedule View.
This is the name that you will see in the Project interface later.
In the Screen box, select Task Sheet from the drop-down list.
The Screen box lists the types of views available.
In the Table box, select Editorial Table from the drop-down list.
Editorial Table is the custom table that you created earlier.
In the Group box, select No Group from the drop-down list.
In the Filter box, select Incomplete Editing Tasks from the drop-down list.
Incomplete Editing Tasks is the custom filter that you created earlier.
Make sure that the Show in menu check box is selected.
Click OK to close the View Definition in dialog box.
The new view appears and should be selected in the More Views dialog box.
Click Apply.
Project applies the new view.
Only uncompleted editorial tasks are now displayed, and the fields are presented in the way that you want them. Also, Project added Editorial Schedule View to the Other Views list in the Task Views group on the View tab. The new view appears under the Custom label, so it is always easily accessible in this project plan.
Because of the housekeeping adjustment that you performed earlier in this chapter, the new custom view is not available in other project plans. However when you create your own custom views, you probably will want them available in any project plan, so we’ll change the display setting back to the default. That way, any custom views that you create in the future will be available in any project plan you work with.
Click the File tab, and then click Options.
The Project Options dialog box appears.
Click the Advanced tab, and under Display, check the Automatically add new views, tables, filters, and groups to the global check box.
Click OK to close the Project Options dialog box.

Key Points
Common ways of organizing data in Project include sorting, grouping, and filtering. In all cases, Project never deletes the data; it simply changes what is displayed and how it appears.
Project includes many built-in sort orders, groupings, and filters, and you can also create your own.
Whereas sorting and filtering rearrange or selectively show only some data in a project plan, grouping adds summary values or “roll-ups” of values, such as costs, based on whatever interval you choose.
Tables are the primary elements of most views in Project. Project includes several built-in tables, and you can also create your own.
You work with data in Project via views. Views may contain tables, groups, filters, and in some cases graphical charts. The Gantt Chart view, for example, consists of a table on the left and a timescaled chart on the right.
Project contains many built-in views, and you can also create your own.
By default, any new views, tables, filters, and groups you create in one project plan are also available in all other project plans you work with in Project. This behavior is controlled by the setting in the Project Options dialog box.