Chapter 15. Applying Advanced Formatting and Printing
Chapter at a Glance

In this chapter, you will learn how to: | |
✓ | Customize a Gantt chart view. |
✓ | Format a Timeline view. |
✓ | Adjust details shown in nodes of a Network Diagram view. |
✓ | Add additional bar types to a Calendar view. |
✓ | Adjust page setup options and generate a PDF or XPS snapshot of views. |
✓ | Change content and appearance of a report. |
This chapter introduces you to some of the more advanced formatting features in Microsoft Project 2010. A well-formatted project plan can be valuable when communicating details to resources, customers, and other stakeholders. Some of the formatting capabilities in Project are similar to those of a style-based word processor, such as Microsoft Word, in which defining a style once affects all content in the document to which that style has been applied. In Project, you can use styles to change the appearance of a specific type of Gantt bar, such as a summary bar, throughout a project plan. Other formatting options introduced in this chapter focus on the different ways of identifying tasks and formatting some of the more commonly used views.
Practice Files
Before you can complete the exercises in this chapter, you need to copy the book’s practice files to your computer. A complete list of practice files is provided in Using the Practice Files at the beginning of this book. For each exercise that has a practice file, simply browse to where you saved the book’s practice file folder.
Important
If you are running Project Professional, you may need to make a one-time setting change. This helps ensure that the practice files you work with in this chapter do not affect your Project Server data. For more information, see Appendix C.
Formatting a Gantt Chart View
You can format specific items (a milestone, for example) directly in a Gantt chart view to change the look of a Gantt Chart view in limited ways. If you completed Chapter 5, you worked with the Gantt Chart Style box. In this section, you will customize specific items, such as Gantt bars and gridlines, in ways that the Gantt Chart styles cannot.
Tip
Remember that several views are Gantt chart views, even though only one view is specifically called the Gantt Chart view. Other Gantt chart views include the Detail Gantt, Leveling Gantt, Multiple Baselines Gantt, and Tracking Gantt. The term Gantt chart view generally refers to a type of presentation that shows Gantt bars organized along a timescale.
In addition to changing the formatting of items that appear by default in a Gantt chart view (such as a task’s Gantt bar), you can add or remove items. For example, it may be useful to compare baseline, interim, and actual plans in a single view. Doing so helps you evaluate the schedule adjustments you have made.
In this exercise, you customize a Gantt chart view.
Set Up
Start Project if it’s not already running.
You need the Advanced Formatting_Start project plan located in your Chapter 15 practice file folder to complete this exercise. Open the Advanced Formatting_Start project plan, and then follow these steps.
On the File tab, click Save As.
The Save As dialog box appears.
In the File name box, type Advanced Formatting, and then click Save.
To begin, you will display the Tracking Gantt view.
On the View tab, in the Task Views group, click the down arrow below the Gantt Chart button, and then click Tracking Gantt.
Project displays the Tracking Gantt view.
Next, you will customize this view. You will add the interim plan bars to the view.
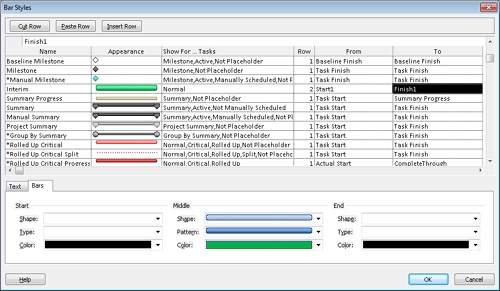
On the Format tab, in the Bar Styles group, click Format and then click Bar Styles.
The Bar Styles dialog box appears. In this dialog box, the formatting changes that you make to a particular type of Gantt bar (a summary task, for example) apply to all such Gantt bars in the Gantt chart.
Scroll down the list of the bar styles, and in the Name column, click Summary Progress.
Click Insert Row.
Project inserts a row for a new bar style in the table. Project draws Gantt bars in the order in which they are listed in the Bar Styles dialog box. Inserting a new bar style above the Summary Progress bar style will help ensure that it won’t be obscured by another type of Gantt bar.
In the new cell in the Name column, type Interim.
Interim is the name you’ll give to the new task bar that will appear on the chart portion of the view.
Tip
The names of most task bars will appear in the legend of printed Gantt chart views. If you do not want a task bar name to appear in the legend, type an asterisk (*) at the beginning of the task bar name. For example, if you wanted to prevent Interim from appearing in the legend, you would enter its name here as *Interim. In the Bar Styles dialog box, you can see that the Manual Milestone task bar name (among others) is prefaced with an asterisk, so it does not appear in the legend of the printed Gantt chart view.
In the same row, click the cell under the Show For. . .Tasks column heading, and then click Normal on the drop-down list.
The Show For . . . Tasks value indicates the type of task the bar will represent (such as a normal task, a summary task, or a milestone) or the status of the task (such as critical or in progress).
Click the cell under the Row column heading, and in the drop-down list, click 2.
This causes Project to display multiple rows of Gantt bars for each task in the view.
Click the cell under the From column heading, and in the drop-down list, click Start1.
Click the cell under the To column heading, and then, in the drop-down list, click Finish1.
The From and To values represent the start and end points for the bar.
The Start1 and Finish1 items are the fields in which the first interim plan values were previously set for you in the project plan. The current start date and finish date of each task in the project were saved to these fields when the interim plan was set. If you completed Chapter 12, you have already been introduced to interim plans.
You have now instructed Project to display the first interim plan’s start and finish dates as bars.
Next, focus your attention on the lower half of the Bar Styles dialog box.
In the Shape box, under the Middle label, click the full-height bar, the second option from the top of the list.
In the Pattern box, under the Middle label, click the solid bar, the second option from the top of the list.
Click the Color box and, under Standard Colors, click green.
Because this customized view focuses on the interim plan, next you’ll format the interim bars to include their start and finish dates.
In the Bar Styles dialog box, click the Text tab.
In the Left box, click Start1 in the drop-down list.
Tip
When selecting items from a list like this, you can often begin typing the name of the item you want, and when its full name appears, select it. For example if you type s, Project shows the values that begin with the letter s. If you then type t, Project shows the values that begin with the letters st.
In the Right box, click Finish1 in the drop-down list.
Selecting these values will cause the Start1 and Finish1 dates to appear on either side of the bar.
Click OK to close the Bar Styles dialog box.
Project displays the interim bars on the Tracking Gantt view. Next, you will add horizontal gridlines to the chart portion of the Gantt Chart view so you can associate Gantt bars with their tasks more easily.
On the Format tab, in the Format group, click Gridlines, and then click Gridlines.
Under Lines to change, leave Gantt Rows selected, and in the Type box under Normal, select the small dashed line (the fourth option), and then click OK.
Project draws dashed lines across the chart portion of the Gantt Chart view.
To conclude this exercise, you will get a better look at the Gantt bars.
On the View tab, in the Zoom group, click the down arrow next to the Timescale box and click Weeks.
In the Task Name column, click the name of task 3, Content edit.
Here you can see that the completed task 3 (shown as a solid blue bar at the top of the task row) corresponds exactly to its interim plan bar (the green bar at the bottom of the task row) and that both were scheduled later than the baseline (the patterned gray bar in the middle of the task row). This occurred because, after the baseline was set, changes to the schedule were made that pushed out the scheduled start date of the task. Then the interim plan was saved.


Project supports several additional Gantt chart formatting features besides those you’ve worked with in this section. If you wish to explore other formatting options, look at these commands on the Format tab:
The Text Styles button in the Format group. For formatting text associated with a specific task type, such as summary task text
The Layout button in the Format group. For formatting link lines and Gantt bar visual effects
Formatting a Timeline View
As you may recall from Chapter 1 and Chapter 5, the Timeline view is a handy way of seeing the “big picture” of the project plan. If you completed Chapter 5, you customized a timeline view and adjusted the visual display of some tasks, such as switching the display of a task from a bar to a callout. You may find that the default text formatting of the Timeline meets your needs, but you’re also able to customize its look.
In this exercise, you format some text and task bar elements in the Timeline view.
On the View tab, in the Split View group, click the Timeline check box.
Project displays the Timeline view.
Click anywhere in the Timeline view.
Putting the focus on the Timeline causes the commands on the Format tab to change. Remember that the Format tab is contextual; it adjusts based on what is currently selected.
First, you will adjust the formatting of an entire category of text values in the Timeline. Some people with whom you’ve shared Timeline snapshots have said the date values are too small, so you’ll make them larger.
On the Format tab, in the Text group, click Text Styles.
The Text Styles dialog box appears. With this dialog box, you can alter the formatting of all occurrences of a specific type of information in the view.
In the Font style box, click Bold, and in the Size box, click 10.
Click OK.
Project applies the text style change to all task dates in the Timeline view.
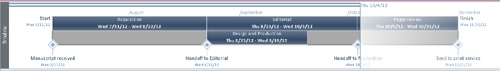
Next, you’d like to visually distinguish the Design and Production task in the Timeline.
In the Timeline view, click the Design and Production task bar.
A colored highlight appears around the task bar, indicating that it is selected.
On the Format tab, in the Font group, click Italic.
Project applies the italic text effect to the task bar’s label (the task name) and its dates.
On the Format tab, in the Font group, click the arrow next to the Background Color button and then, under Standard Colors, click yellow.
Project changes the task bar color to yellow. This makes the white text difficult to read, however. You’ll fix this next.
On the Format tab, in the Font group, click the arrow next to the Font Color button and then click black.
Project changes the task bar’s text to black.
On the View tab, in the Split View group, clear the Timeline check box.
Project hides the Timeline view.


Because the Timeline view is simpler than most other views in Project, it has fewer formatting options.
Formatting a Network Diagram View
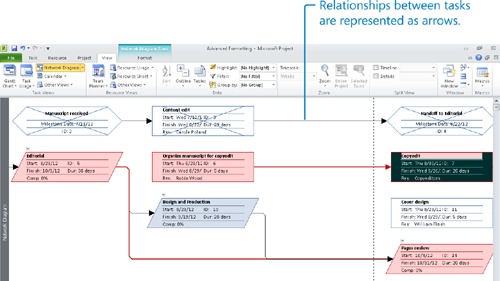
In traditional project management, the Network Diagram is a standard way of representing project activities and their relationships. Tasks are represented as boxes, or nodes, and the relationships between tasks are drawn as lines connecting the nodes. Unlike a Gantt chart, which is a timescaled view, a Network Diagram enables you to view project activities in a manner more closely resembling a flowchart format. This is useful if you’d like to place more focus on the relationships between activities rather than on their durations.
Project provides rich formatting options for the Network Diagram. In this section, you will use only a few of these formatting options to customize the information that appears within nodes. If you’re a heavy-duty Network Diagram user, you’ll want to explore the formatting options in greater detail on your own.
In this exercise, you format items in the Network Diagram view.
In the Task name column, click the name of task 7, Copyedit.
On the View tab, in the Task Views group, click Network Diagram.
The Network Diagram view appears. In this view, each task is represented by a box or node, and each node contains several pieces of information (or fields) about the task.
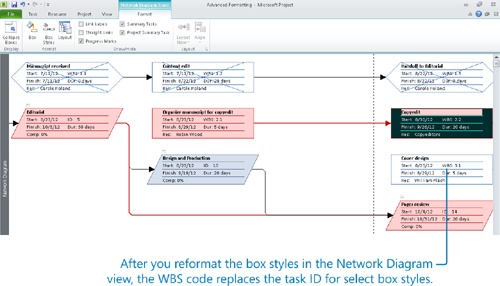
Nodes with an X drawn through them represent completed tasks. Nodes with parallelogram shapes represent summary tasks.
In this exercise, you’d like to replace the task ID values with the Work Breakdown Structure (WBS) codes. Unlike task ID numbers, WBS codes indicate each task’s location in the hierarchy of the project.
On the Format tab, in the Format group, click Box Styles.
Recall that commands on the Format tab change depending on the type of active view; the Format tab is a contextual tab.
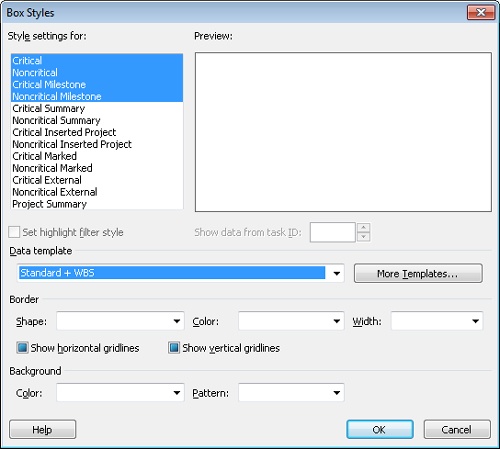
The Box Styles dialog box appears.
On the Style Settings For list, you can see all the node box styles available in Project. The Preview box shows you the specific labels and fields displayed in each box style.
Click More Templates.
The Data Templates dialog box appears. In this context, “Templates” determine what fields appear in boxes (nodes) as well as their layout (not to be confused with file templates).
In the Templates in “Network Diagram” list, make sure that Standard is selected, and then click Copy.
The Data Template Definition dialog box appears. You want to add the Work Breakdown Structure (WBS) code value to the upper-right corner of the node.
In the Template name box, type Standard + WBS.
Below Choose cell(s), click ID. This is the field you will replace.
In the drop-down list of fields, click WBS.
Click OK to close the Data Template Definition dialog box, and then click Close to close the Data Templates dialog box.
In the Box Styles dialog box, under Style settings for, select Critical, and while holding down the Shift key, click Noncritical Milestone.
The four types of subtasks are selected.
In the Data template box, select Standard + WBS from the drop-down list.
Click OK to close the Box Styles dialog box.
Project applies the revised box style to nodes in the Network Diagram.
Now, for these box styles, the WBS value appears in the upper-right corner of each box rather than the Task ID.


Here are some additional things to consider when working in the Network Diagram view:
In the Network Diagram view, you can format all boxes with the Box Styles command on the Format tab, or you can format just the active box with the Box command. This is similar to the Bar Styles and Bar commands available on the Format tab when you have a Gantt chart view displayed.
If you have Microsoft Visio 2007 or later, you can generate a Visio visual report that is similar to a network diagram view. Visio visual reports are pivot diagrams that you can customize. For more information about visual reports, see Chapter 17.
Formatting a Calendar View
The Calendar view is probably the simplest view available in Project; however, even the Calendar view offers several formatting options. This view is especially useful for sharing schedule information with resources or stakeholders who prefer a traditional “month-at-a-glance” format rather than a more detailed view, such as the Gantt Chart view.
In this exercise, you reformat summary and critical tasks in the Calendar view.
On the View tab, in the Task Views group, click Calendar.
The Calendar view appears.
This view displays four weeks at a time, and it draws task bars on the days on which tasks are scheduled. The visible weeks are indicated by the orange blocks in the monthly calendars on the left side of the view.
On the Format tab, in the Format group, click Bar Styles.
The Bar Styles dialog box appears. The additional item type that you would like to show on the Calendar view is a summary bar.
In the Task type box, click Summary.
In the Bar type box, click Line in the drop-down list.
The next item type to reformat is critical tasks.
In the Task type box, click Critical.
Click the Color box, and, under Standard Colors, click red.
Click OK to close the Bar Styles dialog box.
Project applies the format options to the Calendar view.
As with the other views that you’ve customized in this chapter, the Calendar view has additional formatting options available on the Format tab.


Printing Views: Advanced Options
Project offers customization options for printing views beyond what you worked with in Chapter 5. Because views such as the Gantt Chart view are often shared with resources and other project stakeholders, you may find that you need to add additional details to the views you print.
In this exercise, you adjust the page setup and legend of the Gantt Chart view, and specify what table columns to include on the printed view.
On the View tab, in the Task Views group, click the down arrow below the Gantt Chart button and then click Gantt Chart.
The Gantt Chart view appears.
On the View tab, in the Zoom group, click Weeks in the Timescale box.
Project adjusts the zoom setting.
If you completed Chapter 5, you’ve already seen the Gantt Chart view in the Print Preview window in the Backstage view. There, you adjusted some print options, like printing a specific date range and adjusting scaling to fit the printed view on one page. Next, you’ll explore some advanced printing options.
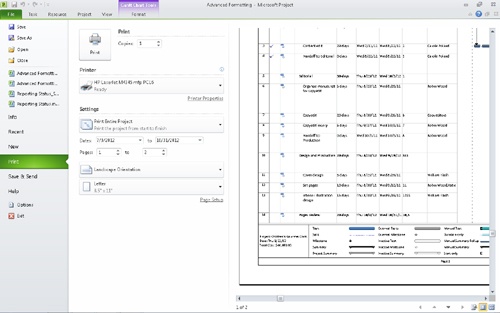
The Print Preview screen appears in the Backstage view with the Gantt Chart in the preview. As currently set up, this view will require four pages to print. Note the “1 of 4” status message below the print preview.
Click Page Setup; this link appears at the bottom of the controls, to the left of the print preview.
The Page Setup dialog box appears.
Make sure the Page tab is visible, and then under Scaling, click Fit to and type or select 1 page wide by 2 tall.
Next, you will customize what appears in the Gantt chart’s legend.
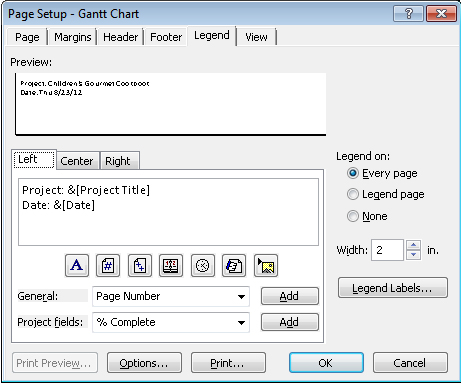
In the Page Setup dialog box, click the Legend tab.
On the Legend tab are three alignment tabs. Click the Left tab.
Here, you can see the text and field codes that appear in the legend.
Project will print the project title and current date on the left side of the legend. You also want to print the project plan’s estimated cost value in the legend.
Click at the end of the second line of text, and then press the Enter key.
Type Total Cost: followed by a space.
In the Project fields box, click Cost from the drop-down list, and then click Add.
Project adds the cost code to the Left legend text.
To conclude the page setup customization, you’ll specify what columns from the table in the Gantt Chart view get printed.
Click Print all sheet columns, and then click OK to close the Page Setup dialog box.
Project applies the changes you specified to the legend. To get a closer look, zoom in on the legend.
In the Print Preview screen, click the lower-left corner of the page with the magnifying-glass pointer.
Project zooms in to show the page at a legible resolution.
Next, you’ll shift focus from output formatting options to output file types. Two common file formats of printed output are Portable Document Format (PDF) and XML Paper Specification (XPS). PDF represents an Adobe Acrobat document. XPS is a format supported by Microsoft. Both formats provide a high-fidelity online representation of what would appear on a printed page. To conclude this exercise, you’ll generate a PDF or XPS output file of the Timeline view.
On the View tab, in the Split View group, click the Timeline check box.
Project displays the Timeline view.
Click anywhere in the Timeline view.
On the File tab, click Save & Send.
This pane of the Backstage view includes options for several ways of sharing or collaborating online.
Under the File Types heading on the left side of the Save & Send tab, click Create PDF/XPS Document.
Some explanation of PDF and XPS documents appears on the right side of the tab.
Click Create PDF/XPS.
The Browse dialog box appears. Use the file name and location given in the dialog box.
In the Save as type box, select either PDF Files or XPS Files (depending on what format you want to see), and then click OK.
The Document Export Options dialog box appears. Use the default settings.
Click OK.
Project generates the PDF or XPS document.
In Windows Explorer, navigate to the Chapter15 folder and double-click the PDF or XPS document that you created.
Note
You may need to install a PDF or XPS viewer to complete this exercise. A free version of Adobe Acrobat Reader is available from www.adobe.com. A free XPS viewer is available from www.microsoft.com.


Printing Reports: Advanced Options
As you may recall from Chapter 5, reports are predefined formats intended for printing Project data. Unlike views, which you can either print or work with onscreen, reports are designed only for printing.
Although reports are distinct from views, some settings that you specify for a view might affect certain reports. For example:
If subtasks are collapsed or hidden under summary tasks in a view, reports that include task lists will show only the summary tasks, not the subtasks.
In usage views, if assignments are collapsed or hidden under tasks or resources, the usage reports (Task Usage or Resource Usage) likewise hide assignment details.
In this exercise, you see a report in the Print Preview screen, and then you edit its definition (that is, the set of elements that make up the report) to change how the report’s information is presented.
On the Project tab, in the Reports group, click Reports.
The Reports dialog box appears, displaying the broad categories of reports available in Project.
Click Current, and then click Select.
The Current Activity Reports dialog box appears.
In the Current Activity Reports box, click Unstarted Tasks, and then click Select.
Project displays the Current Activity report in the Backstage view’s print preview.
This report is a complete list of unstarted tasks and assignment schedule details. You’d like to see this data presented in a different way, so you’ll edit this report.
On the Project tab, in the Reports group, click Reports.
The Backstage view closes, and the Gantt Chart view reappears. Next, you’ll modify this report.
Click Unstarted Tasks, and then click Edit.
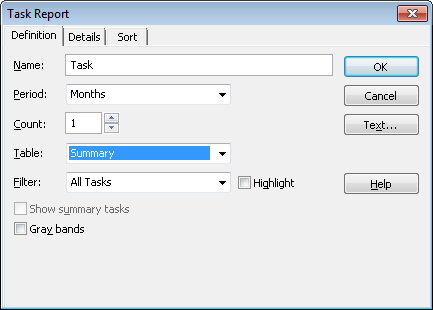
The Task Report dialog box appears.
In the Period box, click Months in the drop-down list.
Choosing Months groups tasks by the month in which they occur. Because the report now includes a time-period element, the Timescale options in the Backstage view become available, enabling you to print data within a specific date range if you want.
In the Table box, click Summary in the drop-down list.
Tip
The tables listed in the Task Report dialog box are the same as those that you can apply to any view that displays tasks in a table. When editing a report format, you can apply predefined or custom tables and filters, choose additional details to include in the report, and apply a sort order to the information—all in the dialog box for the report you’re editing.
Click OK to close the Task Report dialog box.
In the Current Activity Reports dialog box, make sure that Unstarted Tasks is selected and then click Select.
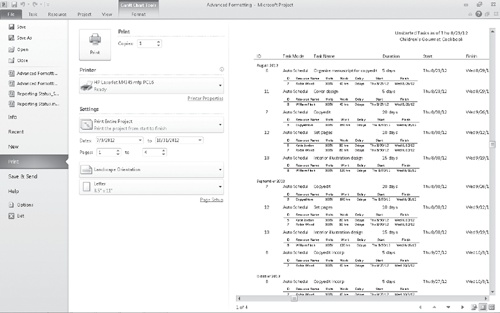
Project applies to the report the custom report settings that you chose, and the report appears in the Print Preview screen of the Backstage view. Next, you will zoom in to see the report in more detail.
In the Print Preview area of the Backstage view, click twice in the upper-left corner of the first page with the magnifying-glass pointer.
This custom report shows the fields displayed in the Summary Task table, but it divides the tasks by month.
Click the Task tab.
The Gantt Chart with Timeline view reappears.


Key Points
Use the Bar Styles dialog box to change the appearance of a specific type of Gantt bar, such as all summary tasks. To display the Bar Styles dialog box, on the Format tab, in the Bar Styles group, click Format and then click Bar Styles.
In the Timeline, you can directly modify text or all text styles, such as all task names, with the commands in the Font and Text groups on the Format tab.
Nodes represent tasks and summary tasks in the Network Diagram view. You can customize the information that appears in a node.
The Calendar view is especially helpful for those who prefer a traditional “month-at-a-glance” format.
You can adjust page layout and legend text for Gantt chart views in the Backstage view.
Report layouts can be customized in the Backstage view.