
CHAPTER 3
Exploring Ecosystems
From Business to Experience Ecosystems
Unpacking an Experience Ecosystem
Using an Ecosystem Map as a Tool
CHAPTER 3 WORKSHOP: Landscape Alignment
Example Pitch to Participants (and Their Managers)
All organizations sit within a complicated system of relationships of people, processes, technologies, regulations, and competitors. At every level, their employees make decisions to chart the best course through these ever-changing variables to support organizational objectives. Around each corner are risks and opportunities. Each choice affects the next; each action opens or closes new possibilities.
Customers, in turn, live within their own world—one in which they are the center, not your organization. Every day, between when they wake up and go to bed, customers navigate complex environments of people, places, and things (both seen and unseen) to meet their needs, chase their desires, and lead their lives. It’s a giant sea of stuff, relationships, and possible futures.
These dynamics help shape each discrete interaction a person has with a product or service. These interactions, in turn, determine the health of the overall customer relationship. Therefore, understanding this greater context—the colliding worlds of an organization and its customers—comes with the territory of orchestrating experiences (see Figure 3.1).

FIGURE 3.1
When they interact, an organization and its customers bring with them complex relationships, influencers, and objectives.
In this chapter, you will learn how to unpack an experience ecosystem to reveal relationships that influence customer needs, expectations, and behaviors today. These insights then can inform how you navigate and influence this ecosystem in the future. Before going too far, let’s start with a refresher on the concept of ecosystems and its common application in business.
From Business to Experience Ecosystems
Your first exposure to the concept of an ecosystem was likely in grade school science. Perhaps it was explained as follows:
The sun shines on the river, causing water evaporation. Clouds form, and rain falls upon the land. Plants absorb the water and nutrients from the soil and then flower. Bees and birds travel from flower to flower, picking up and pollinating other parts of the land. The bees use the pollen to make honey. And so on, and so on.
These simple stories helped us understand that ecosystems, while complex, are made up of many moving parts that can be identified and studied in relation to one another. Changing any of these individual relationships can have a profound effect on the rest of the ecosystem. Raise the temperature of the earth a bit, and you will lose the bees. With no bees, pollen isn’t spread, and then you have a plant problem. These relationships, therefore, are critical to scientific observations and understanding of cause and effect within any given ecosystem.
Business Ecosystems
Over time, these concepts have influenced thinking in business strategy, innovation, and economic theory. In the early 1990s, James F. Moore published “Predators and Prey: A New Ecology of Competition,” transforming companies’ traditional views of competition. Moore argued that
[A] company [should] be viewed not as a member of a single industry but as part of a business ecosystem that crosses a variety of industries. In a business ecosystem, companies coevolve capabilities around a new innovation: they work cooperatively and competitively to support new products, satisfy customer needs, and eventually incorporate the next round of innovations.1
Moore saw business ecosystems as a changing set of relationships based on evolving factors, such as new technologies, regulations, environmental concerns, and other trends. To understand these changing dynamics, ecological frameworks would reveal which ecosystems to participate in, identify opportunities to provide new value to customers, and “[orchestrate] the contributions of a network of players.”2
A good example of this in action is the frenemy relationship between Apple and Samsung. While these two giants compete vigorously in increasingly more product categories, Samsung is also a provider of components to Apple’s computers, phones, and tablets. Similarly, Apple and Google partner and compete (and sue) in multiple ways.
Another example is the Amazon Marketplace (see Figure 3.2). While Amazon is viewed as a disruptive competitor in many retail segments, it actively recruits other retailers to sell directly on Amazon’s platform. This enables Amazon to provide a greater selection of merchandise while keeping its customers in close orbit. This strategy also creates a greater return on investment on core capabilities, such as the technologies, partnerships, and processes behind transacting, shipping, and returning.
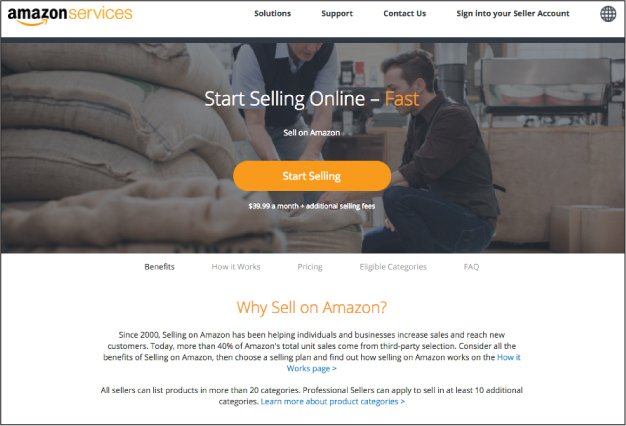
FIGURE 3.2
Amazon Marketplace is built upon the concept of keeping your friends close and your competitors even closer.
Experience Ecosystems
Your organization’s business ecosystem should inform your work, but don’t stop there. You can also codify the seen and unseen relationships that shape customer needs and behaviors. This vantage point—an experience ecosystem—places the customer at the center of the world to help make sense of their context. You then can see more clearly if and how you are a part of that world.
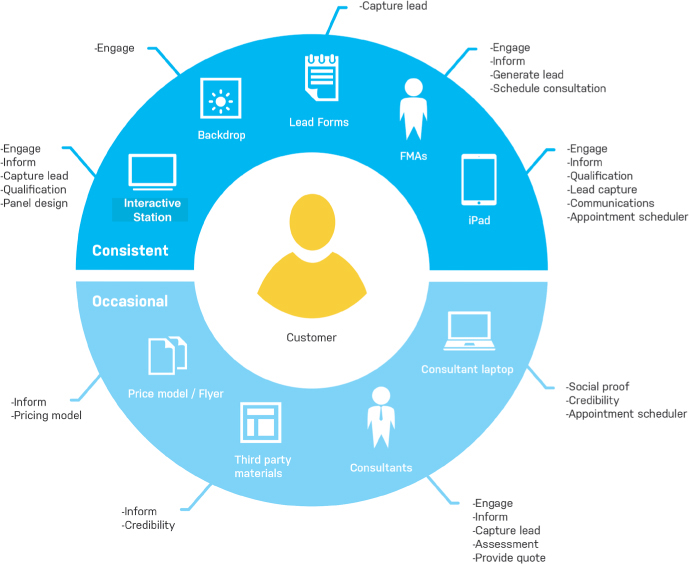
This simple reframing can help challenge inside-out thinking that tends to oversimplify the variables that determine customer needs and behaviors. This understanding can then inform the design of your system of channels and touchpoints from value propositions to discrete interactions. As illustrated in Figure 3.3, reminding stakeholders that their product or service is merely one part of the customer’s life has rhetorical value on its own.
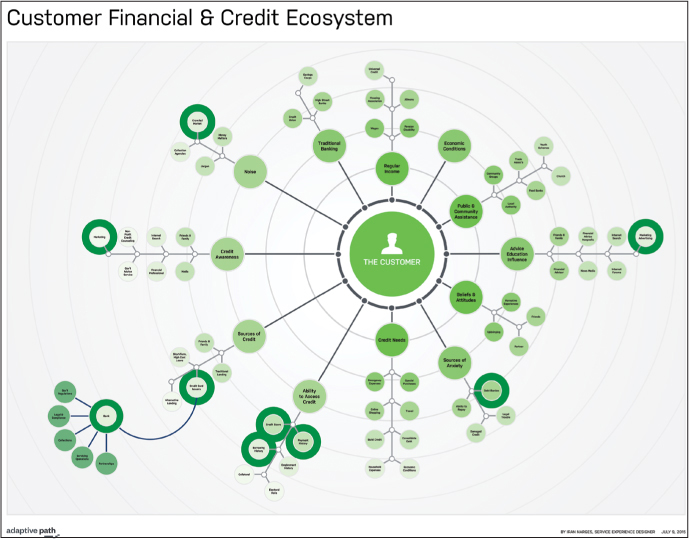
COURTESY OF CAPITAL ONE
FIGURE 3.3
Placing a bank’s products and operations in proper context.
An experience ecosystem complements other models, such as personas and customer journeys, which provide insights into your customers and their experiences. In fact, it’s a best practice to gather qualitative and quantitative data to synthesize into multiple frameworks. The next section covers what entities and relationships you will need to identify in order to understand and document an experience ecosystem.
Unpacking an Experience Ecosystem
Unpacking an ecosystem is not unlike peeling an onion: there are many layers, and at some point in the process, you might start to cry. From our research, we have found varying approaches to breaking down the elements of an ecosystem. The same terms have different or overlapping meanings, depending on the methodology. Based on our experience, the following components can help produce good insights while keeping the focus on the customer:
• Actors
• Roles
• Artifacts
• Factors
• Places
• Interactions
• Relationships
• Boundaries
Actors
Ecosystem actors can come in different shapes and sizes. Most are simply people who participate (or could participate) in your product or service experience. Others are companies or institutions that compete, partner, regulate, or otherwise affect ecosystem dynamics. Overall, actors fall into one of four categories.3
• Customers and external stakeholders: It’s common for organizations to focus myopically on customers (or users) of their products or services without considering the broader group of people who affect customer needs and behaviors. These people can be friends and family, professionals (such as realtors, financial advisors, or life coaches), or others directly or indirectly involved in the experience. Getting your arms around all of these external stakeholders is critical for understanding the human dimensions of an ecosystem.
• Internal stakeholders and agents: Organizations are not people, but they are made of many people. Internal stakeholders include all of the different employees who play one or more roles in and gain value through the delivery of products and services. In a hospital, internal stakeholders might include doctors, nurses, technicians, administrators, marketers, and the board of trustees. Some of these actors interact with customers directly; others may be behind the scenes (see the section, “Current-State Service Blueprints”). Actors in this category may also be third parties, or agents, who act on behalf of your organization. For example, it is common in the cable industry for companies to contract third-party installers and technicians to deliver in-home service. Well-orchestrated experiences tightly integrate these agents to ensure consistency and efficiency.
• Organizations and government: Zooming out a bit, other organizations and institutions vie for your customers, influence product or service requirements, or provide capabilities for you to leverage. These actors include competitors, partners, suppliers, activist groups, government agencies, and other third parties. These relationships can be complex and constantly in flux.
• Products and services: It is useful to also think of individual products and services as unique actors in an ecosystem. For example, Apple may view Samsung as a competitor, but this level of granularity is not very useful if you are looking at the ecosystem around business communication and collaboration. Understanding these companies’ phones, tablets, computers, and other products and services and their relation to the ecosystem provides greater insight.
Roles
It is sometimes helpful to distinguish actors from the roles that they play in an ecosystem. In a couple, one spouse may take on the role of handling paying the bills, while her partner handles the budget and investments. Different actors (a child, nurse, or hospice staff) may play the role of caretaker, each supporting an elderly patient in different ways. Roles (and how actors relate to them) give you a better handle on how other people provide value in an ecosystem. These insights can spark new ideas for supporting, replacing, or augmenting actors through new products, services, or artifacts.
Artifacts
The term artifact often trips people up, sometimes being confused with customer touchpoints. Broadly, artifacts are digital or analog things with varying dynamic or intelligent capabilities. Some of these may be product or service touchpoints; others may exist outside of your product or service, yet impact an actor’s attitudes, expectations, and experiences. Within a healthcare ecosystem, artifacts could include cigarettes, warning labels on cigarette packages, a movie in which the hero constantly smokes, a lung cancer pamphlet, or a lung machine.
Typically, it’s also useful to identify devices. Common devices include computers, laptops, mobile phones, tablets, smart watches, and so on.
Factors
Product and service ecosystems are also affected by various factors that trigger, constrain, or otherwise shape actor behaviors and relationships. Common categories of factors are regulations, technology trends, societal or cultural trends, and environmental changes. Some factors may be traceable back to certain actors, such as a government creating new regulations or laws (e.g., the Affordable Care Act being passed and implemented in the United States). Other factors can reflect macro trends in society. In our healthcare example, a small minority’s concerns over the safety of vaccinations have influenced the behaviors of government, physicians, nurses, and other health officials. Studying current or emergent factors can provide great insight and fuel ideation on how to adapt a product or service in an ever-changing ecosystem.
Places
In many ecosystems, specific places play an important role in where, when, and how actors and artifacts interact. In San Francisco, the 1989 earthquake severely damaged a highway that ran along the bay (see Figure 3.4). Instead of rebuilding the structure, the city demolished the roadway, transforming a place dominated by shipping and cars to a place primed to support tourism, recreation, and local business development.
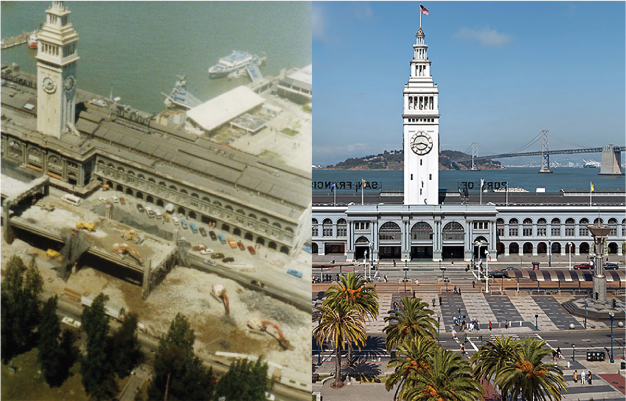
PHOTO (LEFT) BY OCTOFERRET, HTTPS://COMMONS.WIKIMEDIA.ORG/WIKI/FILE:SAN_FRANCISCO-EMBARCADERO_FREEWAY_DEMOLITION.JPG. PHOTO (RIGHT) BY JAGA, HTTPS://EN.WIKIPEDIA.ORG/WIKI/FILE:SAN_FRANCISCO_FERRY_BUILDING_(CROPPED).JPG. LICENSE AT HTTPS://CREATIVECOMMONS.ORG/LICENSES/BY-SA/4.0/
.JPG)
FIGURE 3.4
Same location, two very different places.
In product and service ecosystems, you want to identify the places that customers and other stakeholders live, work, and interact. For example, Richland Library in Columbia, SC, recognized that families from the suburbs congregated on weekends at festivals in the downtown area. To take advantage of this new place, the library staff developed a book trike to create a pop-up experience for festival goers with the goal of signing up new customers (see Figure 3.5).
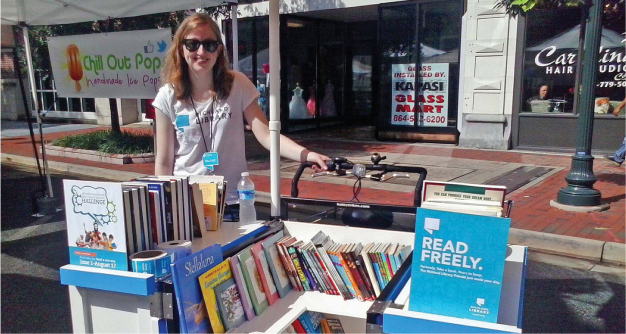
COURTESY OF RICHLAND LIBRARY
FIGURE 3.5
Expanding the library ecosystem into the community.
SHOPPING THE ECOSYSTEM
The retail industry provides many great examples of exploring ways to extend services beyond going to a store, website, or mobile app. For example, HomePlus aspired to be the top grocer in South Korea, but its path to growth seemed to be restricted by competitor EMart’s overwhelming dominance in store locations. So they asked the question: “How can we be number one, without opening any additional stores?”
HomePlus looked closely at the Korean culture and the larger ecosystem in which their stores lived. They discovered how unpleasant a single weekly visit to the supermarket could be in such a dense environment with hard-working, time-starved people. Convenience was going to trump price. In this research, they posed one hypothesis—instead of shoppers going to the store, could the store come to shoppers and blend into shopper’s everyday lives?
In 2011, the retailer opened the world’s first virtual supermarket at Seolleung Station, where shoppers could scan virtual store shelves where backlit display advertising would normally be. These shelves displayed some 500 items of food, toiletries, electronics, and more, for delivery within the same day. The results? An explosion in online membership and sales, making HomePlus South Korea’s number one online supermarket and a close second offline. Many retailers around the world quickly adapted this innovation to their markets (see Figure 3.6).


PHOTO: WELL.CA PRESS RELEASE, HTTPS://WELL.CA/VIRTUALSTORE
FIGURE 3.6
Virtual shopping, such as this example from Well.ca, extends the retail ecosystem.
Interactions
Within any ecosystem, you will see patterns related to how different actors interact with other artifacts, places, and other actors. The nature, frequency, and importance of these interactions can reveal value exchanges that exist outside of your product or service. Understanding these patterns can inform new strategies, including partnerships, acquisitions, and competitive features and functionality.
A simple example of this is Pinterest and the home improvement ecosystem. Launched in 2010, Pinterest introduced a simple visual way to collect, organize, and share imagery found on the web. Many people quickly realized that Pinterest’s functionality provided a convenient way to gain inspiration for home improvement projects, such as remodeling a kitchen. Instead of keeping a list of links, cutting photos from magazines, or printing web pages, home improvers could simply add items to Pinterest and get feedback from family members and friends.
These new behaviors and interactions came to the attention of home improvement retailers. Both The Home Depot and Lowe’s Home Improvement actively offered online content, digital tools, in-store classes, and other services to interact with customers during the inspiration and planning stages of their projects. Pinterest represented a new actor in their ecosystem, and both companies eventually adapted to connect with the online service. For its part, Lowe’s has benefited from hundreds of thousands of interactions between its site, Pinterest, and its customers (see Figure 3.7). These interactions enhance the customer experience and provide valuable insights into customer behavior related to project and product inspiration.4

FIGURE 3.7
The Lowe’s Pinterest channel.
Relationships
To model an ecosystem, you must understand the relationships among its entities. Many types of relationships can exist in an experience ecosystem. Table 3.1 lists some common ones.
Relationships change over time. Mapping these relationships helps clarify not only what exists in an ecosystem, but also the dynamics within it. This can help you explore what might happen if you change or introduce something new into the ecosystem. Will there be a ripple effect? Will it be positive or negative?
Recall our example of the Korean grocer, HomePlus. There had not been a strong relationship between the mobile application and the environmental display advertising, but rethinking these two entities and creating a complementary relationship created a new opportunity.
TABLE 3.1 TYPES OF EXPERIENCE ECOSYSTEM RELATIONSHIPS
Competitive |
Competitive relationships may seem obvious, but if you map your ecosystem well, you may find some unexpected indirect competitors. A streaming service may have other streaming services as a competitor, but going out to dinner and a movie competes for the same human needs of entertainment and escape. |
Cooperative |
Cooperative relationships can be easy to overlook. Examples include: merchants in a shopping district who want to build traffic to the district, and frenemy relationships, such as Apple and Microsoft. |
Supportive |
Supportive relationships can exist across channels, such as call centers, knowledge bases, and in-store support. A customer’s family, friends, and other people can provide advice and counsel related to decisions big and small. |
Transactional |
Transactional relationships can exist in different forms. Simple transactions can be mediated or made possible by multiple third-parties. Services may depend upon subservices each bringing its own transactional relationship, such as getting financing and insurance when purchasing a car. |
Regulatory |
From healthcare to financial services, as well as new business models (such as car sharing), understanding regulatory relationships can impact the overall experience. |
Complementary |
Complementary relationships exist when different entities combine to create interactions, moments, and value. A smartphone maker depends upon the retailer selling and promoting its goods and review sites to help customers discover, purchase, and use their products. |
Influencers |
Customers come under the influence of other people, media, past experiences, and other entities as they attempt to get things done in their lives. Identifying and designing for these influencers can help ensure that a product or service is well-received and fits into the customer’s greater context. |
Emotional |
People’s experiences result in a set of emotional relationships with people, organizations, and even objects. Understanding the emotional connections people bring with them and create in their experiences provides valuable input interacting with them appropriately and effectively. |
Boundaries
Exploring an ecosystem means also feeling your way through where it begins and ends. In the domain of healthcare, for example, customers must navigate a complex web of providers, policies, and regulations to receive care (see Figure 3.8). You could spend a lifetime understanding any one aspect of the ecosystem. You and your colleagues should discuss how wide and deep your ecosystem exploration will go. This should be an iterative process, as you gain more clarity on what insights provide the most value to the objectives of your project.
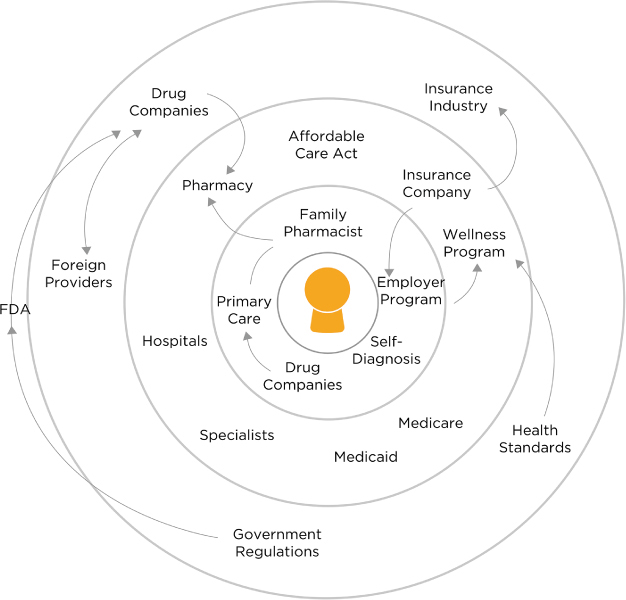
FIGURE 3.8
In complex ecosystems, draw explicit boundaries to guide your exploration.
Ecosystem Mapping Tips
Mapping an ecosystem takes time. The basic process includes identifying what makes up the ecosystem, identifying the relationships, and then modeling the data to communicate effectively to others. Typically, this will be an iterative process, as you analyze, synthesize, and visualize your model
As with touchpoint inventories, you can employ a collaborative workshop to jump-start the ecosystem mapping process. This approach also has the benefit of introducing the concept to colleagues and zooming out from simple product and service interactions to the greater ecosystem they live within. A collaborative workshop example—landscape alignment—is provided at the end of this chapter.
Uncovering the Components
Through interviews, observations, and other design methods, you can uncover different customers’ ecosystems and then find the patterns across them. An effective approach—created by our former colleagues at Adaptive Path—involves facilitating customers through cocreating a model of their personal ecosystem.5 Figure 3.9 shows this approach in action with a remote participant. Returning to our healthcare example, you could work with a patient to identify the people, conditions, resources, institutions, services, and other entities that impact their health and care. The resultant map combined with doing sessions with other patients provides rich data into patterns and relationships, as well as the common mental models.
Additional insights into an individual’s ecosystem will also emerge via other qualitative research techniques. For example, doing one-on-one journey mapping with a customer. See Chapter 5, “Mapping Experiences,” for more on this approach.
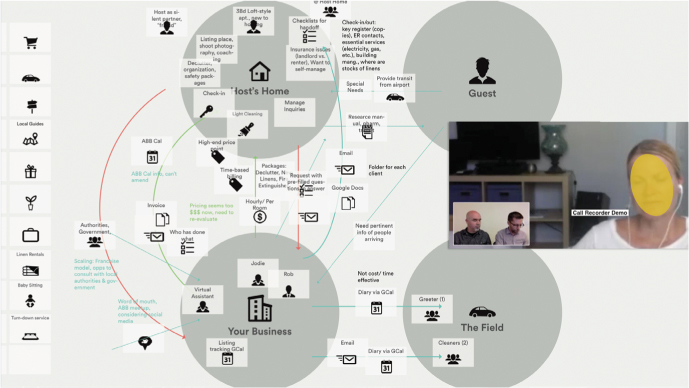
FIGURE 3.9
Remote ecosystem mapping session with a participant.
HYPOTHESIZING THE ECOSYSTEM
I’ll often have project teams build initial hypotheses of both their business and customer ecosystems. This involves small teams using sticky notes to generate components for their ecosystem and then organizing the nodes into categories and relationships. By formally constructing a hypothesis of different customer ecosystems, stakeholders can identify assumptions and gaps in their knowledge of customers’ context and relationships. This analysis then helps inform where to focus new primary research and begins the ideation process regarding what relationships may be ripe for improving or disrupting. The ecosystem models are then revisited after the research is finished.

Modeling an Ecosystem
Playing with different ways to model an ecosystem helps you identify and understand its dynamics. Finding patterns among the ecosystem components you have discovered creates an opportunity to collaborate with others. A good approach is to write individual components on sticky notes and then manipulate them iteratively, exploring affinities, relationships, and other dimensions (see Figure 3.10). You should also sketch different modeling approaches. This will help you and your colleagues understand the ecosystem better, as well as how best to communicate it visually to others.

COURTESY OF CAPITAL ONE
FIGURE 3.10
Collaboratively getting a sense of an ecosystem’s complexity, relationships, and other dimensions.
Other things to keep in mind as you make sense of and model your ecosystem:
• Putting the customer at the center. As with any system or concept model, there are multiple ways you could represent an ecosystem. A common approach is to put the customer at the center of concentric circles. This type of model emphasizes varying degrees of direct and indirect influence of different entities on the customer. It also literally visualizes a customer-centered approach to look at the experience.
• Playing with the center of gravity. In addition to customer-centric ecosystems, it’s a good exercise to model from different vantage points, or centers of gravity. For example, putting your organization in the middle, you can visualize the ecosystem in which your business lives. Imagine your business at the center of a universe surrounded by all the interconnected and interrelated parts that surround it and affect it. In this view, customers are one of many actors. This approach gives you a way of visualizing your organization’s relationship with other organizations, customers, technological and societal trends, and so on (see Figure 3.11).
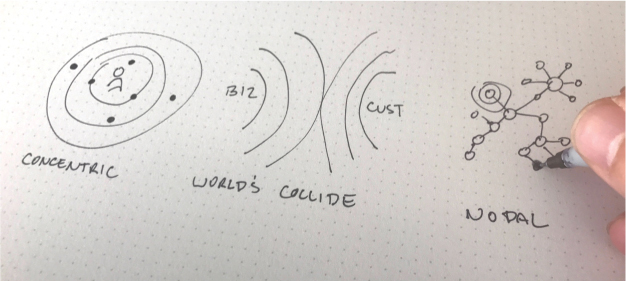
FIGURE 3.11
Exploring different vantage points.
• Level of zoom. Another variable you can play with is the level of zoom from which to view your ecosystem. This helps you explore the boundaries of the ecosystem, as well as what’s useful to communicate and refer to in the design process.
Whether you zoom in or out depends on the scope of what you’re trying to tackle. You may just need to look at a certain area. Figure 3.12 illustrates this approach. This simple ecosystem map, zoomed in very tightly to the inside activities of a specific store-within-a-store, communicates key people, artifacts, and touchpoints—enough detail to get your bearings.
Zooming out and looking at the wider landscape can also be helpful. Service systems are often inherently broad, particularly any that deal with regulations and have many interconnected parts, such as healthcare, financial services, hospitality. But even new technology disruptors may want to zoom out and take a broader view. Newer services like Lyft, Tesla, and Airbnb, must deal with regulations, leveraging existing entities in new ways, and accounting for completely new dependencies. Ultimately, the level of zoom is a judgment call based on your strategic focus.
COURTESY OF ADAPTIVE PATH
FIGURE 3.12
A simple ecosystem map, zoomed in very tightly to the inside activities of a specific store-within-a-store.
Using an Ecosystem Map as a Tool
The activity of exploring an ecosystem can produce valuable insights to inform strategy and design decisions. This new knowledge may end up in other artifacts, such as personas and experience maps. You could stop there, but a well-designed ecosystem map can serve as a tool to support group collaboration when taking a fresh look at a problem space to spark ideas and take action.
In a workshop setting, you can play with ecosystem relationships. What if you removed something from the ecosystem? Added something? What would happen? You explore new ecosystem forces and their impact. What if the U.S. government went to a single payer healthcare system? What happens when self-driving cars are widely approved for use?
Idea Generation Game: Forced Provocation
Another approach is called forced provocation. Forced provocation purposely combines two or more entities, perhaps seemingly unrelated, and explores their potential relationship to generate new ideas and strategies. The HomePlus example of combining display advertising and mobile to create a new shopping experience illustrates this approach in action. This technique can be used early in the design process or as an ideation exercise later when you know what opportunities exist to improve your service.
Other Sensemaking Approaches
Mapping ecosystems is one sensemaking approach to understanding the dynamics of complex environments or relationships and interactions among different actors. Three other models can also help you get your colleagues thinking bigger and broader: stakeholder maps, current-state service blueprints, and service origami. Each of these approaches is valuable on its own, but they are also good entry points into exploring and mapping the entities and relationships of a complex ecosystem.
Stakeholder Maps
Stakeholder maps focus on the actors in a product or service ecosystem. While more focused than full ecosystem maps, these models are useful for visualizing people and organizations that participate in value creation within a specific domain. Mapping stakeholders helps cross-functional teams keep people—rather than processes or technologies—top of mind when framing the product or service landscape.
Stakeholder maps are especially useful when initiating a project. When cocreated, they help facilitate a discussion around what you know about the actors (and the relationships among them) of your problem space (see Figure 3.13). This tangible approach makes it easier to discuss and determine trade-offs of how to engage various internal and external stakeholders.
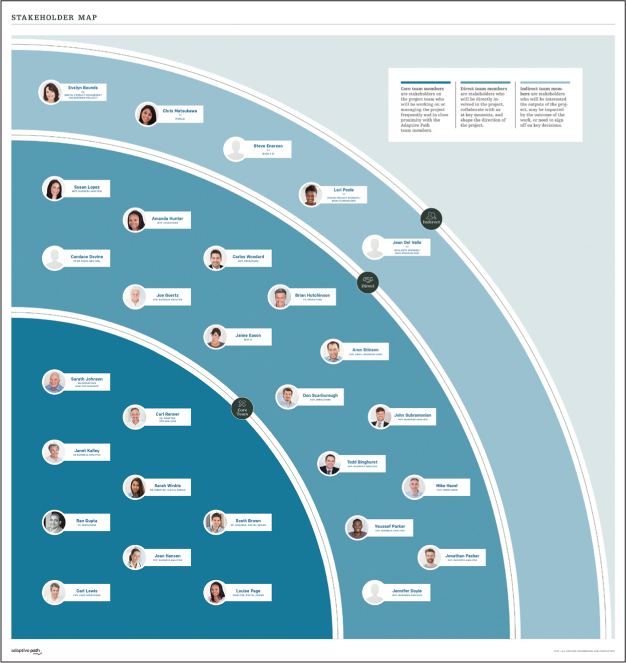
COURTESY OF CAPITAL ONE
FIGURE 3.13
An internal stakeholder ecosystem.
Current-State Service Blueprints
Ecosystem maps can include an analysis of this inside world of the organization, but another method can often be of more use: the service blueprint. Approaches to service blueprinting vary, depending on your level of zoom (system or pathway). In this usage, a blueprint documents a key customer pathway, such as onboarding or resolving an issue, and shows how channels, touchpoints, people, processes, and technologies deliver that experience. Unlike a customer journey, it does not document (but is informed by) the greater context of the customer. The service blueprint framework brings together two worlds rarely seen together in operational documentation—the front stage of customer flow and interactions and the back stage of operational integration (see Figure 3.14). See Chapter 9, “Crafting a Tangible Vision,” for more advanced approaches, including prototyping a operational approaches.
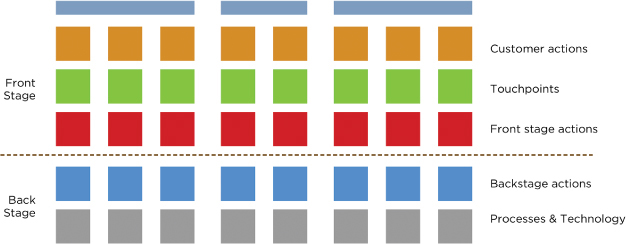
FIGURE 3.14
The basic service blueprint framework.
As a sensemaking method, you can use service blueprinting to deconstruct how your current product or service scenarios work. For example, imagine a retail client that wants to personalize a range of service journeys and make new connections in their ecosystem. To understand the current state, a cross-functional team could map the retailer’s ecosystem, including its services, customers, employees, and so on. Then they might create a current-state blueprint of key customer pathways through that ecosystem. The ecosystem view would reveal the greater landscape of all the services that existed within, while the blueprint would show how different people, processes, and technologies played a role in specific service journeys.
Origami
A few years ago, Centre for Citizen Experience founder Jess McMullin popularized an effective experience modeling technique called business origami.6 Originating in Hitachi’s service design team, this technique employs three-dimensional artifacts (typically a tent-folded card) to model different components of product or service ecosystems. The original intent of the method was to be able to play quickly with different options for designing the connections and flow across channels and touchpoints.
Business origami is very game-like. Participants set up a board (the landscape) and place different actors upon it. As illustrated in Figure 3.15, places, interactions, and value exchanges among actors are then modeled. This technique, for example, could be used to create the proto-journeys described earlier in the chapter. In the context of service design, this method is called service origami.7
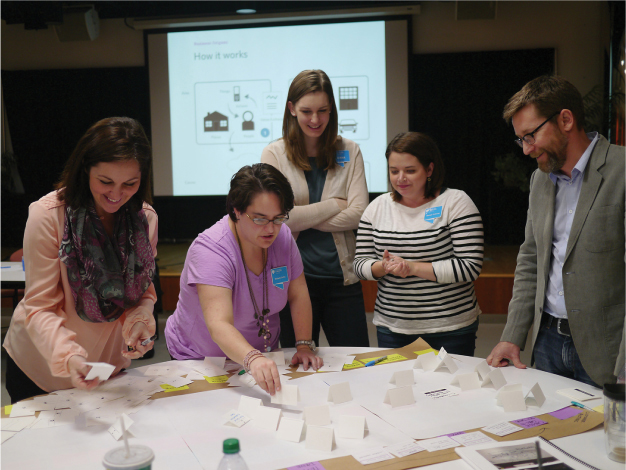
COURTESY OF RICHLAND LIBRARY
FIGURE 3.15
Teaching service origami.
ORIGAMI IN RESEARCH
While primarily used to explore future solutions, Chris and I have adapted it into a co-creation research method. For example, we used origami to better understand third parties within a service’s growing ecosystem. We facilitated several groups of small business owners and their staff through modeling their service delivery. Being able to see the world of their service amazed our participants. We were then able to play with their ecosystem. We added, removed, or resituated actors and artifacts. We modeled new relationships and boundaries. As with many methods in this book, the technique made the current world more understandable and future possibilities more tangible.

CHAPTER 3 WORKSHOP LANDSCAPE ALIGNMENT
Reframing your colleague’s vantage point from vertical ownership to horizontal support is a foundational step in reimagining and orchestrating product and service experiences. Channel frameworks and touchpoint inventories can spark this shift, and an ecosystem view of your problem space can also aid you in this quest. To introduce the concept of ecosystems to your organization, the following workshop approach—landscape alignment—can get the ball rolling.
The key to this approach is taking the two vantage points covered in Chapter 3—business ecosystem and customer ecosystem—and mashing them together figuratively and visually. Through collaborative modeling, people will share their perspectives more easily. You will start to get more alignment on the landscape that your service and your customers inhabit. You can then collectively get to work.
Landscape alignment does not need to be a formal workshop. It’s a good exercise for project teams, especially at the beginning of your initiative.
Workshop Objectives
• Introduce the concept of ecosystems and their value.
• Learn through collaboration how colleagues think about customers’ context and its relation to your product, service, or organization.
• Share perspectives of what sits behind your product and service (operational entities) and forces (competitive, regulatory, and cultural) that can shape your decisions or the expectations/behaviors of customers.
• Identify where you can start to understand your ecosystem better through research and discovery.
Example Pitch to Participants (and Their Managers)
While this workshop requires a small-time commitment, you need to set the table for its value and next steps. Here’s an example for your invite:
In our collective goal of delivering great customer experiences, it’s time to take a step back and take stock of the changing context of our customers and business. We’d like to invite you to a short workshop to share perspectives on the current relationships that shape our ecosystem and identify where we need to understand our solution landscape better.
In this workshop, we will use a simplified ecosystem framework to compare and connect the people, things, relationships, places, and other entities that shape our customers’ behaviors and needs. We will also map the key roles, touchpoints, forces, partnerships, competitors, and other entities that create or impact our offerings. This will spark some enlightening and engaging conversations—and initiate the steps we can take together to make better connections with our customers and their context.
Agenda
This workshop is designed to be completed in 2 hours.
TABLE 3.2 WORKSHOP AGENDA
Activity |
Description |
Duration |
Introductions |
Facilitate participants getting to know one another beyond just names and titles. |
10 min |
Review agenda and objectives |
Share the activities for the day and what you want to accomplish by the end of the session. |
10 min |
Review key concepts |
Cover the basics of ecosystem entities and show examples. |
20 min |
Create maps |
Organize into two cross-functional teams. Have one create a customer-centered map; the other will create an organization-centered map. |
30 min |
Share and analyze |
Share out each map. Work together to identify relationships or opportunities across maps. Identify areas of investigation after the workshop. |
40 min |
Reflect and determine next steps |
Reflect upon the workshop process and outcomes. Determine the next steps. |
10 min |
Roles
• Lead facilitator: Workshop host and main facilitator for session activities
• Co-facilitator(s): Help(s) set up, break down, and assist in activities
• Documentarian: Takes photographs of the session to help nonparticipants understand the collaborative process
Participants
• Product managers
• Marketing
• Business strategists
• Designers
• Researchers
• Business process engineers
• Customer support
• Technologists
Materials
• Self-stick easel pad or butcher paper (to create a wall canvas)
• Sharpies
• Sticky notes
• Camera
Preparing for the Workshop
This workshop requires little preparation. As with other workshops, reserve a space that supports hanging materials on walls or working while circling large tables. Avoid conference rooms designed for sitting and talking.
Before the session, set up your canvases (easel sticky pads or butcher paper) for two teams. If you have more than 14 people, you can divide into four teams.
Running the Workshop
Here is how to facilitate this activity. UberEats (a food delivery service prototyped by bootstrapping to Uber’s existing service architecture and brand) is used as an example to help you visualize the activities.
Review Key Concepts
Following introductions and reviewing the agenda, spend 15–20 minutes educating participants on ecosystems and their entities. Chapter 3 gives you good definitions and examples to use in your presentation, but you should also include examples relevant to your organization. Also, create a simple handout with a list of the entities—actors, places, factors, and so on—for participants to reference during the exercise.
Create Individual Maps
Next, organize participants into two teams (see Figure 3.16).
• Team 1: Will create an ecosystem map with the customer in the center. This focus is on customers’ context and relationships. Your organization, products, and services are a small subset of this ecosystem.
• Team 2: Will focus on the business ecosystem. Customer types are part of this landscape, but most entities are the channels, touchpoints, and people that deliver your product or service, and the competitors, partners, and forces that shape your strategies and tactics.

FIGURE 3.16
Two teams mapping the ecosystem from two vantage points—customer and business.
Once you are organized, give everyone a stack of sticky notes and a Sharpie pen. Set a timer for five minutes. Instruct each participant to brainstorm as many entities as possible for their ecosystem—customer or business. They should write down one entity per sticky. In the UberEats example, this could include the following for a customer ecosystem: Door Dash (a competitive service), friends/family, dining-out budgets, favorite dishes, and so on. For the business: the Uber app, drivers, restaurants, menus, locale regulations, neighborhoods, etc.
You should end up with two to three dozen sticky notes per person. Next, instruct each team to share their sticky notes and organize them into categories. Here are the steps:
1. Each person shares their sticky notes and places them on the canvas as they explain the nature of each entity. After the first share-out is completed, subsequent participants add new entities and note the ones that they also identified, which have been shared already.
2. After sharing, the participants should work together to organize their sticky notes into a model. As Figure 3.17 shows, a concentric circle approach works well for this activity, but you can experiment with other models. Be sure to show relationships among entities and their importance to the customer or business.
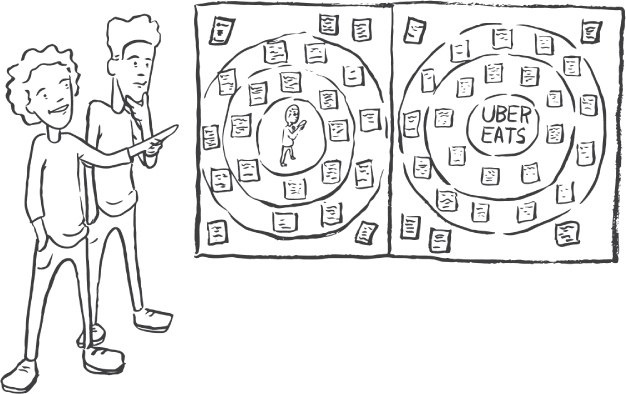
FIGURE 3.17
UberEats’ ecosystem and the potential diner’s ecosystem compared.
Share and Compare
Now it’s time to share and compare. Have each team walk the other team through their map, highlighting entities and relationships that could have important strategy or design implications. Then facilitate a discussion about connections across the two views and what it could mean for your work. Example topics for UberEats might include the following:
• What is part of its service ecosystem and what are its boundaries? For Uber, the Eats service means extending into new relationships with restaurants, abiding by food safety regulations, and competing with the broader ecosystem of dining and food options.
• What do we know about our customers and what influences their choices around food and dining? The core Uber service’s assumption on what riders need doesn’t apply to what someone ordering and receiving food needs.
• Who are we competing with? What is their relationship to the customers we are targeting?
• What potential connections and relationships are ripe for innovation?
• What don’t we need to worry about? What things seem to be in play but are outside of the boundaries useful to our service strategy and design?
• What do we need to learn more about? Do we need to conduct research?
• Do we have everyone involved in our effort who is required in order to improve the service?
• Where do we begin to make change?
During this discussion, you can combine elements of the maps to visualize connections you are seeing. You can also do a long workshop in which you use forced provocation to perform more structured ideation.
After the Workshop
In some cases, the conversation and next steps this workshop generates are enough. However, you may want to create a more polished map for distribution. See the tips and examples in Chapter 3 for inspiration on how to communicate your session’s outputs to others.