
CHAPTER 5
Mapping Experiences
Learning Your Customers’ Stories
Making Sense of What You Learned
CHAPTER 5 WORKSHOP: Experience Mapping
It’s become a standard practice in most organizations to make artifacts that model customer journeys. Approaches to creating and using visual models of customer journeys vary widely, as do their names. In this book, they are referred to as experience maps.
If journeys serve as the hub of empathy for an organization, you must do more than make a map. You need to use the activity of mapping to catalyze change. Your goal should be to create a human-centered mindset and shared ownership of customer experiences in as many of your colleagues as possible.
This chapter will help you facilitate others through an experience mapping process based on the principles of collaboration, codesign, storytelling, and the power of visualization. Let’s look at the experience map artifact and the insights it should communicate.
What’s an Experience Map?
Based on qualitative and quantitative data, an experience map visually articulates the range of behaviors, emotions, mental models, and needs of customers within a conceptual journey framework (such as home buying or travelling). An experience map illuminates customer interactions with your product or service via touchpoints and channels across time and space. A good experience map also reveals the salient elements of the wider ecosystem—other products, services, people, and places—that customers experience as they attempt to meet their explicit goals and implicit drivers. Figure 5.1 shows a basic example of looking beyond touchpoints to the greater landscape as a journey unfolds.
There are meaningful insights across your organization buried in research reports and the tacit knowledge of colleagues. An experience map surfaces and synthesizes this information. For the first time, stakeholders across an organization can see their channel or touchpoints in a broader context. This shared understanding and empathy serve as a foundation for forming and executing upon a singular vision of the customer experience.
Yet, an experience map represents more than a synthesis of insights. Early in the strategy and design process, an experience map identifies new opportunities, generates ideas and concepts, and clarifies the gap between the current state and a desired future state. As Figure 5.2 illustrates, it doesn’t have to be a polished deliverable to provide this value. To get this value, however, you must approach the design of your experience map as a tool, not a deliverable.

COURTESY OF ADAPTIVE PATH
FIGURE 5.1
An experience map showing opportunities to meet visitor needs both inside and outside a museum.

FIGURE 5.2
In this example, a workshop team has used a rough journey map (the sticky notes) to generate ideas (the white pieces of paper on top).
Mapping with Confidence
Experiences have many moving parts to identify and understand. While it takes time and effort to create an experience map, you can proceed with confidence following a few straightforward rules:
• Map with intent.
• Choose your level of zoom.
• Don’t go solo.
• Do your homework.
• Be iterative.
• Build into your process.
Map with Intent
As with any design method, you should employ experience mapping for the right reasons, at the right time, and with the right level of time investment and organizational support. Regardless of the complexities of your organization and the journeys you support, experience mapping makes sense to use in the following circumstances:
• You don’t have a clear understanding of your customer experience across channels and touchpoints and don’t know which customer pain points or opportunities might add value to your organization.
• Different functions—marketing, product, customer insights, operations, and so on—are working in silos, each coming up with its own vision for the customer’s experience. When placed into market, the resulting end-to-end experience is fragmented and inconsistent.
• Business leadership has made the shift to customer journeys, but business strategy approaches are not balanced with an understanding of customer needs and translating those insights into effective designs.
• Strategic initiatives—defining new products and services—lack insight into unmet customer needs in common cultural journeys, such as home ownership, healthcare, parenting, and travel.
• Process design drives the definition and sequencing of customers’ pathways. This process work—such as lean process design and value stream mapping—is divorced from other efforts related to customer experience.
• Your organization needs to evolve from Voice of the Customer to embracing the full complexity of customers’ lives and the stories that play out (for good and bad) every day.
One or more of these factors may apply in your case. Just be clear to yourself and others why it’s the right time to get a shared perspective on your customers’ end-to-end experiences. You will also need to communicate what you will do with the insights and opportunities that the experience mapping process generates. This will prepare you for the inevitable why questions you will get, and tee you up to ask for the time and involvement of others.
Choose Your Level of Zoom
You can apply a journey construct across a spectrum of macro and micro customer narratives. However, different levels of zoom (or conceptual laddering) can provide different insights, so you must choose the level of granularity that you want to learn about and model (see Figure 5.3).

FIGURE 5.3
Choose your level of zoom carefully to support your strategic aims.
Choosing your journey depends on the strategic question(s) you want to answer. For example, a customer experience team for a big-box retailer could look at many different journeys:
• 30,000 feet: You want to expand and diversify your product and service offerings. What types of experiences are your target customers having that could reveal where you are only a small part of their journey?
• 10,000 feet: You want to find better ways to create a seamless experience across channels. How do your customers shop across physical stores, web, mobile, and call centers?
• 5,000 feet: You want to look for innovative ways to connect with millennials. What unmet needs do millennials have when they shop with you?
• 2,500 feet: You want to turn more casual shoppers into loyal customers. Where are the opportunities to build stronger relationships before, during, and after a transaction online or in store?
• 1,000 feet: You get many complaints about your return experience. How do you improve how customers buy online and then return the merchandise in the store?
As you conduct your research, you may find that you need to zoom out more to understand a broader journey. Or you may determine that a greater context (e.g., shopping across channels) is valuable, but your map needs to zoom in on a subset of customers (such as millennials) to provide input into a specific initiative. You should enter the experience mapping process with a strong hypothesis of the journey you want to investigate, while setting expectations that new data may lead you to a more valuable level of zoom.
Don’t Go Solo
Most organizations operate on an internal service model in which departmental specialties—such as customer insights, design, and business analysis—provide capabilities for the business to use, or not use, to further its aims. In some cases, the job of researching and modeling customer journeys is owned by one group or outsourced to third parties. Assigning experience mapping to a select team of people, however, sacrifices long-term impact to short-term efficiencies.
When you involve more of your organization in experience mapping, it has these benefits:
• Builds customer empathy: A customer-centered mindset does not happen through a cursory reading of Voice of the Customer reports or observing focus groups. Experience mapping, as with other human-centered research approaches, creates the opportunity for stakeholders to meet face-to-face with the customers they serve.
• Establishes cross-functional rapport: When bringing together people from different functions, you quickly learn that many of them do not even know one another, or they work together infrequently. Establishing these new relationships bears fruit later in the design process.
• Shifts from vertical to horizontal: Most organizations operate on distributed, vertical ownership. Getting your colleagues out of the weeds to explore the big picture together chips away at these dynamics. Through building customer empathy and coworker rapport, your colleagues will become more open to working across functions toward an end-to-end experience. This buy-in is critical for ensuring that your insights turn into action.
• Creates efficiency: The more collaborative and inclusive you are in your process, the more time you will spend mapping and using your map instead of talking about what you have done and will do.
• Speeds adoption: All of the above will help lead you to where you were headed all along—adoption of your experience map as a tool to work collaboratively toward new solutions.
Getting these benefits depends not just on bringing more people into the process, but rather on selecting the right people. You want to get colleagues who will commit to participating in the full process, as well as people who will benefit from using the map as a tool. Questions that can help guide your decision include:
• Who is responsible for key channels and touchpoints of your product or service ecosystem?
• Which groups would benefit from having a better understanding of the customer journey?
• Which functions might already have information or data so that you don’t have to reinvent the wheel?
• Who will be responsible for making decisions and acting on using the experience map?
As a best practice, here are typical organizational roles you should consider including:
• Executives: Leaders who set strategic objectives, fund product or services, and hold the budget for activities, such as experience mapping, that they expect to bring value to the organization
• Owners: Product managers (or owners) or key business partners responsible for making important or final decisions related to product strategy
• Strategists: People responsible for setting business strategy related to products and services
• Researchers: Specialists responsible for designing or conducting research studies for marketing, products, or other functions
• Data or business analysts: Specialists in gathering and analyzing quantitative data related to product or service touchpoints
• Marketers: Roles responsible for creating awareness and consideration of a product or service
• Process engineers or process designers: Specialists responsible for identifying requirements and designing business processes
• Technologists: Roles related to the architecture, design, and implementation of digital solutions
• Channel owners or practitioners: People responsible for or knowledgeable of various customer channels, including stores, call centers, mobile, and so on
• Front-line staff: Employees or other agents—such as call center staff and service personnel—who interact directly with customers
• Legal: Specialists responsible for ensuring that company activities are lawful and interests are protected
As you spread your net to engage a broader range of stakeholders, you need to clearly define and communicate what level of involvement you are asking from each person. How central a specific stakeholder is to the mapping process depends on his or her level in the organization, their dedication to your mapping initiative, the knowledge they have, or their ability to help you navigate your organization’s processes and procedures.
The various roles include:
• Facilitators: People like you! They know how to design an experience mapping initiative and guide others through it. They get their hands dirty in doing discovery, defining research plans, conducting research, generating insights, and making artifacts.
• Experience Mappers: Stakeholders ready to roll up their sleeves and go out into the field or participate in analyzing and synthesizing the data into maps. In later stages, they also help make the leap from insights to action (see later chapters).
• Subject Matter Experts (SMEs): People who have or can point you to existing wisdom in the organization regarding who your customers are and their current experiences.
• Enablers: Managers, legal, participant recruiters, executive assistants, and others who can help you get the right people together, go into the field, and clear other unforeseen obstacles.
• Influencers: Other like-minded employees of all levels who can support or benefit from your work. These could be teams who have successfully adopted experience mapping or others rooting for you to get a green light to do something similar in their neck of the woods.
• Executive Leadership: High-level executives whom you need to keep abreast of the work and get buy-in for not only conducting the research but also using the map as a strategic tool.
Do Your Homework
In addition to conducting new research, you should be layering in existing insights and data. This discovery will be invaluable for two reasons. First, you always have limited time to conduct primary research. Learning what your organization already knows will help you make proper trade-offs of time and energy. Second, requests for new research typically attract questions of “Don’t we already know this?” like honey attracts flies. Being buttoned up on the knowledge gaps you need to fill will protect you when you are challenged.
Building a Hypothesis
As part of your discovery at the beginning of an initiative, consider hosting an experience mapping hypothesis workshop. In this type of session, a group of stakeholders works together to create one or more maps representing what they believe is the end-to-end customer experience. Figure 5.4 shows the output of this approach. The hypothesis is built upon the information collected from discovery or from the existing knowledge provided by subject matter experts.
Common discovery activities that can help you get a sense of what you know and don’t know include the following:
• Existing qualitative research: Review relevant research from marketing and design, including studies that resulted in useful models, such as personas or decision frameworks.
• Existing quantitative research: Analyze studies related to customer preferences, channel or touchpoint feedback, Voice of the Customer, or other marketing or design studies.
• Touchpoint inventory: See Chapter 2, “Pinning Down Touchpoints,” for how to identify and document your channels and touchpoints.
• Ecosystem mapping: See Chapter 3. “Exploring Ecosystems,” for how to begin mapping your product or service ecosystem. (You may also choose to research and map your ecosystem in your primary research.)
• Channel scorecards: Review metrics related to customer volume, interactions, and satisfaction in different channels.
• Call center data: Look at reports regarding common customer needs, complaints, and issue resolutions.
• Web analytics: Analyze data that shows the volume by touchpoint, movement between touchpoints and channels, where customers enter and exit experiences, and so on.
• Competitive research: Research studies that contain information on competitor touchpoints and channels.

FIGURE 5.4
Multiple hypotheses of what customers’ experiences are in their end-to-end journeys. This exercise helps build the case for primary research and what questions are most critical to answer.
The value of this approach is three-fold. First, a workshop is an efficient way to go through tons of existing information and make sense of what it is telling the team. This helps to inform the research plan with regard to the most critical knowledge gaps. Second, it’s an opportunity to teach the basic concepts of experience mapping. This helps stakeholders buy in to the approach and collaborate more effectively in later activities. Finally, as humans, we can all suffer from confirmation bias—the tendency to map new information to existing mental models or theories. A hypothesis workshop surfaces the biases among the group for everyone to be aware of as new insights come to light.
Iterate
Your discovery efforts will likely begin before you go into the field. In general, strive to work iteratively as you move through various sensemaking activities. An experience map reflects the collection of many disparate pieces of information and ongoing analysis, synthesis, storytelling, visualization, and using your map. Set expectations with your colleagues so that you will continue to refine your understanding and how to communicate that knowledge throughout the mapping process.
Build into Your Process
Selling this collaborative approach to other people depends greatly on their understanding of how it helps to define or design better end-to-end product and service experiences. Make sure that you communicate that what you learn will inform downstream activities, such as opportunity identification, ideation, concept development, vision creation, and roadmap planning. Later chapters will set you up for success in getting the most out of your mapping investment.
Learning Your Customers’ Stories
Mapping your customers’ experiences requires a certain level of research expertise. Since this is not a research book, you may need to turn to other resources that cover the specifics of designing a research plan and protocol, recruiting participants, and how to perform qualitative and quantitative research methods.1 Experience mapping does seek to gain specific insights and has best practices in methods and analysis. To that end, the rest of this section will cover the answers to the following questions:
• What participants should you recruit?
• What are you trying to learn?
• What methods get the best results?
• What about quantitative research?
• How do you involve different stakeholders successfully?
What Participants Should You Recruit?
As with any research study, an overarching strategic intent should inform the types of customers that you recruit. Using the retail example from earlier in the chapter, Table 5.1 illustrates different participant approaches based on common mapping objectives.
TABLE 5.1 DETERMINING YOUR PARTICIPANTS
Objective |
Participant Approach |
We want to expand and diversify our product and service offerings. What types of experiences are our target customers having that can reveal where we are only a small part of their journey? |
Recruit a good representation across your existing product or service customer segmentation, with current and prospective customers both represented. |
We want to find better ways to create a seamless experience across channels. How do customers shop across physical stores, web, mobile, and call centers? |
Identify customers who have shopped in multiple channels during the last six months. Participants should reflect the range of demographics, psychographics, geography, loyalty, and other dimensions believed to impact behaviors and needs. Recruit some frequent customers to participate in longitudinal research, such as a diary study. |
We want to look for innovative ways to connect with millennials. What unmet needs do millennials have when they shop with us? |
Recruit current and prospective customers born between 1982 and 2004. Participants should reflect the range of demographics, psychographics, geography, loyalty, and other dimensions known to impact behaviors and needs. |
We want to turn more casual shoppers into loyal, frequent customers. Where are the opportunities to build stronger relationships before, during, and after a transaction online or in store? |
Identify customers who have purchased 1–2 times in the past 12 months either online, in store, or both. |
We get many complaints about our return experience. How do we improve how customers buy online and return in store? |
Recruit customers who have made a purchase online and returned in store in the past 3–6 months. Stores should represent locations with few complaints and many complaints. Product returns should represent different product categories. If you can, observe customers going through the return experience in store and intercept them afterward to probe on their high and low points. |
Your recruiting screener in each case will require different combinations of customer attributes to cover your bases.2 As with any qualitative research study, you won’t need a large sample size to get good results. Three to five participants per segment should get you good insights before diminishing returns kick in.3
WHAT DO YOU MEAN WHEN YOU CAN’T TALK TO CUSTOMERS?
Many organizations make it difficult for their employees to speak directly to their customers (or even forbid it). Instead, research is outsourced, conducted only by a research or insights department, or simply not funded. These practices run counter to making an organization more customer-centric. This book recommends approaches that challenge this business as usual. If your organization does not support this new paradigm, try the following:

• Do some secondary research. There are a growing number of case studies from the design thinking, service design, innovation, and other communities on building empathy directly with customers.
• Meet informally with the gatekeepers of customer research. Share key examples of how design research is critical to organizational success.
• Hold lunch-and-learns to educate peers and create more demand for new research approaches.
• Pitch an experiment. See if you can get partnership on a small study to try out a new way of working.
• Bring in outside experts to support your case. Look for someone who is not only an expert in experience mapping and research, but who is also committed to helping you and your organization build new capabilities (i.e., not outsourcing experience mapping).
What Are You Trying to Learn?
With your strategic intent in mind, experience mapping involves understanding how different customers take different paths in different contexts in relation to your problem space. This entails answering the following questions (which map back to the building blocks outlined earlier):
• What triggered the customer’s journey?
• What were her expectations?
• What actions did she take?
• What did she feel at different points in time?
• What was she thinking at specific moments?
• Which touchpoints did she interact with?
• What people were involved?
• What technologies (screens, devices, etc.) were involved?
• What was the sequence of events?
• What were the key moments?
• What places did actions take place in?
• How much time elapsed within and across the journey?
• What was her lasting impression?
You won’t ask these directly. The answers will emerge simply by customers telling their stories or observing their experiences directly. In addition to understanding each journey taken, you will also learn about each customer’s unique needs, goals, motivations, and context. You will generate insights into specific pain points and opportunities and find inspiration for what solutions may meet their needs better.
Which Methods Get the Best Results?
The research methods you select or create to uncover your customers’ stories in depth depend greatly upon your context. As with other research studies, the breadth and depth of your customer segments and the type of access you have can push you toward certain approaches. Research protocols for a large, global customer base versus a less diverse, local group of customers will look quite different. And, of course, the constraints of time and money also will play a big role in your options.
Regardless, you should combine multiple methods—both qualitative and quantitative—to support your team learning about your customers’ ecosystems and journeys from different angles. Here is an overview of three common approaches and several methods that can help you get the job done well. Quantitative methods will follow later in the chapter.
Face-to-face Customer Sessions
Sitting down face-to-face (either in person or over video) with your customers is a go-to approach when conducting experience mapping and for good reason. Talking directly with customers has the advantages of building direct empathy, requiring relatively less logistical wrangling, and affording maximum flexibility in the methods you employ during the session. Another plus is that you can create roles for less experienced researchers to add value and participate in the sessions. While not perfect—people’s memories may reflect some past actions, thoughts, and feelings inaccurately—you will still get good results and plenty of bang for your research buck.
How you structure your face-to-face sessions depends partly upon how physically close you can get to your customers and their world. When possible, get as close as you can! Going out into the field to hold in-context sessions is preferable. Lab environments, especially those located at your organization’s building or campus, create barriers for client comfort as well as bias. For this reason, you may also consider using neutral third spaces, such as a coffee shop.
In some cases, remote sessions will be necessary to reach customers when you cannot go to them. Video sessions—using video conference tools, FaceTime, Google hangouts, or similar services—can mitigate not being in the same space. While not ideal, you can use screen sharing to support interactive methods. Table 5.2 provides additional pros and cons related to different research environments.
During face-to-face sessions, the methods you employ should support uncovering the key building block categories: the customer, the journey, the ecosystem, and the context. You also want to make the session enjoyable for your participants so that they feel their time was well spent and you receive open and honest information. Table 5.3 illustrates what a 90-minute session might look like.
TABLE 5.2 RESEARCH ENVIRONMENTS PROS AND CONS
Approach |
Pros |
Cons |
Video |
Low cost Access to wide geography Easy for other stakeholders to observe or participate in sessions |
Requires specific tool and being tech savvy More difficult to build rapport More difficult to use co-creation methods |
In-Person—Lab |
Relatively low cost Easy for other stakeholders to observe or participate in sessions Effective use of co-creation methods |
Limited geographies covered (based on where labs are) Most inconvenient for customer Lab setting creates barriers to creating optimum comfort and rapport |
In-Person—Neutral |
Ability to choose environments that are comfortable and reduce bias Effective use of co-creation methods Can hit a broad geography |
Limitations to stakeholders’ observation and participation Travel costs related to number of locations Can be inconvenient for customer Extra effort related to finding appropriate neutral locations |
In-Person—in Context |
Most convenient for customer Effective use of co-creation methods Ability to observe and more fully understand context Can hit a broad geography |
Travel costs related to number of locations Limitations to stakeholders’ observation and participation More logistically challenging (but worth it!) |
TABLE 5.3 A FACE-TO-FACE SESSION AGENDA
Time |
Objective |
Method |
10 min |
Build rapport |
Get-to-know-you conversation, focusing on who they are as a person, what makes them tick, and their relationship to your product or service (if any) |
25 min |
Understand context |
Personal ecosystem mapping (see Chapter 3) |
30 min |
Understand journey |
Experience mapping using directed storytelling and visual mapping |
20 min |
Further understand needs and solutions |
Cocreate solutions to pain points and opportunities uncovered in previous methods |
5 min |
Close session |
Conversation |
In this example, the session has been designed to create a comfortable, safe, and interactive discussion regarding the participant’s experiences and how those fit into the greater context of who they are and their personal context. Specific methods used include:
• Get-to-know-you conversation: A brief discussion to build rapport with the participant and lay the ground rules for the session. Treat this as you would a conversation with a stranger at a cocktail party. What do they do for a living? Do they have a family? What are their interests? Then segue into topics related to the domain you want to discuss in the session. This could be your product or service (e.g., getting a mortgage), or the greater context in which they exist (e.g., finding and buying a home).
• Personal ecosystem mapping: As discussed in Chapter 3, you can cocreate the participant’s personal ecosystem to dig into important people, places, things, and relationships. This approach helps you understand context and gives you a preview of what may be mentioned when you map their end-to-end journey.
• Experience mapping: This approach leverages two methods: directed storytelling and visual mapping. Directed storytelling is an interview technique in which a participant recalls an experience (in this case, a recent journey). As the participant recalls his story, you or another facilitator can visually map the journey as it is revealed. This helps you make sure that you have captured the actions, emotions, thoughts, and moment accurately.
• Cocreate solutions: Before closing the session, take some time to consider the future with the customer. Use the unmet needs, pain points, and opportunities you have uncovered to explore new solutions.
COCREATING THE JOURNEY VISUALIZATION
During research sessions, I strive to get a participant leaning in and cocreating artifacts with me. This gets the participant more engaged and leads to deeper insights. For example, after visualizing the customer’s journey, you can place a translucent sheet of vellum over your diagram (see Figure 5.5). You and the participant can then discuss and sketch improvements.


FIGURE 5.5
Visualizing the journey, now and in the future.
In the Moment and in Context
In addition to talking with customers about past experiences, observing customer journeys as they happen can yield incredibly valuable insights. The type of methods you employ will depend upon the nature of your product or service. Regardless, your goal is to reduce the time between when a journey moment occurs and your understanding and interpretation of it.
In industries where physical channels play a critical role—such as retail, healthcare, banking, and travel—there is a high return-on-investment for getting directly into the environments in which key moments occur. Specific approaches include:
• Observation: Watching customers interact with different people and things in the environment (see Figure 5.6).
• Intercepts: Following and observing customers; brief interviews with them to dig deeper into what you saw and the moments that occurred outside of direct observation.
• Ride-a-longs: Using contextual inquiry to follow the journey of your customer while asking questions and validating your observation.
• Apprenticing: Training as a service provider and interacting directly with customers to understand needs, touchpoints, and interactions more deeply.

FIGURE 5.6
Observing customer interactions directly requires interpretation.
For more digital products and services, similar techniques can be leveraged. Intercepts, for example, may involve soliciting participants while interacting with a website to discuss their experience, previous moments, and what they may do next. A ride-a-long in this context involves recruiting participants pre-journey and observing as they interact with digital channels in context.
More observational techniques require some interpretation for nailing down building blocks such as thinking and feeling. Pairing them with intercepts and other methods can help balance seeing what happened with understanding why and what it means.
First-Person Documentation
A third research category involves equipping your customers to capture their own journeys as they unfold. Multiple common self-reporting methods work well for experience mapping, including:
• Textual: Analog or digital journals in which the customer records their journey moments
• Photographic: Annotated photographs of key journey moments
• Video: Real-time or post-moment capturing of the journey
• Snippets: Micro reflections as moments occur sent via text or mobile app
First-person studies require careful design and lots of scaffolding for participants to be successful. However, the richness of data collected in situ and in follow-up interviews can be well worth it.
What About Quantitative Research?
Quantitative and qualitative research should go hand-in-hand. You may have a number of sources for quantitative research: analytics, Net Promoter Score (NPS), and Voice of the Customer, just to name a few. This is incredibly valuable data to ensure that you understand the range of behaviors and interactions customers have with your product or service during their journeys. In general, three types of quantitative data can add value to your experience mapping effort:
• Pre-existing marketing data: Most marketing organizations invest in regularly surveying customers. Look for studies that touch upon moments of your customer journey to see if any valuable insights lurk within them. For example, a previous survey may have asked customers which channels they prefer or moments in which they were most or least satisfied.
• Business metrics: Businesses ask their functional departments to measure their performance and report back trends to inform strategy. Within common reports such as NPS, channel performance, conversion funnels, and many others, you can get a feel for trends in performance that can be mapped back to what you learned in qualitative research.
• Channel data: Each channel has best practices for measuring interactions with customers. Web and mobile analytics can reveal usage rates, user flows, entrance and exit points, and more granular conversion data. Call center reports include call volumes, types of assistance requested, and resolution paths. Dig into this data to piece together which pathways customers take more often and what happens when they do. Then use your qualitative research to understand why.
• Journey-based survey data: In addition to pre-existing data, you should consider conducting your own survey to see how your qualitative insights play out at scale. You may have individual data about the usage of any given channel, but doing journey-based surveys helps you look at the channels utilized across an individual’s experience and how they perceived their touchpoint interactions and the overall experience. Figure 5.7 shows this approach when visualized in map form.
Quantitative data, of course, does not provide the why behind behaviors, the thoughts and emotions that customers experience, or the different contexts in which interactions take place. When asked, tell your colleagues that quantitative research is valuable, but not adequate on its own. However, when you interview a handful of people but can bolster your findings with data representing a great sample size, then you can have more confidence that you have painted a full picture of the range of experiences your customers are having.

FIGURE 5.7
In this Rail Europe experience map, survey results were mapped by journey stage.
How Do You Involve Different Stakeholders Successfully?
As you go through your iterative discovery and research process, it’s important to keep your colleagues engaged and active along the way. Here are a few techniques to involve different stakeholders from experience mappers to influencers:
• Build a question map. Before you design your protocol, hold a session with a broad range of stakeholders. Run an exercise to gather questions that each stakeholder would like to know about the end-to-end experiences of customers. Analyze everyone’s input as a group to identify key topics to incorporate into your protocol.
• Rotate experience mappers. Most of your colleagues will not have the skill to facilitate research sessions, nor the time to participate in all of them. It’s important, however, to bring several stakeholders into the field to understand the viability of your approaches and build direct empathy with customers. A good approach is to rotate these colleagues in the role of note-taker. To ensure that you get good notes, make sure that you train everyone who will go into the field and design a note-taking template with instructions to provide sufficient scaffolding for their role.
• Do a gallery tour. Often, too much time goes by between gathering insights and sharing them. A powerful technique that builds team rapport and customer-centered culture is to hold a post-research gallery tour. At the conclusion of field research, gather everyone who participated in the field and build out a room displaying raw information from your sessions. Items could include a picture of each participant, the journey and ecosystem maps you created with them, and sticky notes with key insights from each session. Then, do an open house for other stakeholders to tour your research gallery (see Figure 5.8). Have each experience mapper tell stories from the field, referencing the materials.
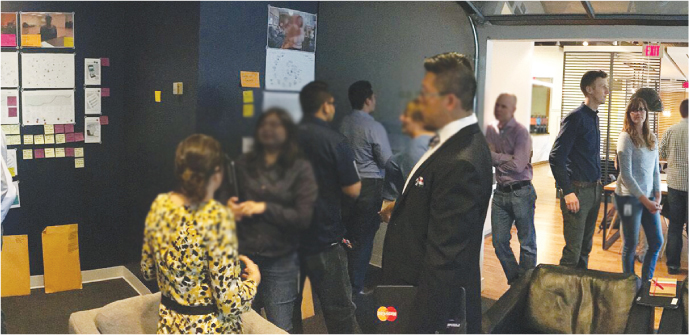
COURTESY OF CAPITAL ONE
FIGURE 5.8
A gallery tour presenting field research to the greater organization.
Making Sense of What You Learned
The collaborative research approach does not end once you complete your sessions. Bring your cross-functional team together to dig in and find the larger story within your data.
To get to that story, you and others will need to find the patterns within your discovery and research outputs. This will take time and get a little messy. Approaches common to research—unpacking your data, finding patterns through affinity mappings, and then laddering up to generate insights—apply to experience mapping. In addition to those fundamentals, these steps should be followed to go from raw stories to insights:
1. Go deep into each customer’s story. Go through each session’s outputs at a high-level, sharing with one another the stories you heard. Start building a list of findings, story by story.
2. Group cohorts and break down their journeys. Begin looking for patterns across your different customer findings. Group together similar customers. Then go through your research notes and artifacts for each group to understand each journey and how they compare with others in their cohort.
3. Compare cohorts. Look for patterns across cohorts. Regroup customers as you find deeper patterns.
4. Nail down your structure and key themes. Using the building blocks and frameworks recommended in Chapter 4, “Orienting Around Journeys,” define a structure for your experience map. Take a first pass at the themes that it should communicate.
5. Correlate with other models and data. Take the structure from your mapping activities and merge it into what you have learned through touchpoints, inventories, quantitative data, and any observational research.
6. Keep refining. Getting your structure right and choosing what details to include will take several iterations. Keep at it.
These activities can take place in a multiday workshop or across several working sessions. See the “Experience Mapping” workshop following this chapter for how to tackle the steps outlined previously.
Communicating What Matters
A good experience map should serve as a catalyst for action. For it to do so, you have to translate your findings into a compelling artifact. You should design your experience map (or maps) to support your next steps, whether that is strategic planning, idea generation, or tactical execution. Approach your experience map as a tool to be used, not a research deliverable to be consumed.
There is no experience map template; however, best practices have emerged in recent years. Here are some tips to guide your design decisions.
• Design for your context. You have a lot of options in designing your map. Craft your artifact to the needs of its users and ensure that it fits the greater system of tools that support your strategy and execution.
• Create a clear structure. The stages and moments that emerged during your analysis serve as an important structural frame for your map. As with chapters and sections in a book, these elements should help users navigate the story you want to tell. Both stage and moment labels should reflect the language of your customers in order to reinforce their experiences. Avoid business jargon such as awareness, consideration, conversion, or loyalty. Go for labels that summarize the overarching customer actions or needs from their perspective, such as “exploring my options,” “getting to the hotel,” or as in Figure 5.9, “I think I need help.” Often, you will find inspiration in the conversations that you had with customers to phrase your stages and moments authentically.
• Show relationships among the customer building blocks and touchpoints. Make sure that your customer and their interactions with your organization take center stage. Moment by moment, highlight the nature and quality of your customer touchpoints and the range of what customers do, think, and feel.
As you explore options for communicating the relationships, look at options for using one of the customer building blocks to drive your story. Is it about the customer’s emotional journey (see Figure 5.10)? Is it about what they are doing? Thinking? Depending on the themes or insights you want to communicate, one of these should stand out as central to how you visualize the journey.
COURTESY OF ADAPTIVE PATH
FIGURE 5.9
“I think I need help”—as opposed to “awareness”—communicates the customers’ actual experience clearly.

COURTESY OF ADAPTIVE PATH
FIGURE 5.10
In this example for home buying, the feeling building block takes center stage with other building blocks mapped against it.
• Emphasize that not all customers are the same. You will have found a range of needs and experiences within your customer base, perhaps leading to creating profiles of archetypes. How you indicate this in your artifact depends on the story you want to tell. You can represent this diversity by calling out the breadth of experiences, comparing the emotional journeys of different customer types (see Figure 5.11), or designing separate maps for different customer profiles. Your map doesn’t have to carry the entire load of your customer insights, but make sure that you critique your map to ensure that it doesn’t overgeneralize your customers as the customer.

COURTESY OF ADAPTIVE PATH
FIGURE 5.11
Comparing emotional journeys of different customer types.
• Share the big picture. While highlighting touchpoints is job one, make sure that you include insights into moments or needs outside of those with your product or service. How much you include will depend on the level of zoom you choose—shopping and buying for a home vs. applying for a mortgage—and how critical the insights are to your understanding of your customers’ stories.
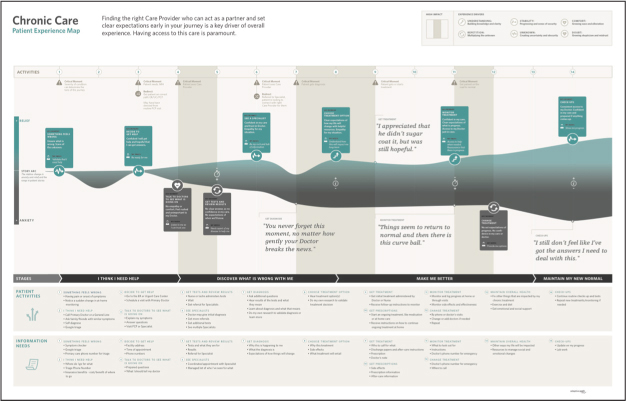
• Give prominence to what matters most. Everything you choose to include in your map should be important, but you should have a strategy for what should stand out the most and what can serve as secondary or supporting information. Figure 5.12 shows a good approach of including a clear overarching story with salient highlights, while providing detail to “drill down” for more information. Follow solid information design principles—such as hierarchy, contrast, scale, and color theory—to make the most effective map that you can.5

COURTESY OF ADAPTIVE PATH
FIGURE 5.12
There’s lots of good information to drill down on, but the salient highlights are immediately clear.
• Bring in the customer’s voice. Using verbatim quotes from your customers adds richness and authenticity to your map. Use quotes sparingly to double-down on key insights and further synthesize data presented throughout your map. Less is more.
• Highlight some, but not all, quantitative data. As noted earlier, bringing quantitative data that provides more insights into customers’ experiences or the role of touchpoints and channels adds some weight to your map. As with customer quotes, don’t go overboard in putting numbers and graphs in your map. Highlight insightful data and let other supporting documentation get deeper into the numbers if you have them.
• Play with form to create tools. Later chapters will detail how experience maps can be used as tools in the design process. Again, you want to avoid your map being just a pretty deliverable filed away never to be seen again. This goes back to designing for your context. Figure 5.13 illustrates different ways to present your map for use in socialization, downstream design activities, and ongoing updating and maintenance.

FIGURE 5.13
Get creative with the forms your map can take to be useful and effective in your culture.
• Tell a story. Finally, and most importantly, work backward from the story you want to tell. Before you start exploring ways to visualize your map, write down the key points it should communicate and what you want people to take away. Just as you can deconstruct an experience into building blocks, you can design for what you want users of your map to think and feel as they experience the artifact. Try to craft a story and a tool for what you hope they will do with their insights. Then use your key points and takeaways to critique how you visualize the map and refine it accordingly.
TELL A COMPELLING STORY
When done correctly, a map tells a story with depth and richness around the human experience. I love telling stories with visuals and models because it is easier and faster for people to comprehend than a few paragraphs of words. A good model of the journey tells a story through the layering of qualitative and quantitative information. With the element of time, this visual model is the quickest and most effective way to tell a story.

CHAPTER 5 WORKSHOP EXPERIENCE MAPPING
An experience-mapping workshop uses a co-creation approach to build an initial experience map with the colleagues that joined you in field research. This workshop assumes that you followed many of the approaches outlined in Chapter 5, “Mapping Experiences.” You should have several people—experience mappers—who spent time directly with customers and know their stories. Facilitating this workshop involves guiding participants through a series of activities to understand each customer’s experience in detail and synthesize those findings into key insights. Depending on the scope of your focus, this workshop may happen in a couple working sessions, or it may take several days and sessions. This is structured research synthesis, but the hard work results in an experience map that you can stand behind.
Workshop Objectives
• Get all participants up-to-speed on the key findings from each customer session.
• Perform a detailed analysis of each customer’s journey.
• Find patterns across customers to generate key insights.
• Synthesize the individual journeys in an initial experience map.
Agenda
This workshop typically takes two to three days, depending on how many interviews and observations you performed with customers. The times below provide timing for each key step across a two-day workshop. This agenda also includes structured breaks and meals, but you can build breaks in more organically.
TABLE 5.4 DAY 1 WORKSHOP AGENDA
Activity |
Description |
Duration |
Review agenda and objectives |
Share the activities for the day and what you want to accomplish by the end of the session. |
30 min |
Go deep into each customer’s story (Part I) |
Go through each session’s outputs at a high-level, sharing with one another the stories you heard. Start building a list of findings, story by story. |
90 min |
Break |
Recharge! |
15 min |
Go deep into each customer’s story (Part II) |
Continue to go through the stories. |
120 min |
Lunch |
Eat! |
60 min |
Go deep into each customer’s story (Part III) |
Finish going through the stories. |
90 min |
Break |
Give people a rest while you set up for the next activity. |
15 min |
Group cohorts and break down journeys (Part I) |
Look for patterns across your different customer findings. Group similar customers. Then deconstruct each journey into its building blocks. |
120 min |
TABLE 5.5 DAY 2 WORKSHOP AGENDA
Activity |
Description |
Duration |
Group cohorts and break down journeys (Part II) |
Continue breaking down the journeys. |
120 min |
Break |
Give people a rest while you set up for the next activity. |
15 min |
Compare cohorts |
Look for patterns across cohorts. Regroup customers as you find deeper patterns. Mine your data to pressure-test your sensemaking. |
90 min |
Lunch |
Eat! |
60 min |
Nail down structure and key themes (Part I) |
Using the building blocks and frameworks recommended earlier in this chapter, define a structure for your experience map. |
120 min |
Break |
Recharge! |
15 min |
Nail down structure and key themes (Part II) |
Complete your structure and document key themes. |
90 min |
Review and reflect |
Review the workshop process and outcomes. Determine the next steps. |
15 min |
Roles
• Lead facilitator: Workshop host and main facilitator for session activities
• Co-facilitator(s): Help(s) set up, break down, and assist in activities
• Documentarian: Takes photographs of the session to help nonparticipants understand the collaborative process
Participants
• Facilitators from field research
• Experience mappers from field research
Artifacts
• Research documentation: Written notes, photographs, and video from your sessions.
• Co-creation artifacts: Journey visualizations or other artifacts created with customers in your sessions.
Materials
• Self-stick easel pad or butcher paper (to create a wall canvas)
• Tape or drafting dots to place artifacts and documentation on walls
• Sharpies
• Sticky notes
• Camera
Preparing for the Workshop
As with the other workshops recommended in this book, how well you prepare and communicate will make or break the effectiveness of your session. Make sure that you have previously educated your collaborators and sold the value of experience principles. (See the handy list earlier in the chapter.) You want your workshop to be laser focused on getting feedback on your principles, not the process. You do not want the session to go off track explaining in detail what experience principles are or defending their usefulness. People should be excited to collaborate on shaping a tool together, not being introduced to the concept for the first time.
Running the Workshop
This workshop can be challenging to facilitate. You will have lots of data to comb through in your notes, transcripts, and session artifacts (e.g., journey maps made with customers). Your participants will have varying expertise in unpacking research effectively and efficiently. The days will be long, and participants will run into conflicts related to their “day jobs.”
Trust us, it’s worth the hassle. This type of detailed work builds empathy for customers and partnerships within your organization. Be patient, but firm, as you guide the group through these steps:
• Go deep into each customer’s story.
• Group cohorts and break down their journeys.
• Compare cohorts.
• Nail down your structure and key themes.
Go Deep into Each Customer’s Story
Your colleagues will have experienced one or more research sessions directly. Very few (if any) of your team, however, will have spent time with every customer. Therefore, your first objective is to get your team familiar with each customer and their unique story. You can do so by kicking your analysis off with introducing one another to what you learned in each session. Here is one approach:
• Assign each research participant to a colleague who participated in the corresponding session.
• Ask each person to go through the session’s outputs (typically: notes, co-creation worksheets, transcripts, photography, and debrief sheets) and pull out the key findings. They can write each finding on a sticky note. Instruct people to be thorough. This will take some time. Note: The same approach can work for self-reported journeys generated using diary methods.
• After everyone has analyzed their session outputs, take turns introducing each customer. If you have visual artifacts from your session, they should be used to help make the insights more tangible. Focus on the key categories of building blocks at a high level:
• Who is the customer?
• What did you learn about her ecosystem and context?
• What sparked her journey?
• What were the major moments?
• What were her motivations, key needs, and emotional high and low points?
• What’s the moral of her story?
• As people present, have other colleagues capture notes (one per sticky) of things that stand out to them. This will help speed up the synthesis of key themes later in the process (see Figure 5.14).
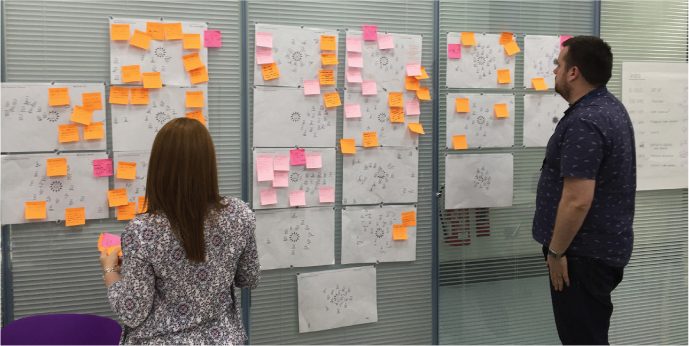
FIGURE 5.14
Finding patterns in the personal ecosystems of customers.
Group Cohorts and Break Down Their Journeys
Once you have unpacked each session and created a high-level understanding of each customer, you need to take an initial pass at how your customer falls into cohorts. What defines a cohort in your research depends on the variables that you believe most affect customer behaviors, emotions, and needs. This may or may not map to the segmentation that you used to recruit or codify pre-existing customer models, such as personas. Here are a few examples:
• Investing: Customers on a mission vs. customers in exploration mode
• Travel: First-time fliers vs. seasoned fliers
• Home loans: New mortgage vs. refinancing
• Healthcare: Going to the emergency room vs. going to primary care
• Shopping: Casual vs. loyal customers
At this stage, don’t get too hung up on how you organize your customers. Your goal is to identify customers to compare as you break down their journeys into more detail. Often, your first segmentation won’t be where you end up. Don’t get stuck. Make an informed call and get to mapping.
After you have your cohorts, organize your colleagues into small teams. Your next objective is to take the journey of each customer and break it down into its constituent building blocks. Here are some tips to manage the process:
• Set up a large canvas for each team to work and give them sticky notes in five to six different colors. This canvas can be on the wall or a long table.
• Each team should start with one customer. Recap again the customer’s background and ecosystem.
• Then—leveraging notes, transcripts, visual journeys, and other assets—begin breaking down the customer’s journey moment-by-moment, step-by-step. Focus first on what the customer did, thought, and felt, as well as what she interacted with from one end of her experience to the other. Fill in other details—people, places, and so on—as you go along.
• It’s best to define clear lanes for each building block. As illustrated in Figure 5.15, different color sticky notes can be used to differentiate building blocks, or you can pick a different color for each customer.
• As the journey takes shape, look for natural breaking points in the journey. These chapters of the customers’ stories will help you determine your journey stages.
• Identify and add quotes from customers that illustrate key findings.
• Do the same process for all customers in each cohort, mapping them to the same canvas. This will take some maneuvering of sticky notes, but this approach helps you compare the experiences of different customers more easily.

FIGURE 5.15
Breaking down a journey into its building blocks.
SKETCHING AND CLUSTERING MOMENTS
If you did visual mapping of each participant’s journey in your sessions, you can use another approach to jump-start the mapping process. Take one of your illustrated journeys and identify the key moments. For example, when ordering from Warby Parker, your package of samples arrives at your home. You then try them on, choose which one you want, and pack up the samples to return (among other moments). Then, as illustrated in Figure 5.16, take a quarter sheet (A6) of paper and capture the following for each moment:

• The name of the moment
• A sketch representing that moment
• Details on the actions, thoughts, feelings, and ecosystem entities
Doing this for each journey produces dozens of moment cards that you can compare, contrast, and organize to identify patterns. You can then go deeper into your notes and transcripts to flesh out the details by using the sticky note approach outlined previously.

FIGURE 5.16
Pulling moments out of an individual journey.
Compare Cohorts
When the dust settles from your detailed mapping, take a step back. Work as a team to identify the patterns within and across cohorts. Look to answer these questions:
• Did your segmentation hold up? What would be a better way to group your customers? Do you need to group them at all?
• What needs emerged? Which ones were common? Extreme?
• Did customers go through similar moments? How did those moments cluster into stages?
• Were there common high and low points? Did you find lots of divergent experiences?
• What expectation gaps, pain points, and opportunities did you discover?
• What time did customers spend in different stages or moments?
• What breakdowns did customers experience in changing channels?
• What did you learn about the quality of your product or service touchpoints? Did any new touchpoints emerge?
• What did you learn about the experiences outside of your control? What other products, services, people, and things impact customer behaviors, emotions, thoughts, and needs?
Nail Down the Structure and Take-Aways
The results of this discussion (which you should diligently capture) will lead you to nailing down a draft of some important structural elements and the key take-aways from your research. Here is a checklist of what you and your colleagues need to align around:
• An approach to grouping customers based on their needs and experiences
• The stages and moments of the end-to-end journey
• The range of actions, thoughts, and feelings by stage and moment
• Ecosystem elements (touchpoints, other products and services, people, etc.) that play a role in or impact the customer experience and that customer’s greater context
• The channels in which interactions take place
• Key customer needs by stage and moment
• Time durations and places within the journey
• Customer quotes that reflect key insights
• Pain points and opportunities
• What it all means: what your experience mapping tells you about the qualitative experiences for customers and what it means for them and your organization
HOLD A GALLERY TOUR
Previously, we mentioned doing a gallery tour to engage stakeholders, and immediately after this workshop is a perfect time for one. You and your colleagues play the role of docents, guiding visitors through your work and telling stories and anecdotes from the field. I typically do this as an open house for 1–2 hours, and often show video clips as well. These sessions help build empathy, show the rigor behind the work, and expose high-level executives to the collaboration happening across their teams. It’s always a big hit and creates buzz (and often demand) for these types of approaches.

After the Workshop
This workshop jump-starts your journey mapping, but you will still have a good bit of work to do. As noted earlier in Chapter 5, you will continue to iterate on your experience map and the story it needs to tell. This includes correlating with other data and research, sketching approaches to visualize your map, and using a draft of your map in opportunity and ideation workshops to identify additional improvements you can make. (See the workshops after Chapters 7, “Identifying Opportunities,” and 8, “Generating and Evaluating Ideas.”)