
Chapter 8
Checking for Errors
What's in This Chapter?
Detecting threading errors
Fixing data races
Detecting memory errors
Controlling the right level of detail
Creating a custom analysis
Using multiple threads with common memory can easily lead to parallel-type errors, such as data races and deadlocks. Resolving these errors can often be frustrating and time-consuming, so it is vital that you detect them at an early stage of development.
You can use several different tools from Parallel Studio XE to help debug your parallel programs:
- Parallel Advisor — Advisor guides developers to add parallelism within their existing C/C++ programs. However, you need to add Advisor notations to identify the possible parallel regions. For more details, see Chapter 10, “Parallel Advisor–Driven Design.”
- Parallel Debugger Extension — This extension pairs the parallel tools provided for developing multithreaded applications with the debug extensions, to allow for parallel features within the debugger. See Chapter 11, “Debugging Parallel Applications,” for more details.
- Static Security analysis — Static Security analysis is carried out by the compiler and identifies both coding errors and security vulnerabilities through deep analysis of the source code. However, no final execution file is produced. For more details, see Chapter 5, “Writing Secure Code.”
This chapter describes the operation of Intel Parallel Inspector XE, which you can use to find threading and memory errors after you have attempted parallelization. Creating parallel programs introduces the prospect of new types of errors involved with concurrent threading. These errors can have serious consequences on the efficiency and correctness of your parallel programs. Without tools such as Inspector XE, these threading errors can be notoriously difficult to find. You can also use Inspector XE to find many types of memory errors.
You have already used Inspector XE in Chapter 3, “Parallel Studio XE for the Impatient.” If you haven't read that chapter or tried its hands-on activities, now would be a good time to do so.
Parallel Inspector XE Analysis Types
Chapter 3 describes the four steps you can use to make your code parallel: analyze, implement, debug, and tune. In the debug step you must check to see if you have introduced any parallel-type errors into your program. This is where you can use Inspector XE.
Inspector XE has predefined analysis types to help you (see Figure 8.1). These are split into three categories:
- Memory Error analysis — Detects and locates memory leaks, and finds other memory problems
- Threading Error analysis — Detects and locates data races and deadlocks
- Custom analysis types — Stores your own analysis types
Figure 8.1 Inspector XE's Configure Analysis Type window
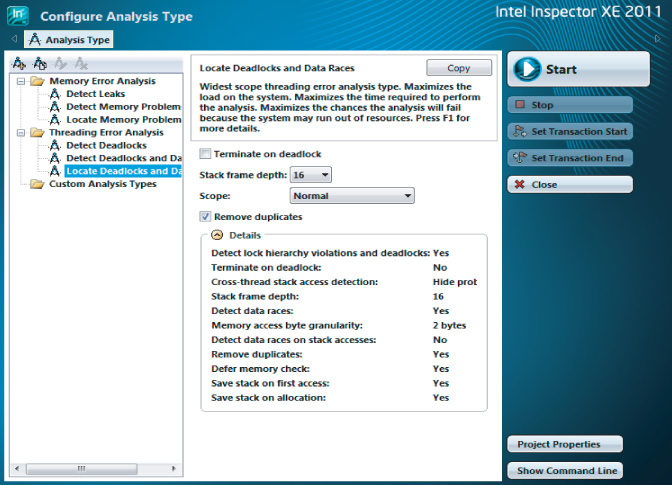
Each analysis type performs analysis to a different scope; the wider the scope, the more impact the analysis has on the time taken to run the program under test. Table 8.1 describes the likely impact of each scope. The descriptions are taken directly from the Configure Analysis Type window.
Table 8.1 The Scope of Each Analysis Type
| Scope | Analysis Types | Impact on Program Under Test |
| Narrowest | Detect Leaks
Detect Deadlocks |
Minimizes the load on the system. Minimizes the time required to perform the analysis. Increases the chances the analysis will complete successfully, particularly on large applications/large data sets. |
| Medium | Detect Memory Problems
Detect Deadlocks and Data Races |
Increases the load on the system. Increases the time required to perform the analysis. Increases the chances the analysis will fail because the system may run out of resources. |
| Widest | Locate Memory Problems
Locate Deadlocks and Data Races |
Maximizes the load on the system. Maximizes the time required to perform the analysis. Maximizes the chances the analysis will fail because the system may run out of resources. |
You can find more details on exactly what options each analysis type uses in the section “Creating a Custom Analysis” later in this chapter.
If you are working on very large applications, it is best that you perform your first analysis using the narrowest scope level, and then when you have fixed all the problems at one scope level, move on to the next.
Detecting Threading Errors
You already know how to run a threading analysis session; you did this back in Chapter 3. Using Listing 8.4 (at the end of the chapter), this section reminds you how to look for threading errors. You can try this analysis out for yourself in Activity 8-1 and Activity 8-2.
Types of Threading Problems
Inspector XE can report the following types of problems:
- Thread information
- Potential privacy infringement
- Data races
- Deadlocks
Thread Information
Inspector XE provides information about the location and number of threads created during the execution of the program; it does not mean that there is a problem. Typically in a parallel program, a pool of threads is created, with the number of threads based on the number of cores in the machine or a user-specified number. If Inspector XE reports only a single thread being created, you may be running a serial program or be executing on a single-core machine. For some parallel models, for example, OpenMP, you also need to specifically enable the right compiler options to enable the parallelism.
Potential Privacy Infringement
Privacy infringement can occur when one thread accesses the stack memory of another thread. Inspector XE reports a potential problem when it detects variables of one thread being accessed by another thread. This is actually a remark only, giving an advisory message that there may potentially be some problem; in many cases it may not matter. Accessing cross-stack data can cause unexpected behavior, including a crash, if no protocols are in place to ensure safe accesses.
Variables involved in data races can be the cause of privacy infringements. Where possible, it is better not to allow threads to share variables on the stack.
Data Races
A data race occurs when multiple threads are trying to access the same memory location without proper synchronization — for example, when one or more threads is reading a variable while another thread is concurrently writing to it. Threads that read the variable before the writing thread updates the variable will obtain a different value from any threads reading the variable after the update.
Deadlocks
A deadlock is a situation where one thread is waiting for another thread to finish with a mutually exclusive resource, while at the same time that thread is waiting for the first thread to finish with its mutually exclusive resource. Neither thread can finish; therefore, a deadlock ensues.
Deadlocks are a common problem in multiprocessing, and are particularly troublesome because there is no general solution to avoid them.
An Example Application Involving Deadlocks
The code in Listing 8.4 uses approximate integration to calculate the values of pi. Figure 8.2 shows the principle used. By adding up the area of each bar under the curve, an approximation of pi is calculated.
Figure 8.2 Calculating pi
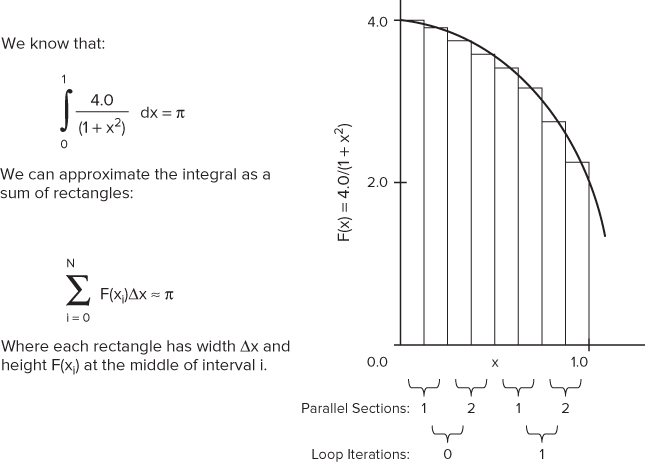
The code is parallelized using the OpenMP sections directive, but it has errors. The code is not intended to be an example of how to write good threaded code; rather, it is written to help demonstrate the different threading errors that you can detect in Inspector XE. The following lines in Listing 8.4 provide the parallelism:
- Line 32 — The for loop is responsible for iterating over every bar. On each iteration of the loop, the area of four bars is calculated.
- Lines 35–63 — The OpenMP sections directive contains two section directives. Each section runs in parallel and calculates the area of two bars. The results of the calculations from each section are stored by calling the SafeAdd() function.
- Lines 10–18 — The SafeAdd() function adds the values held in the parameters sum1 and sum2 into the global variables gsum1 and gsum2, respectively. Two OpenMP locks, lock1 and lock2, are used to protect access to the two global variables.
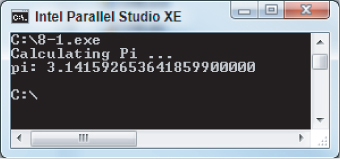
Because of the programming errors in the code, the program will not run correctly. Figure 8.3 shows the output from the program once you have corrected all the errors.
Figure 8.3 The output window of the application
Detecting Deadlocks
Detecting deadlocks using Inspector XE is straightforward. Even if a deadlock does not actually happen, you should be able to detect it — that is, as long as you have executed the code path on which the deadlock resides.
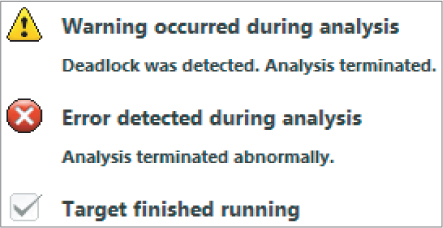
When you run the pi program from Listing 8.4, you will see that the log reports a deadlock, as shown in Figure 8.4.
Figure 8.4 The log report from Inspector XE
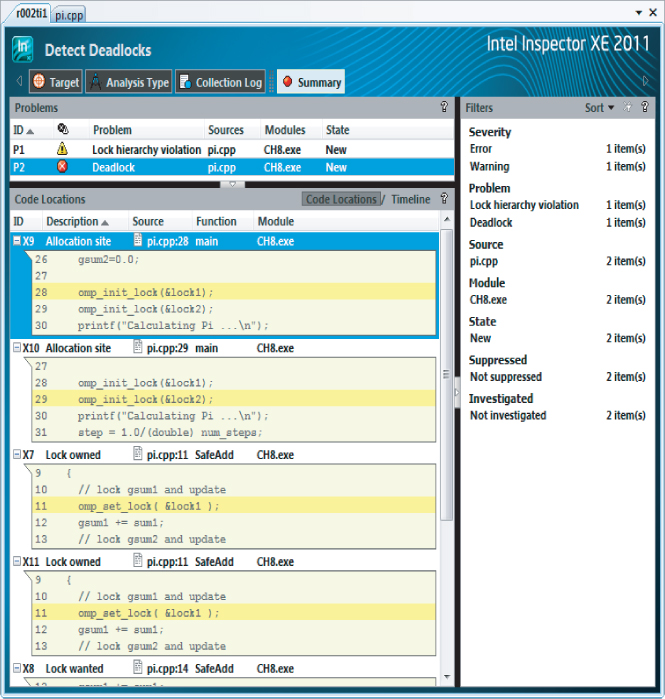
The Summary window shows the results of running a Detect Deadlocks analysis on the code from Listing 8.4 in more detail (see Figure 8.5). The two reported problems, P1 and P2, are related. P2 is a deadlock and is caused by the lock hierarchy violation, as reported in problem P1. The snippets of code in the Code Locations pane show the source of the P2 deadlock problem. In total, six observations associated with the deadlock are detected, and are labeled X7 to X12.
Figure 8.5 Code snippets related to the P2 deadlock
Sometimes you will find it useful to look at the Timeline view (see Figure 8.6). You can access the Timeline view by clicking the Timeline tab at the top right of the Code Locations pane.
Figure 8.6 The Timeline view
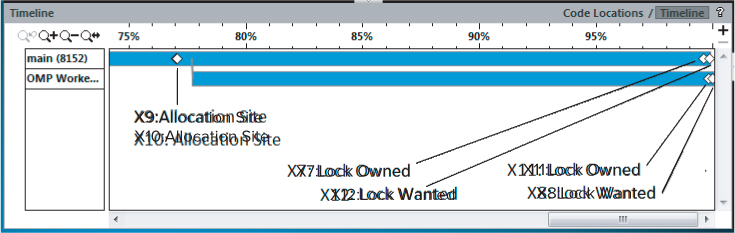
The two horizontal bars are the two threads that were running. The four diamond markers show the time where the six events (X7 to X12) happened. Events X9 and X10 are located at the first diamond. If you hover the mouse over the diamond markers, the names of the events are displayed. If you then examine the locks associated with these six events, by looking at the code displayed in the Code Locations pane (as in Figure 8.5), the sequence of events looks like this:
You immediately should be suspicious of what you see:
- Apparently both threads own lock1 (at events X7 and X11). This is impossible; two threads cannot own the same lock at the same time.
- No thread owns lock2, yet the lock is wanted at X12 and X8.
Something must be really wrong with the program. With a bit more investigation you will realize that the cause of the problem is the order in which the locks are being used when calling the SafeAdd() function. The order of the locks has been accidently swapped in Lines 48 and 61 of Listing 8.4:
48:        SafeAdd(sum1,sum2,lock1,lock2);
61:        SafeAdd(sum1,sum2,lock2,lock1);
You can resolve the deadlock problem relatively easily. If both threads use the same locks in the same order, no deadlock will result. By changing the order of the parameters lock1 and lock2 so that both calls to SafeAdd() use them in the same sequence, you can fix the deadlock:
48:        SafeAdd(sum1,sum2,lock1,lock2);
61:        SafeAdd(sum1,sum2,lock1,lock2);
This was a relatively simple case. However, deadlocks can be very difficult to detect without the right tools, which is where the use of Inspector XE comes into its own.
Building and Running the Program
Windows
icl /Od /Qopenmp /Zi pi.cpp -o 8-1.exe
Linux
icc -OO -openmp -g pi.cpp -o 8-1.exe
8-1.exe
Detecting and Fixing the Deadlock
inspxe-gui
- Select File ⇒ New ⇒ Project.
- In the Project Properties dialog, fill in the application details.
- Select File ⇒ New ⇒ Analysis.
- Highlight the Detect Deadlocks analysis.
- Make sure the Terminate on Deadlock box is selected.
- Click the Start button.
48:        SafeAdd(sum1,sum2,lock1,lock2);
61:        SafeAdd(sum1,sum2,lock1,lock2);
Detecting Data Races
Once the deadlock from Listing 8.4 has been fixed, it's time to look for any data races by running the Detect Deadlocks and Data Races analysis. The steps are identical to what you did when you ran a Detect Deadlocks analysis, except you choose a different prebuilt analysis type.
Running the Threaded Program
Before running the analysis you should run the program several times to see if the results are deterministic. Table 8.2 shows the value of pi for ten runs of the program. In the first five runs, the program ran in parallel; in the last five runs, only one thread was made available by setting the OMP_NUM_THREAD=1 environment variable. You can see that when the program runs with more than one thread, the value of pi varies.
Table 8.2 The Value of pi
| Attempt # | Value | OMP_NUM_THREADS |
| 1 | 3.145416887792414700000 | Not Set |
| 2 | 3.141616771104690700000 | Not Set |
| 3 | 3.141592656670666500000 | Not Set |
| 4 | 3.142346075956167900000 | Not Set |
| 5 | 3.142247551357102900000 | Not Set |
| 6 | 3.141592653641859900000 | 1 |
| 7 | 3.141592653641859900000 | 1 |
| 8 | 3.141592653641859900000 | 1 |
| 9 | 3.141592653641859900000 | 1 |
| 10 | 3.141592653641859900000 | 1 |
First Results of the Analysis
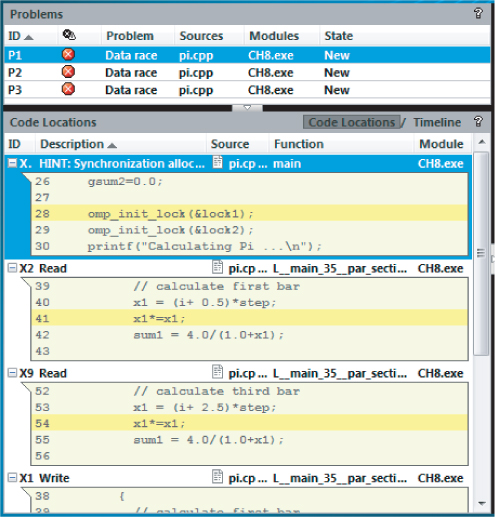
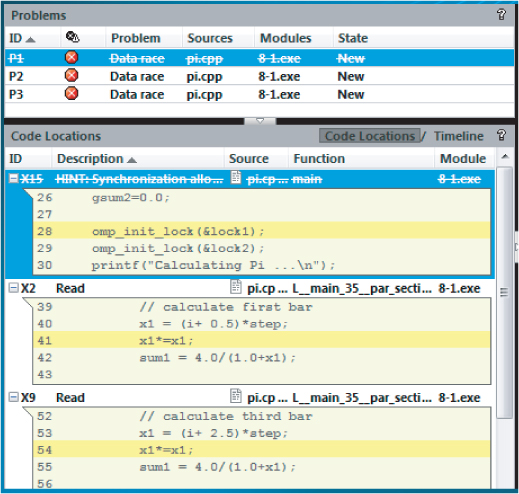
When you run a Detect Deadlocks and Data Races analysis, you should get results similar to Figure 8.7. Three data races, P1, P2, and P3, are detected. With the P1 error highlighted, you can see that the problem is related to simultaneously reading from and writing to the variable x1. Similarly, P2 and P3 relate to variables x2, sum1, and sum2.
Figure 8.7 Three data race problems are revealed after the resolving deadlock
You can fix these data races by modifying line 35 so that each thread has its own private copy of x1, x2, sum1, and sum2:
35: #pragma omp parallel sections private(x1,x2,sum1,sum2)
With the problem fixed, when you rerun the program you will see that:
- The value of pi stays the same value when you run the program several times.
- Running a fresh Inspector XE analysis gives the result “No Problems Found.”
You can try out these steps for yourself in Activity 8-2.
Building and Running the Program
Windows
icl /Od /Qopenmp /Zi pi.cpp -o 8-2.exe
Linux
icc -OO -openmp -g pi.cpp -o 8-2.exe
8-2.exe
Windows
set OMP_NUM_THREADS=1
8-2.exe
Linux
export OMP_NUM_THREADS=1
  ./8-2.exe
Detecting and Fixing the Data Race
- Select File ⇒ New ⇒ Analysis.
- Highlight the Detect Deadlocks and Data Races analysis.
- Click the Start button.
35: #pragma omp parallel sections private(x1,x2,sum1,sum2)
Controlling the Right Level of Detail
The pi program is very small and has only a few data races. You may have many more errors in your programs. You need to avoid two extremes when analyzing your code:
- Failing to test all the code paths
- Collecting and/or displaying too much information
Testing All the Code Paths
When you perform an analysis, it's important that you choose the right test data so that all your code paths are executed. You might find it quite hard to test some of your code, especially if it is in a path that is not normally executed (for example, error handling code). To help overcome this, you can:
- Build your program in debug mode with optimization disabled — This ensures that none of your code paths are optimized away, and all the functions and symbols will be available in your results. For example, no inlining of functions will occur.
- Write test cases that exercise the less obvious paths through your code — That is, manipulate the data to force the program to run down the obscure pathways through your code. Don't assume a pathway will never occur in general operation; they always will.
- Do a Static Security analysis — As described in Chapter 5, “Writing Secure Code,” this kind of analysis tests all the paths in the code, although it cannot detect every kind of threading problem. Some problems can be detected only when you actually run your program.
Avoiding Being Overwhelmed by the Amount of Data
The more information you collect, the slower your analysis session will take to run. The analysis might even fail to complete if you generate too much data. Strategies you can use for reducing the amount of data include:
- Use a minimum test set. For example, where a loop is involved, reduce the loop count to a minimum.
- Don't use a higher depth of analysis than you need. Deeper depth investigations take longer and generate more data. In the predefined analysis pane, the first items in the list are the ones that have the lowest overhead. See the “Creating a Custom Analysis” section for more information on what each analysis type contains.
- Use the one-click filters to display a subset of the results. You can filter the results based on severity, problem type, source file, module, state, and suppression mode. You can read more about the one-click filters in the “Investigating the Results of the Analysis” section in Chapter 5.
- Use suppression files where large numbers of problems exist to help reduce the information to manageable chunks.
Using Suppression Files
The threading example used in this chapter is fairly simple and creates only a few errors that can be easily managed. In other, more complex and extensive situations, the sheer quantity of problems and observations may well overwhelm and confuse you. You may also know that some errors are false positives and can be ignored.
Creating Suppression Files
You can suppress problems and observations in Inspector XE using suppression rules. In effect, these rules declutter the overview of problems and their observational events, making it easier for you to focus on a subset of the problems reported. You can experiment with suppression rules by using the output from Activity 8-1 (refer to Figure 8.7).
Assume that you want to suppress the results of the first data race, P1. To do this, perform the following steps:
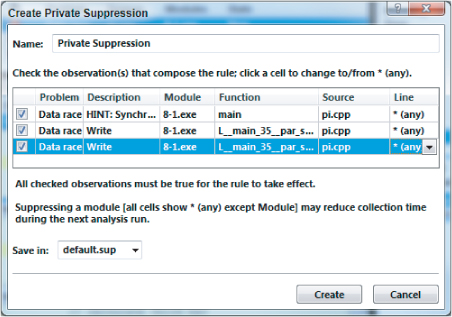
Figure 8.8 The pop-up window for creating private suppressions
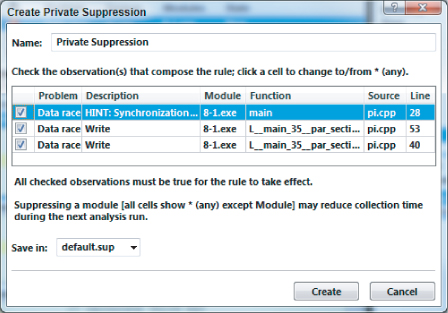
Upon creating this new suppression rule, the summary display will be changed, as shown in Figure 8.9. Notice that P1 and its associated observations have been crossed through.
Figure 8.9 Simple suppression of the first data race
Deleting Suppression Files
To remove the private suppression rule you just made:
After you have removed this suppression rule, notice that problem P1 and its associated observations are no longer crossed through.
Suppressing by Type Rather Than by Instance
You can also choose to suppress not just a single occurrence of a type of problem, but all occurrences of the type:
Figure 8.10 Suppressing all data races
A new suppression rule is created suppressing all data races. You should notice that all three data race problems have now been crossed through. Once you have created the suppression rules, the next time you run an analysis all the suppressed problems will be ignored.
Changing the Suppression Mode
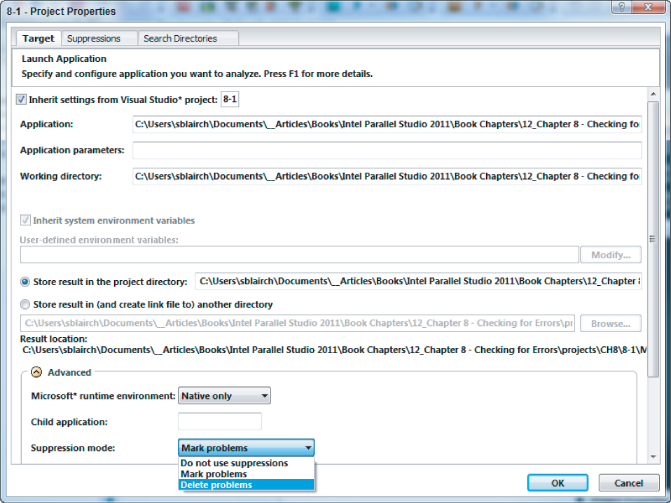
You can use the Project Properties window to change how the suppression rules are used (see Figure 8.11). Three options are available from the Suppression mode drop-down menu:
- Do not use suppressions — Use this if you want to ignore all suppressions.
- Mark problems — Displays the problems and associated events with each item being written through.
- Delete problems — This is the default behavior. Any events that match the suppression rules will not be displayed. There will be no hint that they have been supressed!
![]()
Figure 8.11 Changing how suppression filters are used
Suppressing known problems can aid with development. If you are already aware of certain problems, you can suppress them, which enables you to focus on and fix those problems of which you were not aware. At the end of this chapter is a discussion on different ways of fixing data races in Cilk Plus, OpenMP, and TBB.
The next section of this chapter shows how to detect memory errors. Before you read that, however, you can use Activity 8-3 to experiment with suppression files.
Creating a Suppression Rule
- Right-click one of its observations in the Code Locations pane.
- Select the Suppress option from the drop-down menu.
- In the Create Private Suppression window, click the Create button.
- Select File ⇒ New ⇒ Analysis.
- Highlight the Detect Deadlocks and Data Races analysis.
- Click the Start button.
You should notice that all the previous errors are no longer displayed.
Deleting a Suppression Rule
- Select File ⇒ New ⇒ Analysis.
- Highlight the Detect Deadlocks and Data Races analysis.
- Click the Project Properties button.
- In the Advanced section of the Project Properties dialog, set the suppression mode to Mark problems, and then click OK.
- Click the Start button.
- Right-click one of its observations within the Code Locations pane.
- Select the Do Not Suppress option from the drop-down menu.
- In the Delete Private Suppressions window, check the box for the name of the file (in the top half of the window).
- Click the Remove button.
Suppressing by Type
- Select the P1 data race problem.
- Right-click one of its observations within the Code Locations pane.
- Select the Suppress option from the drop-down menu.
- In the Create Private Suppression window, click in the line number column of the first entry. This enables you to access a drop-down menu, where you should select *(any).
- Repeat this for the remaining lines.
- Click the Create button.
Fixing Data Races
After detecting deadlocks or data races in your program, you need to fix them. Cilk Plus, OpenMP, and TBB each have their own constructs that will help. Don't forget that you can borrow constructs from one parallel model and use them in another (see the section “Choosing the Right Parallel Constructs” in Chapter 1).
You can use the following strategies to deal with data races:
- Use local variables rather than shared variables.
- Restructure your code or change your algorithm.
- Use objects that are designed to be safely shared across threads.
- Use atomic operations.
- Use locks or other synchronization constructs to enforce mutual exclusion.
Before deciding to use a construct, you should see if you can fix your data race problem by using local variables or restructuring your code.
Using Cilk Plus
You can use three different kinds of Cilk Plus objects to handle shared data:
- Reducers
- Holders
- Home-grown reducers
Home-grown reducers are not covered in the book. You can find more information about them in the online help that is distributed with the Intel compiler.
Cilk Plus does not have any locks available, but you can use synchronization objects from TBB or system locks provided by the OS.
Cilk Plus Reducers
Cilk Plus reducers are objects that address the need to use shared variables in parallel code. Conceptually, a reducer can be considered to be a shared variable. However, during run time each thread has access to its own private copy, or view, of the variable, and works on this copy only. As the parallel strands finish, the results of their views of the variable are combined asynchronously into the single shared variable. This eliminates the possibility of data races without requiring time-consuming locks.
Listing 3.3 in Chapter 3 uses a cilk::reducer_opadd to overcome the data races caused by the sum and total shared variables. Each type of reducer has its own default initialization value, but you can initialize them yourself when they are declared. In Listing 3.3 the values are explicitly set to zero (which also happens to be the default value for the reducer_opadd):
// define check sum and total as reduction variables
cilk::reducer_opadd<long int> sum(0);
cilk::reducer_opadd<double> total(0.0);
Each type of Cilk Plus reducer has its own header file that should be included. For the reducer_opadd this is:
#include <cilk/reducer_opadd.h>
To obtain the final merged values of the reduction variables, use the get_value() method:
printf("Time Elapsed %10d mSecs  Total=%lf   Check Sum = %ld
",
       (int)elapsedtime, total.get_value(), sum.get_value() );
If none of the reducers available in the Cilk Plus reducer library fit your need, you can write your own. You can find an example of writing your own reducer in the online help that is distributed with the Intel compiler.
Cilk Plus Holders
Holders are similar to Cilk Plus reducers in that you can use them to provide variables that can be used in parallel code. However, Cilk Plus holders do not preserve all the views beyond the parallel strands. One view will be maintained, based on the holder policy, which can be one of holder_keep_indeterminate, include holder_keep_last, holder_keep_last_copy, holder_keep_last_swap, and holder_keep_last_move. For more information on these policies, refer to the Intel compiler online help. The default policy in the template definition is holder_keep_indeterminate:
template <typename Type,
        holder_policy Policy = holder_keep_indeterminate,
        typename Allocator = std::allocator<Type> >
class holder
{
  //etc.
};
You can use holders to provide the equivalent of thread-local storage. You can even wrap holders with your own class to reduce the amount of code edits you have to make. Chapter 16, “Parallelizing Legacy Code,” contains an example of defining your own wrappers.
Listing 8.1 gives an example of using Cilk Plus holders and how you can create your own wrapper.
 Listing 8.1: Using Cilk Plus holders
1:  #include <cilk/holder.h>
2:
3:  cilk::holder<int> g;
4:
5:  // code that uses Cilk Plus holder
6:  void test1()
7:  {
8:    int i;
9:    g() = 8;
10:   cilk_spawn[]
11:   {
12:     g()=100;
13:     i = g();
14:   }();
15:   g()= 37;
16:   cilk_sync;
17: }
18:
19: // template for wrapper
20: template <typename T>
21: class myholder
22: {
23:   private:
24:     cilk::holder<T> m_holder;
25:   public:
26:     myholder<T> & operator=(const T &rhs)
27:     {
28:       m_holder() = rhs;return *this;
29:     }
30:     operator T &(){return m_holder();}
31: };
32:
33: // code that uses the wrapper
34: myholder<int> h;
35: void test2()
36: {
37:   int i;
38:   h = 8;
39:   cilk_spawn[]
40:   {
41:     h=100;
42:     i = h;
43:   }();
44:   h = 37;
45:   cilk_sync;
46: }
code snippet Chapter88-1.cpp
Line 3 declares a cilk::holder, which is used in the cilk_spawn/cilk_sync parallel code (lines 10–16). Notice that to access the values of the g variable, the function operator has to be used:
12:     g()=100;
13:     i = g();
At line 34, the h variable uses a wrapper template, the wrapper being defined in lines 20–31. You will immediately notice that the access to the h variable does not need to use a function operator:
41:     h=100;
42:     i = h;
Both the cilk::holder and the myholder templates provide variables that are safe to use in parallel code. Each parallel strand treats the variables as its own private variable without any data races occurring.
Using OpenMP
OpenMP provides a number of constructs that you can use to implement mutual exclusion, including locks, critical sections, atomic operations, and reduction clauses.
Using Locks
You've already seen how you can use OpenMP locks to enforce mutual exclusion earlier in the chapter. Be careful when you use locks; it is very easy to forget to release a lock. Many programmers prefer not to use any locks in their code. If you can, avoid locks.
Using Critical Sections
The following code shows how you can protect a shared variable with a #pragma omp critical construct. You could use this code in place of the existing code in lines 10–17 of Listing 8.3. In this example, the critical constructs have been given a name (you can use any name).
#pragma omp critical(gsum1)
gsum1 += sum1;

#pragma omp critical(gsum2)
gsum2 += sum2;
Any #pragma omp critical statements that do not have a name are all given the same anonymous name.
Using Atomic Operations
The following code shows how you can use an atomic operation to enforce mutual exclusion. You can use atomic operations to protect a memory update. For example, placing the #pragma omp atomic directive before the variable gsum1 ensures that there is no data race:
#pragma omp atomic
gsum1 += sum1;

#pragma omp critical
gsum2 += sum2;
Atomic operations are much more efficient than using locks or critical sections.
Using a reduction Clause
For an example of using an OpenMP reduction clause, see the section “Parallelizing Loops” in Chapter 7, “Implementing Parallelism.”
Using TBB
By using the algorithms in TBB, you should be able to avoid concurrent access. TBB also provides a number of concurrent containers that you can use to avoid data races. The containers are very similar to the STL containers.
Listing 8.2 is an example of using the tbb::concurrent_queue. The queue is first filled with values from 0 to 99 using queue.push(). Two while loops, each embedded in its own lambda function, are then executed in parallel using parallel_invoke. Each parallel strand pops values off the queue until the queue is empty. The try_pop() function returns true if an item has been returned from the queue; otherwise, it returns false.
Listing 8.2: Using a TBB container
1: #include <tbb/tbb.h>
2: #include <stdio.h>
3: int main()
4: {
5:   int a,b;
6:   tbb::concurrent_queue<int> queue;
7:   for(int i =0; i< 100; i++)
8:     queue.push(i);
9:
10:  tbb::parallel_invoke(
11:  [&]{
12:       while(queue.try_pop(a)){
13:         printf("a%d ",a);
14:       }
15:    },
16:  [&]{
17:       while(queue.try_pop(b)){
18:         printf("b%d ",b);
19:       }
20:     }
21:   );
22: }
code snippet Chapter8Memory8-2.cpp
On rare occasions, you may want to introduce mutual exclusion into your code to prevent some race condition or enforce some deterministic behavior into your code. You can use TBB mutexes and atomic operations to enforce mutual exclusion.
Variants of the mutex include spin_mutex, queueing_mutex, spin_rw_mutex, and queueing_rw_mutex. Like all C++ variables, mutexes work within the scope they are declared. Once a mutex goes out of scope, its destructor is called, which releases the lock.
The atomic<T> template class provides a single atomic operation on a single variable. Methods include read, write, fetch-and-add, fetch-and-store, and compare-and-swap.
Listing 8.3 shows the use of a tbb::mutex and a tbb::atomic. Within the cilk_for loop, three variables (a, b, and c) are incremented. Variable a is protected by the TBB mutex m.lock() and m.unlock() methods; variable b is declared to be a tbb::atomic operation; and variable c has no protection against data races. When the code is built and run, the values of the incremented variables are printed to the screen. All the values are incremented 1,000 times, but the value of c will almost certainly be wrong due to a data race.
Listing 8.3: Using TBB locks
1: #include <cilk/cilk.h>
2: #include <tbb/mutex.h>
3: #include <stdio.h>
4: int main()
5: {
6:   int a = 0;
7:   tbb::atomic<int> b;
8:   b = 0;
9:   int c = 0;
10:  tbb::mutex m;
11:
12:  cilk_for(int i =0; i< 10000; i++)
13:  {
14:    m.lock();
15:    a++;
16:    m.unlock();
17:    b++;
18:    c++;
19:  }
20:  printf("a:%d, b:%d, c:%d
",a,b,c);
21:}
code snippet Chapter88-3.cpp
Detecting Memory Errors
Inspector XE has three predefined analysis types dedicated to finding memory errors (refer to Figure 8.1):
- Detect Leaks — Use this to detect where memory or resources are allocated but never released. This is the narrowest scope of analysis and will have the least impact on your code. For large applications, it is best to start an analysis with this type.
- Detect Memory Problems — Use this to detect memory leaks (as in the previous bullet) and invalid or uninitialized access to memory.
- Locate Memory Problems — Use this to perform the most detailed analysis. In addition to detecting memory problems, the analysis has enhanced checks for dangling pointers (a pointer that has been used after it has been freed) and enables guard zones. Inspector XE adds guard zones to the end of allocated memory to test for any memory access that strays beyond the end of a memory block. Of the three analysis types, this analysis will have the most impact on your application. On large applications, the analysis may fail due to insufficient resources.
Types of Memory Errors
You can use Inspector XE to detect memory errors in both parallel and nonparallel code. Parallel programs can be much more sensitive to memory errors than serial programs. A memory error often can introduce unpredictable behavior; when you run a program with a memory error, it's not always obvious that there is a problem. It is important that you don't forget to run a memory analysis on your code.
You can detect several types of memory errors, including the following:
- GDI resource leak — This occurs when a Graphics Device Interface (GDI) object is created but never deleted.
- Incorrect memcpy call — This occurs if you use the memcpy function with two pointers that overlap. This error is checked only on Linux systems; on Windows, the overlapping of memcpy pointers is considered safe.
- Invalid deallocation — This happens when you try to call a deallocation function with an address pointing to memory that has not been allocated dynamically.
- Invalid memory access — This occurs when a read or write instruction references invalid memory. This can happen, for example, when you use stale or dangling pointers. A dangling pointer is one that has been freed but has not been set to the value NULL.
- Invalid partial memory access — This occurs when a block of memory is accessed that is partially invalid. Often the cause of such errors is the miscalculation of the size of an object before dynamically allocating it.
- Kernel resource leak — This happens when a kernel object handle is created but never closed.
- Memory growth — This happens when memory is allocated but not deallocated during application execution. For example, the continual allocation of memory in a loop without the memory being deallocated will lead to memory growth.
- Memory leak — This occurs when a block of memory is allocated but never released.
- Mismatched allocation/deallocation — This happens, for example, when you attempt to deallocate memory with the delete function that was allocated with the malloc function.
- Missing allocation — This occurs when you attempt to free a previously freed block of memory, or free a memory block that was never allocated.
- Uninitialized memory access — This occurs when you read memory that has not been initialized (for example, when you dynamically create a block of memory and start reading from it without first initializing its values).
- Uninitialized partial memory access — This occurs when you read memory that has been only partially initialized (for example, if you dynamically create a struct but initialize only some of the members, and start reading from one of the uninitialized members).
An Example Application for Memory Analysis
Listing 8.5 (at the end of the chapter) shows an example program that reveals several types of memory errors. Each potential memory error has been explicitly commented on within the example program. The program has an outer loop within which the following actions take place:
- Line 23 — A drawing object is created, but never deleted. This creates a GDI resource leak, where each iteration of the outer loop uses up more resources allocated for graphical purposes. Eventually, the limits of these resources will be used up and the program will stop. These types of memory errors are notoriously difficult to detect because they do not affect the correct operation of the program; only after the program has been running for some time will graphical allocation limits be reached and the program stop running. This code is included only if you are building under Windows.
- Line 26 — A region of memory in heap space is reserved by the dynamic allocation call to calloc and used as a temporary array to hold data for some calculations that follow. However, the space is never freed. Each iteration of the outer loop will reserve a new region of heap without freeing the previous ones. This is a memory leak. Unless corrected, eventually all the heap space will be used up. Again, this sort of error does not affect the immediate running of the program; only later, when all the heap space has been consumed, will the program fail to carry on running.
- Line 35 — A second region of heap space is reserved and used as another temporary array. However, the program accesses the array with an index beyond its limits (lines 40–43). This is an invalid memory access error. Pointer operations of this type would not be picked up by the compiler.
- Lines 42 and 45 — This second reserved space is then released; however, the released pointer is then used to access memory. This is another invalid memory access error.
- Line 47 — An attempt is then made to free the second reserved space again, which creates a missing allocation error. Although this will not affect the outcome of the program or stop its operation, it does use up valuable executing time.
- Line 48 — An uninitialized pointer is then used to allocate memory. This is another invalid memory access error.
Because these activities lie within a loop, any activities not tightly controlled will be found by the inspection — for example, allocation of heap space without associated release of this space.
As before, with the threading errors example, it is advisable to use a small representative data set when inspecting. To this end, the example program has been altered to run only once through its outer loop.
Run a new inspection of the example program using Inspector XE's Locate Memory Problems analysis, the fullest and most comprehensive analysis possible for memory errors (see Activity 8-4).
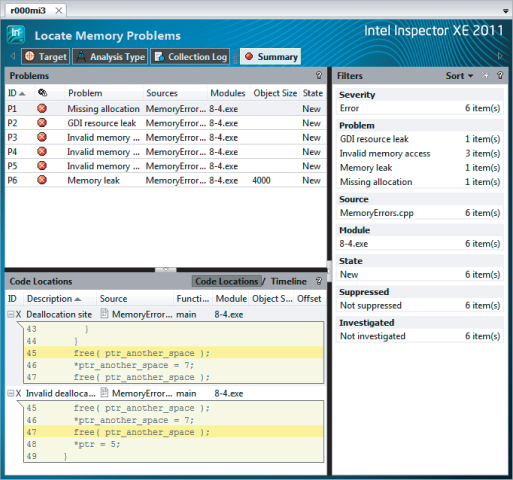
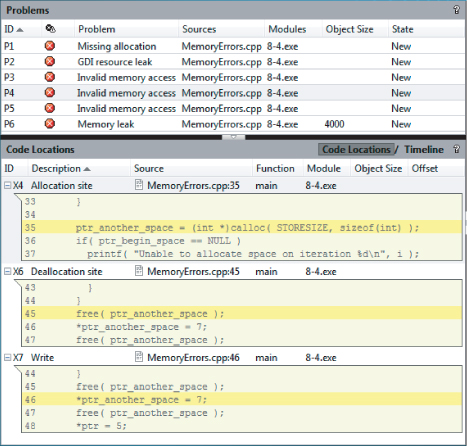
After a successful analysis, the output shown in Figure 8.12 will result. All six possible memory errors are accounted for, marked as problems P1 to P6 in the Problems pane of the Inspector XE's output. Clicking each problem results in the corresponding associated observations event data for that problem being shown in the Code Locations pane (the lower-left pane).
Figure 8.12 Inspector XE output from the memory errors example
The Filters pane shows a summary of problems, including how many of each. To filter the problems by type, you can just select (by clicking) one of the problem types. For example, clicking on Invalid memory access results in Figure 8.13, which shows only invalid memory access errors. Filtering like this concentrates the mind onto a particular error type, before moving onto the rest. Clicking the All button brings all the memory problems back.
Figure 8.13 Filtered memory errors observations
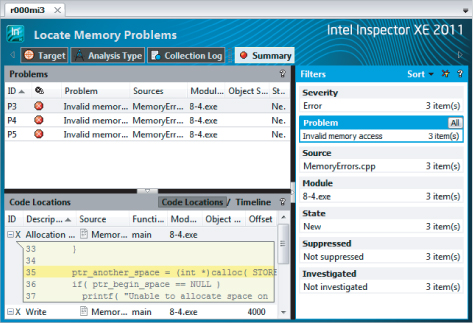
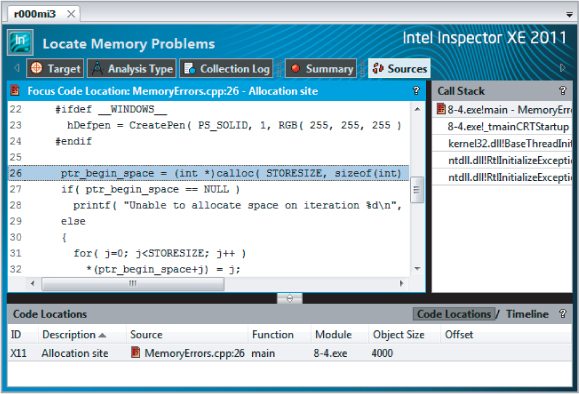
Clicking one of the squares to the left of any event in the Code Locations pane brings up a snippet of code that is responsible for that observation. This is demonstrated for problem P4 in Figure 8.14, where events X4, X6, and X7 have been selected. The summary information to the right has been closed to give a better view of the code.
Figure 8.14 Code snippets associated with events of problem P5
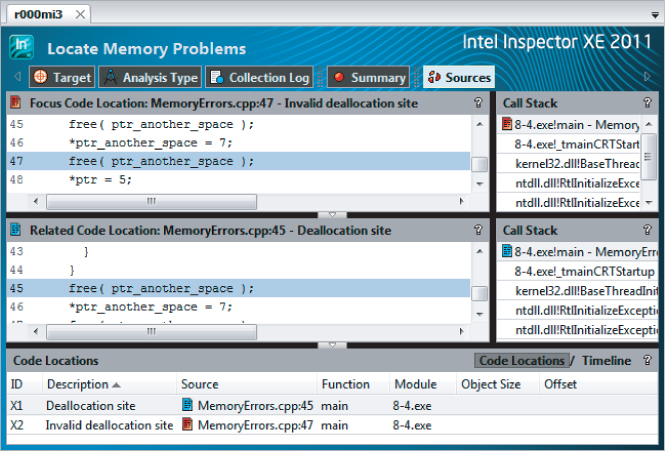
Alternatively, you can reveal these same code snippets by double-clicking the problems themselves within the Problems pane, as shown in Figure 8.15, where problem P1 has been selected. In this example, the problem X2 occurs when a deallocation was attempted.Also shown is the associated event X1 where the original deallocation was carried out. Obviously, you cannot deallocate a memory address that has already been deallocated. You can solve the P1 problem simply by removing the second deallocation.
Figure 8.15 Revealing the offending code responsible for the P1 problem
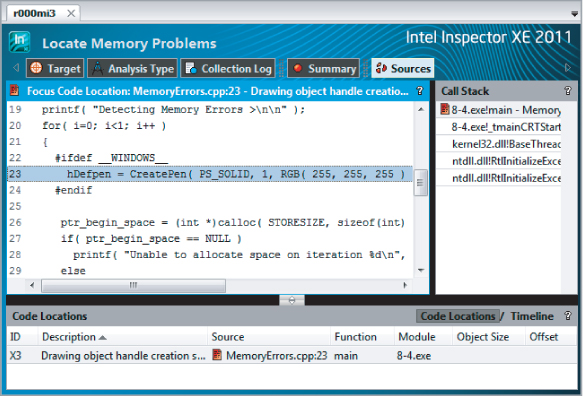
The P2 problem is a GDI resource leak, caused by hDefpen (see line 23 of Listing 8.5) being repeatedly created but never deleted. As new pens are continually created for each loop iteration, the graphical resources may eventually be used up, causing the program to fail. Problems of this sort are notoriously hard to predict.
In this example, although there is only a single outer loop for testing purposes, and therefore the leak cannot cause a program failure because the closing of the application will automatically release any resources it uses, Inspector XE will still flag it as a potential problem.
Figure 8.16 shows the code snippet associated with the P2 problem, clearly indicating that there is a problem with pen creation. You can solve this by deleting the pen at the end of each loop iteration.
Figure 8.16 Revealing the offending code responsible for the P2 problem
The memory leak problems are similarly caused by continuously reserving space within the heap space without freeing up any of it. Again, eventually all the heap space will be used up and the application will fail. This is clearly shown for problem P6 by the code snippet shown in Figure 8.17.
Building and Running the Program
Windows
icl /Od /Zi MemoryErrors.cpp -D_WINDOWS_ gdi32.lib -o 8-4.exe
Linux
icc -OO -g MemoryErrors.cpp -o 8-4.exe
8-4.exe
Detecting Memory Problems
inspxe-gui
- Select File ⇒ New ⇒ Project.
- In the Project Properties dialog, fill in the application details.
- Select File ⇒ New ⇒ Analysis.
- Highlight the Detect Memory Problems analysis.
- Click the Start button.
- Highlight the problem you have fixed.
- Right-click and select Change State from the context menu.
- Change the state to Fixed.
Figure 8.17 Revealing the offending code responsible for the P12 problem
Creating a Custom Analysis
When you select a new analysis for Inspector XE, the Configure Analysis Type window appears. This window enables you to select the analysis type and to configure it to your own requirements. Six analysis types are offered; however, you can also create a customized analysis of your own.
To create a custom analysis type, right-click on the Custom Analysis Type in the Configure Analysis Type window (see Figure 8.18).
Figure 8.18 Creating a custom analysis type
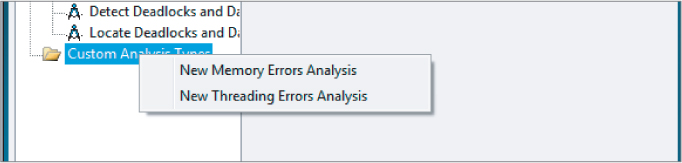
You can select a new Memory Errors analysis or a new Threading Errors analysis, or you can copy the analysis you have currently selected. When creating a new analysis, you can configure a number of options. The following descriptions are taken directly from the tooltips in Inspector XE's Custom Analysis dialog box:
- Memory Errors analysis options
- Detect memory leaks — Detect problems where a block of memory is allocated but never released. Extremely low cost, especially if used only with “Remove duplicates” selected.
- Detect resource leaks — Detect problems where a kernel object handle is created but never closed, or where a GDI object is created but never deleted. Useful when analyzing Windows GUI applications. Low cost.
- Detect invalid/uninitialized accesses — Detect problems where a read or a write instruction references memory that is logically or physically invalid, or a read instruction accesses an uninitialized memory location. Medium cost.
- Analyze stack access — Analyze invalid and uninitialized accesses to thread stacks. High cost.
- Enable enhanced dangling pointer check — Detect if an application is trying to access memory after it was logically freed. Medium to high cost.
- Byte limit before reallocation — Set the amount of memory Inspector XE defers returning to the pool of available memory.
- Enable guard zones — Show offset information if Inspector XE detects memory use beyond the end of an allocated block. Useful when an application exhibits unexpected behavior or when you need more context about heap allocations to interpret invalid memory access problems. Low cost.
- Stack frame depth — A high setting is useful when analyzing highly object-oriented applications. A higher number does not significantly cost.
- Remove duplicates — When deselected, reports all instances of detected errors on the timeline. Low cost.
- Threading Errors analysis options
- Detect lock hierarchy violations and deadlocks — Useful when an application has complicated synchronization and it is hard to verify correctness, or when you suspect deadlock problems that are not yet evident. Low cost unless an application has a significant number of locks.
- Terminate on deadlock — Stop analysis and application execution if Inspector XE detects a deadlock. Low cost.
- Cross-thread stack access detection — Set alert mechanism for when a thread accesses stack memory of another thread. Low cost.
- Stack frame depth — A high setting is useful when analyzing highly object-oriented applications. The higher the number, the higher the cost.
- Detect data races — Detect problems where multiple threads access the same memory location without proper synchronization and at least one access is a write. High cost.
- Memory access byte granularity — Set the byte size of the smallest memory block on which Inspector XE should detect data races.
- Detect data races on stack accesses — Detect data races for variables on the stack.
- Remove duplicates — When deselected, reports all instances of detected errors on the timeline. Low cost.
- Defer memory check — Do not allocate shadow memory for given block until second thread access.
- Save stack on first access — Report as much information as possible on all threads involved in a data race. High cost.
- Save stack on allocation — Identify the allocation site of dynamically allocated memory objects involved in a data race. Medium cost.
The Source Code
Listing 8.4 contains a program with threading errors and is used in Activities 8-1, 8-2, and 8-3. Listing 8.5 contains a program with memory errors and is used in Activity 8-4.
Listing 8.4: A program with threading errors
1: #include <stdio.h>
2: #include <omp.h>
3: static long num_steps = 10000 * 4;
4: double step;
5: double gsum1;
6: double gsum2;
7:
8: void SafeAdd(double sum1, double sum2, omp_lock_t &lock1,omp_lock_t &lock2 )
9: {
10:  // lock gsum1 and update
11:  omp_set_lock( &lock1 );
12:  gsum1 += sum1;
13:  // lock gsum2 and update
14:  omp_set_lock( &lock2 );
15:  gsum2 += sum2;
16:  omp_unset_lock( &lock2 );
17:  omp_unset_lock( &lock1 );
18:}
19:
20:int main()
21:{
22:  int i;
23:  double x1,x2;
24:  omp_lock_t  lock1, lock2;
25:  gsum1=0.0;
26:  gsum2=0.0;
27:
28:  omp_init_lock(&lock1);
29:  omp_init_lock(&lock2);
30:  printf("Calculating Pi …
");
31:  step = 1.0/(double) num_steps;
32:  for (i=0;i< num_steps; i+=4)
33:  {
34:    double sum1,sum2;
35:    #pragma omp parallel sections
36:    {
37:      #pragma omp section
38:      {
39:        // calculate first bar
40:        x1 = (i+ 0.5)*step;
41:        x1*=x1;
42:        sum1 = 4.0/(1.0+x1);
43:
44:        // calculate second bar
45:        x2 = (i+ 1.5)*step;
46:        x2*=x2;
47:        sum2 = 4.0/(1.0+x2);
48:        SafeAdd(sum1,sum2,lock1,lock2);
49:      }
50:      #pragma omp section
51:      {
52:        // calculate third bar
53:        x1 = (i+ 2.5)*step;
54:        x1*=x1;
55:        sum1 = 4.0/(1.0+x1);
56:
57:        // calculate fourth bar
58:        x2 = (i+ 3.5)*step;
59:        x2*=x2;
60:        sum2 = 4.0/(1.0+x2);
61:        SafeAdd(sum1,sum2,lock2,lock1);
62:      }
63:    }
64:  }
65:
66:  // calc value of pi
67:  double pi = step * (gsum1+gsum2);
68:  printf("pi: %2.21f
",pi);
69:  omp_destroy_lock( &lock1 );
70:  omp_destroy_lock( &lock2 );
71:}
code snippet Chapter8pi.cpp
Listing 8.5: A program with memory errors
1: #include <stdio.h>
2: #include <stdlib.h>
3: #ifdef _WINDOWS_
4: #include <windows.h>
5: #endif
6: #include <omp.h>
7:
8: #define STORESIZE 1000
9: int main( void )
10:{
11:  int i, j;
12:  int * ptr_begin_space;
13:      int * ptr_another_space;
14:      int * ptr = NULL;
15:     #ifdef _WINDOWS_
16:      HGDIOBJ hDefpen;
17:   #endif
18:
19:      printf( "Detecting Memory Errors >

" );
20:      for( i=0; i<1; i++ )
21:      {
22:         #ifdef _WINDOWS_
23:          hDefpen = CreatePen( PS_SOLID, 1, RGB( 255, 255, 255 ) );
24:         #endif
25:
26:          ptr_begin_space = (int *)calloc( STORESIZE, sizeof(int) );
27:          if( ptr_begin_space == NULL )
28:              printf( "Unable to allocate space on iteration %d
", i );
29:          else
30:          {
31:              for( j=0; j<STORESIZE; j++ )
32:                  *(ptr_begin_space+j) = j;
33:          }
34:
35:          ptr_another_space = (int *)calloc( STORESIZE, sizeof(int) );
36:          if( ptr_begin_space == NULL )
37:              printf( "Unable to allocate space on iteration %d
", i );
38:          else
39:          {
40:              for( j=0; j<STORESIZE+1; j++ )
41:              {
42:                  ptr_another_space[j] = j;
43:              }
44:          }
45:          free( ptr_another_space );
46:          *ptr_another_space = 7;
47:          free( ptr_another_space );
48:          *ptr = 5;
49:      }
50:      return 0;
51:  }
code snippet Chapter8MemoryErrors.cpp
Summary
Eliminating parallel-type errors such as deadlocks and data races from programs has always been a major problem. As programs become increasingly complex, the ability to find and eliminate such problems becomes more difficult. In addition, you have to overcome all the extra problems that can be created when running parallel concurrent code. The greatest obstacle to solving these problems is finding them in the first place. Many problems can be subtle in their operation, showing up only under ideal circumstances. Software tools that can find all these types of errors become invaluable.
Intel Parallel Inspector XE is a sophisticated and versatile tool capable of finding a wide range of potential problems within both parallel and serial programs. Its flexibility and the presentation of its results make it a powerful tool for developers. This chapter has demonstrated just some of Inspector XE's capabilities. The case studies in Part III will amplify these capabilities even further.
The next chapter shows how to use Amplifier XE to tune the parallelism in your programs.