
1
Introduction to Power Plants
Contents
1.1 Introduction to the sources of energy: conventional and non-conventional principle of power generation
1.2 Factors affecting selection of site
1.3 Principal types of power plants
1.4 Present status and future trends
1.5 Layout of steam, hydel, diesel, nuclear and gas turbine power plants
1.6 Combined power cycles –comparison and selection
1.7 Merits of steam, gas, diesel, hydro and nuclear power plants
1.8 Resources and development of power in india
1.9 Petroleum and natural gas
1.10 Present status of power generation in india
1.11 Role of private and government organization
1.12 State-level scenario, load shedding
1.13 Carbon credits
1.1 INTRODUCTION TO THE SOURCES OF ENERGY: CONVENTIONAL AND NON-CONVENTIONAL PRINCIPLE OF POWER GENERATION
A variety of energy sources are available to supply to expanding needs in each country around the world. These sources are broadly classified as commercial or conventional energy sources and noncommercial or nonconventional energy sources. Most of the developed countries are highly dependent on conventional form of energy, whereas developing countries such as India is dependent on both the forms of energy sources.
Energy sources may be mainly classified into two categories: renewable and non-renewable energy sources.
1. Renewable energy sources
These are produced by nature and are inexhaustible. Renewable energy sources include both direct solar radiation utilized by solar collectors and cells and indirect solar energy in the form of wind, hydropower, ocean energy and sustainable biomass resources.
2. Non-renewable energy sources
These are either available in nature or produced by man artificially. They are exhaustible and nonrenewable. Conventional energy sources such as nuclear power and fossil fuels are nonrenewable.
Advantages and disadvantages of renewable energy sources are as follows:
Advantages
- They are produced by nature and considered as inexhaustible.
- They are pollution free, and hence eco-friendly.
- If utilized properly in developing countries, they can save a lot of foreign exchange and generate employment opportunities.
- Deployment is easy and rapid due to flexibility in their utilization.
- They are economical when considered over a longer period of time.
Disadvantages
- Their availability is intermittent (e.g. solar, wind, tidal, hydro, etc.) and hence need the assistance of nonrenewable energy.
- Complete commercialization is difficult on a larger scale.
- Initial cost is high due to the newer technologies used, which are still at preliminary stages.
- Sources are not evenly spread across the globe.
In sections that follow, both conventional and nonconventional energy sources are discussed in detail.
1.1.1 Conventional Energy Sources
These are commercial forms of energy available. They include the following:
- Fossil fuel that may be in solid, liquid or gaseous forms
- Water power or energy stored in water
- Nuclear energy
Worldwide consumption of total energy is as shown in the Table 1.1.
Table 1.1 Worldwide Consumption of Total Energy

From Table 1.1, it is evident that 92 per cent of total energy comes from coal, oil, gas, and uranium, and hence these are the most commonly used commercial energy sources.
1. Coal
It is the most common source of energy that is being used since industrialization. Modern steam boilers burn coal mainly as primary fuel in any of its available forms. Different ranks of coal available are peat, lignite, bituminous and anthracite.
Figure 1.1 shows a thermal power plant using steam as a working fluid. It consists of a steam generator, a condensing turbine coupled to a generator, a condenser with a condensate extraction pump and a feed water tank with a feed pump.

Fig. 1.1 A Typical Thermal Power Plant
In a coal-fired thermal power plant, coal is burnt in a boiler furnace. The heat generated is utilized to convert water, which is the working fluid, into superheated steam in the boiler or steam generator. The high-pressure steam is used to run the prime mover (steam turbine). The prime mover rotates along with an electrical generator coupled to it. Thus, mechanical energy is converted into electrical energy that is supplied to various points using power feeders. The steam that expands in the turbine is condensed into water in a surface condenser. The condensate water is pumped back to the feed tank. The feed water in the feed tank is heated by bleeding some amount of steam from the turbine. The hot feed water is pumped to the boiler using a feed pump.
According to estimates, coal reserves are sufficient enough to last for 200 years. However, coal reserves have lower calorific value, and their transportation is uneconomical. When burnt, they produce pollutants such as CO and CO2, and hence they are responsible for ecological imbalance.
2. Oil
Almost 40 per cent of energy needs is met by oil alone. With present consumption and a resource of 250,000 million tons of oil, it is estimated to last for only 100 years, unless more oil is discovered. Major chunk of oil comes from petroleum.
3. Gas
Due to the non-availability of ready market gas is not completely and effectively utilized and is burnt in huge quantities. Its transportation cost is much higher than oil. Large reserves are estimated to be located in inaccessible areas. Gaseous fuels are classified as follows:
- Gases of fixed composition such as acetylene, ethylene, methane, etc.
- Industrial gases such as producer gas, coke oven gas, blast furnace gas, water gas, etc.
4. Agricultural and organic wastes
These include saw dust, bagasse, garbage, animal dung, paddy husk, corn stem, etc., accounting for a major energy consumption.
5. Water
It is one of the potential sources of energy meant exclusively for hydro-electric power generation. Potential energy of water is utilized to convert it into mechanical energy by using prime movers known as hydraulic turbines. The operating cost of the plant is cheaper as compared to other types of power plants. It is the only renewable non-depleting source of energy that does not contribute to pollution.
Figure 1.2 shows a hydraulic power plant designed for high head. In a hydro-electric power plant, water is stored behind a dam that forms a reservoir. Water is taken from the reservoir through tunnels from where it is distributed to penstocks. A penstock is a large diameter pipe that carries water to the turbine. Trash racks are fitted at the inlet of tunnels to prevent any foreign matter from entering into the tunnels. A surge tank built before the valve house prevents sudden pressure rise in the penstock when the load on the turbine decreases or when the inlet valves to the turbine suddenly get closed. The flow of water in the penstocks is controlled in the valve house that is electrically driven. Thus, potential energy of water is utilized to run the prime mover (hydraulic turbine) coupled to an electric generator in the power house. After doing work, the water is discharged to the tail race.

Fig. 1.2 A Hydraulic Power Plant
6. Nuclear power
Any matter consists of atoms held together by means of binding energy. Controlled fission of heavier unstable atoms such as U235, Th232 and Pu239 liberates enormous amount of energy. This is possible only by utilizing small amount of nuclear fuels. It may be noted that the energy released by fission of one kilogram of U235 is equivalent to the heat generated by burning 4,500 kg of coal. This factor makes the nuclear energy more attractive. The energy generated during nuclear fission reaction is used to produce steam in heat exchangers, which is utilized to run the turbo-generators.
For nuclear power generation, three systems are considered. The first is based on natural uranium yielding power and plutonium. The second is by using plutonium and depleted uranium in a fast breeder reactor. The third system is by using thorium and converting it into uranium in a fast breeder reactor. India has uranium reserves only enough to produce 6 × 10⁶ kW of energy that is a meager 1 per cent of its current energy requirements.
1.1.2 Non-Conventional Energy Sources
1. Solar energy
Solar energy has the greatest potential of all the sources of renewable energy that comes to the earth from sun. This energy keeps the temperature of the earth above that in colder space, causes wind currents in the ocean and the atmosphere, causes water cycle and generates photosynthesis in plants. The solar energy reaching the surface of the earth is about 1016 W, whereas the world-wide power demand is about 1013 W. This means solar energy gives us 1,000 times more energy than our requirement. Even if we use 5 per cent of this energy, it is more than 50 times out requirement. The total solar radiation absorbed by the earth and its atmosphere is 3.8 × 1024 J/yr. Figure 1.3 shows a concentrating type solar collector used to trap solar energy.

Fig. 1.3 A Concentrating-Type Solar Collector
2. Wind energy
Wind energy can be economically used for the generation of electrical energy. Winds are caused by two main factors:
- Heating and cooling of the atmosphere which generates convection currents. Heating is caused by the absorption of solar energy on the earth's surface and in the atmosphere.
- The rotation of the earth with respect to atmosphere and its motion around sun.
The energy available in the winds over the earth's surface is estimated to be 1.6 × 10⁷ MW, which is almost the same as the present-day energy consumption. Wind energy can be utilized to run windmill that in turn is used to drive to generators. India has a potential of 20,000 MW of wind power.
The energy available in the winds over the earth's surface is estimated to be 1.6 × 10⁷ MW, which is almost the same as the present-day energy consumption. Wind energy can be utilized to run windmill that in turn is used to drive the generators. India has a potential of 20,000 MW of wind power.
Due to pressure differential existing between any two places on earth, air moves at high speed. This pressure differential is caused due to earth's rotation and by uneven heating of the earth by sun. The kinetic energy of air can be utilized to generate electric power. The kinetic energy per unit volume of moving air is given by the following equation:
![]()
where ρ is the density of air and V = average linear speed.
Figure 1.4 shows a typical windmill where water can be pumped out for irrigation and drinking purpose. Here the rotational motion of the wheel can be either translated into rotary motion (to generate electricity) or reciprocating motion (to drive the pump).
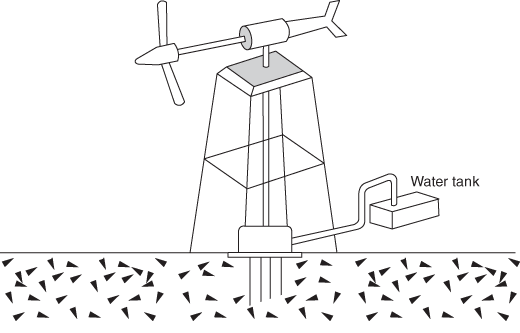
Fig. 1.4 A Typical Windmill
3. Energy from biomass and biogas
Bio-mass means organic matter that is produced in nature through photosynthesis. In the presence of solar radiation, water and carbon dioxide are converted into organic material, CH2O.
CH2O is stable at low temperature, it but breaks at higher temperature releasing heat equal to 469 kJ/mole.
CH2O + O2 → CO2 + H2O + 469 kJ/mole.
It is possible to produce large amount of carbohydrate by growing plants such as algae in plastic tubes or ponds. The algae could be harvested, dried and burned for production of heat that could be converted into electricity by conventional methods. The biomass can be either used directly by burning or can be processed further to produce more convenient liquid or gaseous fuels.
Three different categories of bio-mass resources are as follows:
- Bio-mass in its traditional solid mass such as wood and agricultural wastes that are burnt directly to get energy.
- Bio-mass in its non-traditional form in which bio-mass is converted into ethanol and methanol that are used as liquid fuels in engines.
- Bio-mass in fermented form in which biomass is fermented anaerobically to obtain a gaseous fuel called biogas that contains 55 –65 per cent methane, 30 –40 per cent CO2 and rest as impurities such as H2, H2S and some N2.
Various resources of bio-mass are as follows:
- Concentrated waste –municipal solids, sewage wood products, industrial waste and manure of large lots.
- Dispersed waster residue –crop residue, legging residue and disposed manure.
- Harvested biomass, stand by bio-mass and bio-mass energy plantation.
Total solar radiation absorbed by plants is about 1.3 × 10²¹ J/yr and world's standing bio-mass has an energy content of about 1.5 × 10²² J.
4. Energy from oceans
A large amount of solar energy is collected and stored in oceans. The surface of water acts as a collector for solar heat, while the upper layer of the sea constitutes infinite heat storage reservoir. The heat contained in the oceans could be converted into electricity due to the temperature difference (20–25 K) between the warm surface water of the tropical oceans and the colder waters in the depths. This is the basic idea of OTEC systems. The surface water that is at higher temperature could be used to heat some low-boiling-point organic fluid, the vapours of which would run a heat engine. The amount of energy available from OTEC is enormous, and is replenished continuously.
Figure 1.5 shows an OTEC plant. In this plant, sea water acts as a heat source, working fluid, coolant and heat sink. The warm surface water at 27°C is used to boil a low-boiling-point liquid, the vapours of which run a turbine. The working fluid may be ammonia, propane or freon operating at a pressure of about 10 bar.

Fig. 1.5 An OTEC Plant
Disadvantages
- Efficiency is extremely low, and hence the system needs extremely large power plant heat exchangers and components.
- Even though there is no fuel cost, the capital cost is very high, and hence the unit power cost is higher.
- Involves developmental problems and uncertainties of market penetration.
5. Tidal energy
Due to universal gravitational effects of sun and moon on the earth tides in the sea are generated. Due to fluidity of water mass, there results periodic rise and fall of water level during the rising and setting of sun and moon. This periodic rise and fall of water level results in tidal power. When the water is above the mean sea level, it is called flood tide (high tide); and when the water is below the mean sea level, it is known as ebb tide (low tide). The energy dissipated with slowing down the rotation of the earth as a result of tidal action is about 1026 J/yr.
The tides are rhythmic but not constant. Their occurrence is due to a balance of forces, mainly gravitational force of the moon and sun to some extent, balancing the centrifugal force on water due to earth rotation. This results in rhythmic rise and fall of water. The moon rotates around the earth every 24 hr 50 min. During this period, tide rises and falls twice, resulting in a tidal cycle lasting for 12 hr 25 min. Thus, the tidal range R is given by the following relation;
R = water elevation at high tide − water elevation at low tide.
This range is maximum during new and full moons and is known as spring tide and neap tide.
To harness tides, a dam is built across the mouth of the bay with large gates and low head hydraulic reversible turbines (Figure 1.6). A tidal basin formed thus gets separated from the sea, by dam. There always exists a difference between the water levels on either side of the dam during low tide and high tide. Thus, the reversible water turbine runs continuously producing power by using the generator connected to it.

Fig. 1.6 A Tidal Energy Harnessing Plant
6. Wave energy conversion
Waves are caused by wind that in turn is caused by the uneven solar heating and subsequent cooling of the earth's crust and the rotation of the earth. When at its most active stage, wave energy produces more power than incident solar energy at its peak.
Total energy of waves is the sum of potential and kinetic energies. The potential energy arises from the elevation of the water above the mean sea level. The kinetic energy of the wave is that of the liquid between two vertical planes perpendicular to the direction of wave propagation x and placed one wavelength apart.
Figure 1.7 shows a typical wave energy conversion system. It consists of a square float that moves up and down with the water guided by four vertical manifolds. The platform is stabilized within the water by four large underwater floatation tanks supported by buoyancy forces that restrict the vertical or horizontal displacement of the platform due to wave action. Damping fins may be used so that the platform is stationary in space even in heavy seas.

Fig. 1.7 A Typical Wave Energy Conversion System
A piston attached to the float moves up and down the cylinder. The cylinder is attached to the platform, and hence is stationary. The piston–cylinder arrangement acts as a reciprocating air compressor. The downward motion of the piston draws air into the cylinder via an inlet check valve. The upward motion compresses the air and sends it through an outlet check valve to the four underwater floatation tanks via the four manifolds. The four floatation tanks serve the dual purpose of buoyancy and air storage, and the four vertical manifolds serve the dual purpose of manifolds and float guides. The compressed air in the buoyancy-storage tanks is in turn used to drive an air turbine that drives an electrical generator. The electric current is transmitted to the shore via an underground cable.
7. Geothermal energy
This is the energy that comes from within the earth's crust. In some locations of the earth, the steam and hot water comes naturally to the surface. For large-scale use, bore holes are normally sunk with depth up to 1,000 m releasing steam and water at temperatures 200–300°C and pressure up to 3,000 kN/m2. Two methods are generally used to generate power using geothermal energy.
Method I
In this method, the heat energy is transferred to a working fluid that operates the power cycle. It is found that molten interior mass of earth vents to the surface through fissures at temperatures ranging between 450 and 550°C.
Method II
In this method, the hot geothermal water and/or steam is used to operate the turbines directly. From the well head, steam is transmitted by using pipes of 1 m diameter over distances up to 3,000 m to the power plant. In this system, water separators are used to separate moisture and solid particles from steam.
The heat flux from the earth's interior through the surface is 9.5 × 10²⁰ J/yr. The total amount of heat stored in water or steam to a depth of 10 km is estimated to be 4 × 10²¹ J and that stored in the first 10 km of dry rock is around 1027 J. Figure 1.8 shows a typical geothermal field.

Fig. 1.8 A Typical Geothermal Field: F-fumaroles; E-fissures; H-Well; G-Hot springs
8. Hydrogen energy
Hydrogen as an energy is another alternative for conventional fuels. It can be easily produced from water that is available abundantly in nature. It has the highest energy content per unit of mass of any chemical fuel and is a better substitute for hydrocarbons, with increased combustion efficiency. It is non-polluting and can be used in fuel cells to produce both electricity and useful heat. However, it has technical problems such as production, storage and transportation.
9. Fuel cells
These are electrochemical devices that are used for the continuous conversion of the portion of the free energy change in a chemical reaction to electrical energy. It operates with continuous replenishment of the fuel, and the oxidant at active electrode area and does not require recharging.
Main components of a cell are (i) a fuel electrode, (ii) an oxidant or an air electrode, and (iii) an electrolyte. Some of the fuel cells used are hydrogen, oxygen (H2, O2), hydrazine (N2H4, O2), carbon/coal (C, O2) methane (CH4, O2), etc.
Figure 1.9 shows a typical hydrogen–oxygen cell popularly known as a hydrox cell. It consists of two porous or permeable electrodes made up of either carbon or nickel immersed in an electrolyte of KOH solution. Since the electrochemical reaction at the porous electrode where gas, electrolyte and electrode in contact are slow, a catalyst (finely divided platinum or platinum such as material) is embedded in the electrodes. The concentration of KOH solution is maintained at about 30–40 per cent, since it has higher thermal conductivity and less corrosive compared to acids.

Fig. 1.9 A Hydrox Cell
Working principle:
At the negative electrode, hydrogen gas is converted into hydrogen ions releasing free electrons.
H2 Catalyst → 2H + + 2e−(1)
Under the influence of the catalyst in the electrode, the hydrogen ions react with the hydroxyl ions in the electrolyte to form water:
2H+ + OH− → 2 H2O(2)
When the cell is operating, the free electrons from negative electrode flow through the external load towards the positive electrode. The electrons interact with oxygen and water in the electrolyte to form negatively charged hydroxyl ions:
O2 + H2O + 2e− → 2OH−(3)
The hydrogen and hydroxyl ions then combine to form water:
H+ + OH− → H2O(4)
A single hydrogen–oxygen cell can produce an electromagnetic force (emf) of 1.23 V at atmospheric pressure and at a temperature of 298 K. By combining the cells in series, it is possible to generate power ranging between a few kilo-watts to mega-watts.
Advantages
- Since power conversion is a direct process, the conversion efficiency is as high as 70 per cent.
- It is pollution free when operated using hydrogen and operates with minimum noise.
- It is compact in size and lighter in weight.
- Maintenance cost is less due to lesser mechanical components.
Disadvantages
- It involves higher initial cost.
- It has lower voltage.
- It has lower service life.
10. MHD generators
MHD generators are used for direct conversion of thermal energy into electrical energy (Figure 1.10). They work on Faraday principle. When an electric conductor moves across a magnetic field, a voltage is induced in it, which produces an electric current. In MHD generators, the solid conductors are replaced by a fluid that is electrically conducting. The working fluid may be either an ionized gas or liquid metal. The hot, partially ionized and compressed gas is expanded in a duct, and forced through a strong magnetic field, electrical potential is generated in the gas. Electrodes placed on the side of the duct pick-up potential generated in the gas. The direct current thus obtained can be converted into AC using an inverter.

Fig. 1.10 Principle of MHD Power Generation
The system is simple with large power and temperature-handling capacity without any moving parts. It is highly reliable and can be brought to full load within 45 sec. Power output can be changed from no load to full load in fraction of a second.
11. Thermionic converter
Figure 1.11 shows a thermionic convertor. It consists of two electrodes held in a container filled with ionized cesium vapour. Heating one electrode ‘boils out' electrons that travel to the opposite colder side electrode. The positive ions in the gas neutralize the space-charge effect of the electrons that normally prevent the flow of electrons. Ionized gas offsets space-charge effect that tends to repel migration of electrons.

Fig. 1.11 Thermionic Converter
Electrons that are emitted by heating cathode are migrated to cooler anode collector and flow through outer circuit to develop electric power. Low-work function materials such as barium and strontium oxides are used for anodes, whereas high-work function materials such as Tungsten impregnated with barium is used for cathodes.
12. Thermoelectric power
It is a device that converts heat directly into electric power. It eliminates the conversion of heat into kinetic energy of gas or steam flow. Its principle is based on Seebeck effect: If two dissimilar materials are joined to form a loop and the two junctions are maintained at different temperatures, an emf will be developed around the loop. The magnitude of the emf (E) developed by the above process is proportional to the temperature difference between the two junctions. Figure 1.12 shows a thermoelectric generator.

Fig. 1.12 Thermoelectric Generator
E α (T2 − T2) = α Th − Tc)
where Th = Temperature of hot junction; Tc = Temperature of cold junction; α = Seebeck coefficient.
The hot junction is maintained at a temperature Th by the applied heat source that may be small oil or gas burner, a nuclear reactor, or direct solar radiation by paraboloidal concentrator, and the cold junction is maintained at Tc by either water cooling or radiative heat transfer.
The amount of power generated in a country depends on the utilization of natural resources available in that country apart from its geographical location. Total power generated is usually contributed by power generated by hydel plant, thermal power plant and nuclear power plant. The amount of power available by a hydel plant entirely depends on natural sites available and on the hydrological cycle in the area concerned. Since the amount of the rainfall varies considerably over years, it is difficult to run a hydel plant without sufficient water source. Thus for variable load conditions, a hydraulic power plant is not reliable. This difficulty is overcome by installing a thermal power plant. The advantage of steam power plant is that human beings can create the site near a water resource and fuel resource. The steam power plant can be used as a base load plant along with a hydel or nuclear power plant.
1.2 FACTORS AFFECTING SELECTION OF SITE
Selecting a proper site for a thermal power plant is vital for its long-term efficiency. Many factors have to be considered, deciding suitable location of a plant. As it may not be possible to satisfy all requirements in one place, an ideal location should contain an optimum mix of the feasible requirements, for long-term economic justification of the plant. In this section, some major factors that need to be considered while selecting the site for major power plants are listed below.
1.2.1 The Factors to be Considered for Site Selection of Steam Power Plants
The factors to be considered for site selection of steam power plants are but not limited to, nearness to load centre, supply of water, availability of coal, availability of land at a reasonable price, transportation facilities, availability of labors and distance from populated area.
1. Availability of coal
As the power plant consumes large amount of coal, enough quantity must be available either in the vicinity, or it should be easily and economically viable to transport the coal to the power plant site. Proximity to sea route and rail transport are the major criteria.
2. Transportation facilities
A typical power plant with 1,000 MW capacity approximately consumes more than ten thousand tons of coal per day. Hence, the necessity for continuous supply and storage capability of coal in the power station by rail, by sea and by road must be ensured. It is also essential to have easy and enough access to transportation network during power plant construction and operation periods.
3. Availability of land
Ash is the main byproduct of combustion. Since the amount of coal used is large, proportionately, thousands of tons of ash is generated per day. Ash as it comes out hot from the boiler is hot and is very corrosive in nature. Disposing of such huge quantities of ash requires a large amount of empty space where it can be safely dumped.
In addition, enough space must be available for the storage of coal, disposal of ash, building of the power plant, township or residential colony of workers, markets, etc. Normally, for every MW of power generated, at least 3–4 acres of land available for this purpose.
4. Supply of water
Large amount of water is required for cooling and ash-handling systems in the power plant. Hence, it is essential to have water resources in the form of rivers, lake, sea, etc., are available nearby. During construction and operation stages also, different quantities of water are required. However, care should be taken to ensure that the site is at a reasonable distance from permanent and seasonal rivers and floodways.
5. Availability of labours
Apart from these, major requirements availability of skilled labour is also essential in the plant locality, as the semi- and unskilled labour requirements are very high. Proper transportation facility is very vital for the arrangement of labours.
6. Geology and soil type
The power plant should be built on a land that is not prone to vibrations generated by rotating equipments. Proper inspection and testing of soil and rock layers is essential. In addition, the site should be away enough from the faults and earthquake prone areas as weak and small earthquakes can damage many parts of a power plant intensively.
7. Distance from populated area
Location of the plant must be chosen in such a way that it has minimum or no ill impact on the surrounding environment. Plant location should be away from national parks, wildlife, protected areas, etc. As nearby forests, ecosystem, etc., are very sensitive to the pollutions caused by a power plant, ideal location should be away from them. Similarly, for the same reasons, the site should be away from population centres.
8. Nearness to load centre
In general, the site should be near to the load centres to avoid transmission and distribution losses, capacity to decrease the amount of power loss and transmission expenses. It should be near to the local electric grid.
9. Climatic conditions
As climatic conditions such as temperature, humidity, wind direction and speed affect the productivity of a power plant, proper study must be done before installing the major components such as chimneys and cooling towers.
1.2.2 Factors Affecting Selection of Site for Hydro-Electric Power Plant
In a hydraulic power plant, several structures such as dam, conduits, intakes, surge tank and power house are involved. To select a site several alternative layouts are to be studied and the most economical one is adopted. The scope for the site investigation depends partly on the availability of existing published data, partly on the nature and size of the proposed plants and partly on the difficulties preset by the existing topographical and geological features, which in turn affects the number of alternatives that have to be studied. Site investigations are carried out is two main stages.
- 1. Preliminary investigation –to provide sufficient information to find out the practicability of the proposed scheme and to choose between alternatives.
- 2. Final investigation –detailed exploration of recommended site to establish the suitability and to enable the final design.
Investigations include the following:
- Hydrological
- Topographical
- Geological
(i) Hydrological investigations
(a) Water availability
Run-off data at the proposed site must be available beforehand. If not available calculation are based on the rainfall data.
(b) Water storage
Necessity to store the water for continuous power generation as there is a wide variation in rainfall during the year. Storage capacity and minimum quantity of water available are calculated with the help of mass curve. Two types of storage in use are as follows:
- Storage for one year only with no carryover for the next season full at the beginning empty at the end of the year.
- (2) Enough storage sufficient even during worst dry periods.
(c) Water head
It depends on topography. Increase in head reduces water to be stored and therefore the capital cost.
(d) Ground water data
Stability of ground slopes, amount and type of grounding required to prevent leakage.
(ii) Topographical Investigation
Topographical features of the whole catchment area should be mapped either by ground surveying or aerial surveying methods (for larger area and difficult terrain).
(iii) Geological Investigation
To provide most accurate picture of the ground character of the site. Selection depends in the following factors:
- Light basin of ample size
- Narrow outlet requiring a dam of less volume
- Strong foundation to support dam structure
- Safe and ample spill way to dispose surplus water
- Water should not submerge valuable mineral and agricultural land
- Availability of material for constructing a dam
- Distance from load centre to reduce the cost of creation of transmission lines and their maintenance
- (h) Access to site by rail and road
(iv) Consideration of water pollution effects
Poor-quality water results in foul-smelling gases, corrosion of metallic structure and electrical equipment, overheating of machine parts. Water gets polluted by submerged vegetation mineral deposits, presence of algae. Leaves, twigs, logs under water decay and generate bad smelling gases. Thermal stratification and depletion of oxygen in lower strata generate harmful gases, such as CO2, H2S, CH4, pollute the water.
(v) Effects of water pollution
(a) Damage to dam structure and fitting
Water containing H2S, CO2 and CH2 is highly corrosive to dam structure. H2SO4 formed by oxidation of H2S attack the cement and disintegrate the concrete. These gases increase the solubility of soil and rocks. Structures, metallic piping and penstock are also affected by the gases.
(b) Damage of electrical machinery
Presence of corrosive gases such as H2S and SO2 affect the voltage drop at brush contacts in generator leading to poor commutation. Silver contacts of relays get blackened and lead to high contact resistance and failure of relay occurs. Copper bus bars corrode.
(c) Health hazard to operating personnel
Headache, dizziness, dryness, nose, throat, chest pain are the effects of H2S. High concentration of H2S may even cause paralysis.
(vi) Sedimentation effect
It reduces the capacity of reservoir and causes rapid erosion of turbine blades.
(vii) Environment aspects of site selection
These are compatible with the local environment site selection is to be made.
1.2.3 Factors Affecting Selection of Site for a Nuclear Power Plant
To locate a nuclear power plant geological, meteorological, hydrological topographical special transport, radiological investigations, are essential. Some of the major factors to be considered in locating a nuclear station are as follows:
- Availability of cooling water
- Transportation facilities
- Distance from load centre
- Safety
- Radioactive waste and disposal facility
- Foundation requirement
1.3 PRINCIPAL TYPES OF POWER PLANTS
The amount of power generated in a country depends on the utilization of natural resources available in that country apart from its geographical location. Total power generated is usually contributed by power generated by hydel plant, thermal power plant and nuclear power plant. The amount of power available by a hydel plant entirely depends on natural sites available and the hydrological cycle in the area concerned. Since the amount of the rainfall varies considerably over years, it is difficult to run a hydel plant without sufficient water source. Thus for variable load conditions, a hydraulic power plant is not reliable. This difficulty is overcome by installing a thermal power plant. The advantage of steam power plant is that human beings can create the site near a water resource and fuel resource. The steam power plant can be used as a base load plant along with a hydel or nuclear power plant. Figure 1.13 gives state-wise installed generating capacity of electricity in India.

Fig. 1.13 State Wise Installed Generating Capacity of Electricity in India
Based on the data available, principal types of power plants in India are thermal, hydro and nuclear. The detailed working principle of these plants is discussed separately in the subsequent chapters.
1.4 PRESENT STATUS AND FUTURE TRENDS
India has the fifth largest generation capacity in the world with an installed capacity of 236.38 GW as on year 20121, which is about 4 percent of global power generation. Captive power plants contribute to an additional power of 36.5 GW. Out of this, thermal power plants constitute 66 per cent of the installed capacity, hydroelectric about 19 per cent and rest being a combination of wind, small hydro-plants, biomass, waste-to-electricity plants and nuclear energy. India generated about 855 BU 1electricity during 2011–2012 fiscal. As of March 2012, the per capita total consumption in India was estimated to be 879 kWh, which is However, this is fairly low when compared to that of some of the developed and emerging nations such the United States (∼15,000 kWh) and China (∼1,800 kWh). Taking into account the renewable energy utilization, especially wind energy, India's electricity sector is one amongst the world's most active countries. As on March 20121, India had an installed capacity of about 24.9 GW of new and renewable technologies-based electricity. During the Eleventh Five-Year Plan, nearly 55,000 MW of new generation capacity was created, but with an overall energy deficit of 8.7 per cent and peak shortage of 9.0 per cent. Resources currently allocated to energy supply are not sufficient for narrowing the gap between energy needs and energy availability.
India's energy contribution comes from all the resources available including renewable. The dominance of coal in the energy mix is likely to continue further in future. At present, about 54 per cent of the total installed electricity generation capacity is coal based, and 67 per cent of the capacity planned to be added during the Eleventh Five-Year Plan period 2007–2012 is coal based. Out of this, over 70 per cent of the electricity generated is from coal-based power plants. Other renewable energy sources such as wind, geothermal, solar and hydroelectricity contribute only 2 per cent share of the Indian fuel mix, whereas 1 percent share is contributed by Nuclear power.
The future trend indicates that by 2021–20221, share of coal and petroleum is expected to be about 66.8 per cent in total commercial energy produced and about 56.9 per cent in total commercial energy supply. The demand for coal is projected to reach 980 MT during the Twelfth-Plan period, whereas domestic production is expected to touch 795 MT in the terminal year (2016–2017)1. Even though the demand gap can be bridged through imports, domestic coal production will also need to grow at an average rate of 8 per cent compared to about 4.6 per cent in the Eleventh Five-Year Plan. The share of crude oil in production and consumption is expected to be 6.7 per cent and 23 per cent, respectively, by 2021–20221.
In 2011–20121, India was the fourth largest consumer in the world of crude oil and natural gas, after the United States, China and Russia. India's energy demand continued to rise despite slowing global economy. Owing to increased vehicle ownership, petroleum demand in the transport sector is expected to grow rapidly in the coming years for which India must rely on imports for a considerable amount of its energy use, particularly for crude petroleum.
Combustible renewable energy sources and waste constitute about one-fourth1 of Indian energy use, which includes traditional biomass sources such as firewood and dung, used by more than 800 million Indian households for cooking.
To meet the future demand, the country needs quality or efficiency of the technology used in power generation. Energy exploration and exploitation, capacity additions1, clean energy alternatives, conservation, and energy sector reforms will be crucial for energy security. Energy conservation has also emerged as one of the major issues in recent years. Conservation and efficient utilization of energy resources could dramatically bridge the gap between demand and supply of energy. Hence, thrust on improving energy efficiency is one of the most desirable options for bridging the gap during the short run.
1.5 LAYOUT OF STEAM, HYDEL, DIESEL, NUCLEAR AND GAS TURBINE POWER PLANTS
In this section, layouts of all the major types of power-generating plants are briefly explained.
1.5.1 Layout of Steam Turbine Plant
Figure 1.14 shows a general layout of coal-fired thermal power station. The layout consists of four important systems. These are as follows:

Fig. 1.14 Coal-Fired Thermal Power Station Showing All Working Systems
- Coal- and ash-handling system
- Air and flue gas system
- Cooling water system
- Feed water and steam generation system
A steam power plant works on Rankine cycle. Steam generated in the boiler expands in the steam turbine. Low-pressure exhaust steam from the turbine is condensed in the condenser. The condensate is fed back to the boiler along with feed water.
A thermal power plant mainly uses hot products of combustion known as flue gas to generate steam in a steam generator. Heat is generated by burning coal, oil or gas. For this purpose, boiler furnace is designed for firing coal, air or gas.
High-pressure steam generated in the steam boiler is passed through steam turbine where steam expands in the nozzles. Heat energy of steam is converted into mechanical energy. Mechanical energy is utilized to run the generator, and hence to generate electric power. The low-pressure steam after expanding in the turbine enters the condenser. Here, steam condenses by rejecting heat to the cooling water. The condensed steam is supplied back to the boiler using condensate extraction pump. The overall efficiency of the plant is increased by using economizer, air preheater, super heater and feed water heaters.
A brief explanation of different flow paths of a power plant is given below.
1. Coal- and ash-handling system
In this system, coal from the coal yard is crushed to the required size in coal crusher. The crushed coal is supplied to the coal bunker in the boiler house. This coal is fed to the furnace through coal hoppers where it is burnt. The products of combustion, namely ash and un-burnt coal, are disposed to the ash storage site.
2. Air and flue gas system
In this system, air from the air heater is supplied to the boiler furnace using forced draught fan. The products of combustion in the form of flue gases are circulated in the furnace to heat the water in the tubes. The heat in the exhaust flue gases is utilized by passing it first over economizer tubes and then over air preheater tubes. After extracting maximum possible heat, the flue gases are discharged through the chimney using an induced draught fan.
3. Cooling water system
This system mainly consists of a condenser, condensate extraction pump, cooling tower and cooling water circulation pump. When plenty of water is not available, a cooling tower is preferred. Water pumped from the water clarifier plant is circulated through the condenser tubes in order to condense the exhaust steam coming from the turbine. Water leaving the condenser is discharged to the downward side of the river. Such a system is known as open system that is very useful when abundant water supply is available. When there is scarcity of water, a cooling tower is installed. This system is also known as a closed system. In this system, the condensate water is cooled by passing it through the cooling tower. The cold water is pumped to the hot well. The loss of water due to evaporation is compensated by supplying water directly from the river.
4. Feed water and steam generation system
This system mainly consists of feed water pump, steam generator, condenser and hot well. Feed water from the hot well is supplied to the steam generator by using the feed pump. Steam generated in the boiler is superheated in super heater tubes. Superheated steam is supplied to the prime mover to develop power. The steam exhausted in the prime mover is condensed in the condenser. Any water that is lost in the system is compensated by supplying feed water from an external source. Such feed water should be treated in a feed water treatment plant before sending it to the hot well.
1.5.2 Layout of Hydro-Electric Plant
Water is a great source of energy as it is available in abundance and is quite cheap. The potential energy of water at high levels is utilized for the generation of electrical energy. The generating stations that obtain energy from water are called hydro-electric power stations.
The general layout of the plant is decided by the type of the hydraulic plant. In the case of vertical turbines, the most convenient and economical layout will be placing turbines in a line parallel to the length of the turbine house. The spacing between the machines is determined by the size of the scroll case, width of the fume or by the overall diameter of the alternators. If the machines are horizontal, the most suitable layout will be arranging the turbines at right angles to the length of the turbine house or even can replaced parallel to the longitudinal axis of the turbine house. A repair bay should be provided at one end of the turbine house close to the workshop and sufficient space should also be provided for the dismantling and re-erection of machines. Figure 1.15 shows a typical layout of a water plant with vertical machines.

Fig. 1.15 Layout of Hydro-Electric Plant
1.5.3 Plant Layout of Diesel Engine Plant
The layouts of diesel power plants for high capacity (50 MW and above) is shown in Figure 1.16. Generally, in all three cases, the generating units are installed parallel with parallel centre lines. Sufficient space must be provided around various units for dismantling and repairing purposes. Fuel storage tanks may be located outside the building to avoid fire hazards. Some space should be left for future expansion. The engine room should be provided with sufficient ventilation. The plant must include a number of instruments for the guidance of operators to ensure reliability, economy and safety.

Fig. 1.16 Layout of Diesel Power Plant for High Capacity (50 MW and Above)
1.5.4 Layout of a Nuclear Plant
Figure 1.17 shows the layout of a typical nuclear power plant, where 1 indicates the reactor building, 2 the group 1 service building, 3 the group 2 service building, 4 the reactor auxiliary building, 5 the maintenance building, 6 the turbine building, 7 the administration building, 8 the pump house and 9 the group 2 pump house.

Fig. 1.17 Layout of a Nuclear Plant
A typical layout of a nuclear power station – is shown in Figure 1.18.

Fig. 1.18 A Typical Layout of a Nuclear Power Station
1.5.5 Layout of Gas Turbine Plant
Figure 1.19 shows typical layout of a gas turbine plant. The air filler is used to clean the air. The air leaving the air filler flows to the LP compressor. The compressed air then flows through the inter-cooler and then it enters the high-pressure compressor. The air leaving the air compressor flows through the heat exchanger and the hot air flows to the combustion chamber. Products of combustion then enter in to low-pressure turbine, where it expands doing useful work.

Fig. 1.19 Layout of a Gas Turbine Plant
1.6 COMBINED POWER CYCLES – COMPARISON AND SELECTION
Simple cycle gas turbine (GTs) plants using natural gas and fuel oil operate at around 33 per cent and 25 per cent efficiency, respectively, major part of the heat being wasted as thermal energy in the hot exhaust gases. Combining of multiple thermodynamic cycles to generate power, overall plant efficiency can be increased up to 60 per cent by using a heat recovery steam generator (HRSG). The HSRG captures heat from high-temperature exhaust gases to generate steam, which is then supplied to a steam turbine to generate additional electric power. The cycle working under this principle is known as combined cycle. In most of the instance, a combined cycle power plant utilizes gas turbines in conjunction with a steam turbine and is called a combined cycle gas turbine (CCGT) plant. Different configurations of CCGT power plants are in use where each GT has its own associated HRSG, and multiple HRSGs supplying steam to one or more steam turbines. For example, in a plant with a 3 × 1 configuration, three GT/HRSG trains supply to one steam turbine. Similarly there can be 1 × 1, 2 × 1, or 4 × 1 arrangements also. The steam turbine capacity is decided to match the number and capacity of supplying GTs/HRSGs. This type of power plants is being installed in increasing numbers round the world where there is access to substantial quantities of natural gas.
Combined cycle principles of operation
The HRSG is basically a heat exchanger popularly known as a boiler, or comprises a series of heat exchangers. It generates steam for the steam turbine exchanging heat from the hot exhaust gas flow from a gas turbine through heat exchanger tube banks. The tubes are arranged in sections, or modules also known as economizers, evaporators, superheater/reheater and preheaters. The fluid circulation in HRSG could be either natural or forced circulation using pumps. Saturated steam from the steam drums or once-through system is passed through superheater or reheater tubes to superheat the steam. The superheated steam produced by the HRSG is supplied to the steam turbine where it expands through the turbine blades, imparting rotation to the turbine shaft. The energy delivered to the generator coupled to the drive shaft is converted into electricity. After exiting the steam turbine, the steam condenses in a condenser and fed back to the HRSG. Figure 1.20 shows a schematic diagram of a combined cycle gas turbine plant.

Fig. 1.20 Combined Cycle Power Plant
1.7 MERITS OF STEAM, GAS, DIESEL, HYDRO AND NUCLEAR POWER PLANTS
In this section, merits, de-merits and relative merits of steam, gas, diesel, hydro and nuclear power plants are briefly discussed.
1.7.1 Advantages and Disadvantages of the Gas Turbine Plant
Advantages over diesel plants
- Due to perfect balancing of gas turbine unit, the gas turbine plants are subjected to fewer vibrations.
- The mechanical efficiency of gas turbine plant is as high as 95 per cent, whereas the mechanical efficiency of diesel plant is less.
- The torque characteristics of turbine plants are far better than diesel plants as it is a continuous power developing system.
- The work developed per kilogram of air is large compared with diesel plant as the expansion of gases to atmospheric pressure is possible.
- The weight of gas turbine plant is hardly 0.15 kg/HP, whereas the weight of diesel plant is 2.5 kg/HP. Therefore, the space required and capital cost of the gas turbine plant is considerably less than diesel plant.
- All the parts of gas turbine (compressor, combustion chamber and turbine) can be designed and tested individually, and they can be arranged as per requirements as the compression, combustion and expansion take place in different units.
- The running speed of the turbine (4,000–100,000 rpm) is considerably large compared with diesel engine (1,000–2,000 rpm).
- The lubrication and ignition systems are more simplified compared with diesel plant.
- The specific fuel consumption does not increase with time in gas turbine plant as rapidly as in diesel plants.
- The installation and maintenance costs are less than diesel plants.
- The exhaust of gas turbine is free from smoke as the quantity of air supplied is four times greater than theoretically required for complete combustion.
Smokeless combustion has been achieved by the gas turbine with proper control of primary zone mixture ratios and methods of secondary air introduction and recirculation could produce reduced pollution conditions. It is claimed that the exhaust gases coming out are smokeless without increasing the production of nitric oxide emissions.
- (xii) Any poor-quality fuels can be used in gas turbine plant, whereas special-grade fuels are required for diesel engines to avoid knocking. This is a great advantage of gas turbine plant.
The disadvantages of gas turbine plants over diesel plants can be summarized as easier maintenance, improved reliability, lower initial cost, smaller plant dimensions and less space requirements for same output, less vibrations, absence of cyclic variations and greater starting torque.
The disadvantages of gas turbine plants over diesel power plants include poor part load efficiency, requirement of special metals and alloys for different components of the plants, special cooling methods for cooling the turbine blades, low starting torque and less life.
Advantages over steam power plant
- The handling of ash is major problem in steam plants that are completely eliminated in open-cycle gas turbine plants using gas or liquid as fuel.
- The cubic capacity of the buildings required for gas turbine plant is about 50 per cent of steam plant. The total weight of the materials required for gas turbine plant is also 50–60 per cent of steam plant. Therefore, considerable saving in capital cost is possible having same efficiency as steam plant. The gas turbine plants can be installed at selected load centers as space requirement is considerably less where steam plant could not be accommodated.
- The site of the steam power plant is dictated by the availability of large cooling water, whereas an open-cycle gas turbine plant can be located near load centers as no cooling water is required. The cooling water required for closed cycle gas turbine plant is hardly 10 per cent of the steam plant.
- The comparison of thermal efficiency is shown in figure below. It is obvious from the figure that the gas turbine plant should be operated above 550°C to compete with the steam plants. Above 375°C, the gap between the steam cycle and gas turbine cycle efficiency widens. Above 550°C, the efficiency of the gas turbine plant increases three times as fast as the steam cycle efficiency for a given temperature increase.

- The ratio of exhaust to inlet volume for the same pressure and initial temperature conditions would be only 3.95 in case of gas turbine plant as against 250 for steam plant.
- Steam plant developing power at 17 per cent efficiency costs equal to the gas turbine plant developing power at 34 per cent. This being the case, the gas turbine plant as a base load plant has little future. This is economical as base load plant only where the fuel oil is available at a considerably cheaper rate.
- The gas turbine plant uses fewer auxiliaries than the steam turbine plant; therefore, small size of the gas turbine components enables complete work-tested units to be transported to the site.
- The ease and rapidity with which the output of gas turbine plants can be made available from a cold start permit a reduction in the capacity of steam plant held in reserve in a hot condition and needed to cover for short-load prediction errors and random load fluctuations. The gas turbine plants peak-up the load hardly within 15 min. This loading response can be put to good effect in the event of an unscheduled disconnection of a large generator.
- The gas turbine plants are always desirable as peak-load plants, irrespective of the cost due to their good response, but its adoption as base load is justified on the economic ground. It can be used as a base load plant only where the gas turbine fuel costs are considerably less.
- In general, gas turbines can be built relatively quicker and require much less space and civil engineering works and water supplies.
- The components and circuits of a gas turbine plant can be arranged to give the most economic results in any given circumstances that are not possible in the case of steam power plants.
- The gas turbine becomes more economical for operating conditions below a given load factor as saving on the capital charges outweighs the additional cost of fuel.
- The gas turbine plant as peak-load plant is more preferable as it can be brought on load quickly and surely. The fuel consumption is of secondary importance, since the time of operation is limited.
Advantage and disadvantages of gas turbine plant
Advantages
- It is smaller in size and weight compared to an equivalent steam power plant. For large capacities, it is smaller in size than a comparable diesel engine plant. Hence, it is most suitable where size and weight are the main considerations, namely in ships, aircraft engines, locomotives, etc.
- It has low initial cost and low operating costs compared to steam power plant of same capacity.
- It is available at relatively short delivery times and is quick to install and put to use.
- It is quick starting and smooth running.
- It offers flexibility in supplying process needs such as compressed air in addition to electric power and in using a range of liquid and gaseous fuels and even low-calorific-value fuels.
- Water requirement is less compared to a condensing steam power plant.
- No stand by losses as in a steam power plant in which boilers are operated even when turbine in not loaded.
- Easy to lubricate the compressor, turbine bearings and maintenance cost in less.
- Plant does not require heavy foundations and building and subject to fewer environmental restrictions.
- Due to higher operating temperature, thermal efficiency is more.
Disadvantages
- Overall cycle efficiency is less as a portion of power generated by the turbine is consumed by the compressors.
- The plant is incompatible with solid fuels.
- It is costlier due to the use of high heat-resistant materials and sophisticated manufacturing processes for blade manufacture.
- It runs at comparatively higher speeds, and hence requires a reduction gear for normal industrial applications.
1.7.2 Advantages and Disadvantages of the Nuclear Plant
Advantages of nuclear power plant
- Less space requirement
- Consumes very small quantity of fuel
- Involves less fuel transportation cost
- Does not require large fuel-storage facility
- Reliable in operation
- Not effected by weather conditions
Disadvantages
- High initial cost, maintenance cost
- Not suited for varying load condition
- Radioactive wastes should be disposed carefully
- Requires trained operators
1.7.3 Advantages and Disadvantages of Diesel Plants
Advantages and disadvantages of diesel plants are as follows:
- It has no standby losses and can burn fairly wide range of fuels.
- Manufacturing periods are short; therefore, plant expansion can be done just by adding the generating units of required size.
- Diesel plants can be fully automated with reasonably low capital costs, namely for starting, synchronizing and shutting down diesel sets, to overcome scarcity of skilled labour.
- Maintenance can be simplified by the provision of easily replaceable assemblies of parts, thus enabling reconditioning to be undertaken away from generating plants.
- Can be installed in remote, cramped or difficult to access areas as the unit is compact, light weight, available in smaller capacity.
- The diesel plants can be located very near to the load centers, many times in the heart of the town.
- They can be used in all climatic zones, and they are very adaptable and can be easily extended to the given power requirements.
- Machine sets are readily available as standard sets in the range of 500–40 MW.
- Due to its relatively low cost, it is possible to install a spare unit which can be kept as permanent standby.
- Operational reliability with high availability is ensured.
Disadvantages
- The diesel plants are not economical where fuel has to be imported.
- The noise is a serious problem in diesel plant.
- Selected types of fuels are required in diesel engines, whereas there is more mobility in case of thermal plant.
- The lubrication cost is high.
Diesel plants vs. Steam power plants
- The diesel power plants are more efficient than steam power plants in the range of 150 MW capacity. The operating efficiency is high in the load range of 50–100 per cent of full load.
- The first cost diesel plants are lesser than steam plants for plant capacity up to about 7 kW. Above this capacity, the diesel cost rises rapidly while that of steam plants continues to fall.
- It can be quickly started up and brought into service (within 1 min).
- The cooling water required for the same capacity is considerably less in diesel plants than the thermal plant. The site of the thermal plant is dictated by the availability of cooling water in many cases, whereas diesel plant can be located without giving much importance to the availability of cooling water. The water ratio for thermal to diesel is approximately 50:1.
- The storage required for the fuel is considerably less than the thermal and it can be handled more easily.
- There is no problem of ash handling as there is practically no refuse.
- The space required for diesel plant is considerably less than thermal plant, and therefore the cost of foundation and buildings is less.
- A diesel engine lubrication system is more economical compared to a steam plant and permits the use of specially compounded cylinder lubricants that provide dramatic improvement in wear rates.
- A Diesel engine plant layout is very simple compared with a thermal plant. They are easy to operate and control also.
- The unit capacity of diesel engine is considerably smaller than the thermal unit. The cost of unit increases with an increase in unit capacity for diesel plant. However, the cost of the unit goes on decreasing in case of thermal plant with an increase in unit capacity.
- The repair and maintenance costs of diesel plants are generally much higher than for steam plants. These costs are more or less fixed in case of steam plants and more or less are proportional to output in the case of diesel plants.
- Life of 25–30 years is normal for thermal plant, whereas the life of diesel plant is hardly 2–5 years or less.
- The diesel plants are not suitable for continuous operation under overloads, whereas steam plants can work under 25 per cent overload continuously.
1.7.4 Advantages of Hydro-Electric Power Plants
Advantages
The hydroelectric power plants are the best from many viewpoints. These are simple in design, easy for maintenance, pollution free with zero fuelling cost. Hydro-generation has a unique and significant role to play particularly in the operation of interconnected power system. In fact, thermal or nuclear power can seldom produce electrical energy economically without an adequate proportion of hydro power generation. Some of the advantages of hydroelectric power plants are mentioned below:
- The operating cost of the hydro-electric plant including auxiliaries is considerably low when compared with thermal plants. The annual operating and maintenance cost of a thermal plant is approximately five to six times that of hydro-plant of equal capacity.
- Cost of power generation is less. The cost of each unit of electrical energy delivered from a thermal power plant is very adversely affected by the reduction of load factor at which the plant is operated. The cost per kilo-watt generated by a thermal plant designed for 80 per cent load factor would go up by 20 per cent if operated at 60 per cent load factor, and by 65 per cent if operated at 40 per cent load factor. The cost of generation by hydro-electric plant is more or less unaffected by the load factor.
- Life expectancy of a hydro-electric power plant is more. The useful life of a thermal plant is 20–25 years as against 100–125 years for hydro-plant.
- There is no problem of handling the fuel and ash and no nuisance of smoke exhaust gases and soots, and there are no health hazards due to air pollution.
- The fuel needed for the thermal plants has to be purchased; whereas in hydro-plant, the fuel cost is totally absent. The security of thermal power plant is mostly dependent on transport facilities, and its security is less when the fuel is imported from outside countries.
- Hydro-electric plants are quick to respond to the change of load compared with thermal or nuclear plant. Full output can be reached in about 10–15 sec. Therefore, they are ideally suited for peaking purposes. The rapid fluctuating loads are served most economically by hydro-plants.
- The machines used in hydel plants are more robust and generally run at low speeds at 300–400 rpm, whereas the machines used in thermal plants run at a speed 3,000–4,000 rpm. Therefore, there are no specialized mechanical problems or special alloys required for construction. There are no complications due to high temperature and pressures. Therefore, the outages of the machines are very few.
- Flexible and economical in operation. Hydel power plays a major role not only providing an economic source of energy but also in improving the operation of the combined power system by meeting the system load at various times and providing regulating functions.
- The efficiency of hydro-plant does not change with age, but there is considerable reduction in efficiency of thermal as well as nuclear power plant with age.
- In a hydroelectric plant, there is no stand-by losses, whereas these are unavoidable for thermal plants, and the number of operations required is considerably small compared with thermal power plants.
- It does not contribute to air and water pollution to greenhouse effect.
- (xii) Usually, the hydro-stations are situated away from the developed areas, therefore the cost of land is not a major problem.
Disadvantages
- The capital cost (cost per kilo-watt capacity installed) of the hydro-plant is considerably more than thermal plant.
- It takes considerably long time for its erection compared with thermal plants.
- Power generation by the hydro-plant is only dependent on the quantity of water available, which in turn depends on the natural phenomenon of rain. The dry year is more serious for the hydroelectric project.
- The site of hydro-electric station is selected on the criterion of water availability at economical head. Such sites are usually away from load centers. The transmission of power from power station to the load centre requires long transmission lines. Therefore, investment required for long transmission lines and loss of power during transmission is unfavorable factors for the economical selection of hydro-plants.
1.8 RESOURCES AND DEVELOPMENT OF POWER IN INDIA
1.8.1 Coal and Lignite
In India, coal deposits are mainly confined to eastern and south central parts of the country. The states of Jharkhand, Odisha, Chhattisgarh, West Bengal, Andhra Pradesh, Maharashtra and Madhya Pradesh account for more than 99 per cent of the total coal reserves in the country. As on 31 March 12, the estimated reserves of coal was around 293.5 billion tons, as against the total estimated reserve of coal of around 285.86 billion tons as on 31 March 11 (Figure 1.21; Figure 1.22).

Fig. 1.21 Estimated Reserve of Coal in India as on 31 March 2012

Fig. 1.22 State-Wise Estimated Reserve of Coal (in Billion Tonnes) in India as on 31 March 2011 and 31 March 2012
The above figure shows the state wise estimated reserve of coal in billion tonnes (proved) in India as on 31 March 2011 and 31 March 2012 as per the information available from Office of Coal Controller, Ministry of Coal, Government of India from major coal mines across different states of India.
The estimated reserve of lignite as on 31 March 2012 was 41.96 billion tonnes against 40.91 billion tonnes as on 31 March 2011.
According to another estimate from Ministry of Coal, Government of India, proved estimate of lignite coal amounting to 14.73 billion tonnes (as on 31 March 2012) and an indicated estimate of another 61.4 billion tonnes was available. The following bar chart provides the proved lignite reserve in India from some of the major mines across different states (Reserve in Billion tonnes).
The estimated reserve of lignite as on 31 March 12 was 41.96 billion tonnes against 40.91 billion tonnes as on 31 March 11 (Figure 1.23).

Fig. 1.23 State-Wise Estimated Reserve of Lignite Coal (in Billion Tonnes) in India as on 31 March 2011 and 31 March 2012
The increase in the estimated reserve of lignite during the year 2011–2012 was 1.22 per cent, Tamil Nadu accounting for the maximum increase of 2.99 per cent.
1.9 PETROLEUM AND NATURAL GAS
The estimated reserves of crude oil in India as on 31 March 2012 stood at 759.59 million tonnes (MT) (see Table 1.2; Figure 1.24).
Table 1.2 State-Wise Estimated Reserve of Crude Oil and Natural Gas in India as on 31 March 2011 and 31 March 2012

1 Includes JVC/Pvt parties for crude oil includes West Bengal for natural gas.
2 Includes Bombay High offshore. Rajasthan and JVC for crude oil and Bombay High offshore. Rajasthan and Madhya Pradesh (coal bed methane or CBM) for natural gas.
Notes: @ Proved and indicated balance recoverable reserves.
Source: Ministry of Petroleum and Natural Gas.

Fig. 1.24 Estimated Reserve of Crude Oil in India as on 31 March 2012
Geographical distribution of crude oil indicates that the maximum reserves are in the Western offshore (44.46%) followed by Assam (22.71%), whereas the maximum reserves of natural gas are in the Eastern offshore (34.73%) followed by Western offshore (31.62%). There was an increase of 0.29 per cent in the estimated reserve of crude oil for the country as a whole during 2011–2012. There was an increase of estimated crude oil reserves by 7.09 per cent in Andhra Pradesh followed by Tamil Nadu (4.48%). The estimated reserves of natural gas in India as on 31 March 2012 reached at 1330.26 billion cubic metres (BCM) (see Figure 1.25; Table 1.3), as per the open source information available on Ministry of Petroleum and Natural Gas website, the state wise estimated reserve of natural gas in India as on 31 March 2012, is depicted in the following bar chart. The figures indicate billion cubic meters of gas.

Fig. 1.25 Estimated Reserve of Natural Gas in India as on 31 March 2012
Table 1.3 Source-Wise and State-Wise Estimated Potential of Renewable Power in India as Reserve of Crude Oil and Natural Gas in India as on 31 March 2012

Notes: *Industrial waste.
Source: Ministry of New and Renewable Energy, Government of India.
1.10 PRESENT STATUS OF POWER GENERATION IN INDIA
According to the available information from central electricity authority (see Figure 1.26), all India gross electricity generation from utilities, excluding that from the captive generating plants, was 55,828 gigawatt-hours (GWh) during 1970–1971. It rose to 9, 23,203 GWh during the year 2011–2012. The production of electricity from utilities has increased from 8, 44,846 GWh during 2010–2011 to 9, 23,203 GWh during 2011–2012, registering an annual growth rate of about 9.27 per cent. From the table abstract taken by CEA, it is clear that out of the total electricity generation in the country, from utilities and non-utilities taken together (10, 51,375 GWh for the year 2011–2012), 7, 59,407 GWh was generated from thermal (72.2%), 1, 30,510 GWh (12.4%) was from hydro and 33,286 GWh (3.16%) was generated from nuclear sources.

Fig. 1.26 All India Gross Electricity Generation from Utilities (Numbers Indicate Giga Watt Hour)
1.11 ROLE OF PRIVATE AND GOVERNMENT ORGANIZATION
Just after independence, India had a power-generating capacity of 1,362 MW, and generation and distribution of electrical power was carried out by private utility companies. Power availability was only in a few urban centers, whereas rural areas and villages did not have electricity.
Subsequently post independence, all new power generation, transmission and distribution in the rural sector and the urban centers, not coming under the purview of private utilities came under state and central government agencies. State electricity boards (SEBs) were formed in all the states, thereafter.
National Thermal Power Corporation (NTPC), National Hydro-electric Power Corporation (NHPC) and Power Grid Corporation Limited (PGCL) were constituted by the government to assist in meeting the increasing demand for electricity throughout the country. In India, both state and central governments participate in the power sector's development. The Ministry of Power in the central government formulates the policies for the power sector and the Central Electricity Authority (CEA) also functions as a regulatory authority. As per government guidelines, all power projects above a certain capacity have to obtain techno-economic clearance from CEA before they can be implemented. Apart from this, Ministry of Non-Conventional Energy Sources focuses on renewable energy sources to augment the generation capacity of electrical power.
The liberalized government policy announced in 1991 and consequent amendments in Electricity (Supply) Act have opened doors to private sectors to investment in electricity industry. Considerable emphasis has been given to attract private investment and the major policy changes have been announced by the government in this regard1
- The Electricity (Supply) Act, 1948, amended in 1991, provides for creation of private generating companies to set up power generating facilities and selling the power in bulk to the grid or other persons.
- Financial environment for private sector units was modified to allow liberal capital structuring and an attractive return on investment. Up to hundred percent (100%) foreign equity participation can be permitted for projects set up by foreign private investors in the Indian Electricity Sector1.
- Administrative and legal environment simplifies the procedures for clearances of the projects.
- Policy guidelines for private sector participation in the renovation and modernization of power plants issued in 1995.
Present scenario
At present in power sector nearly half that is, 49.15 per cent is under SEBs, which is followed by public sector units, such as NTPC, NHPC, and NPCIL, etc. The role of private sector is about 19.85 per cent, the least among the three sectors. However, of late, private sector is growing at a greater pace than the other two sectors.
The major companies in these three sectors are listed below:
Public sector units in power sector
Major players of energy in public sector are listed below:
- Power Finance Corporation
- Central Electricity Regulatory Commission
- Damodar Valley Corporation
- Neyveli Lignite Corporation Limited
- Nuclear Power Corporation of India Limited
- NHPC Limited
- (vii) NTPC Limited
Private company in power sector
The following companies play a major role in private sector:
- Adani Power
- Tata Power Company Ltd.
- Suzlon
- Reliance Power Limited
- JSW Energy
State electricity board in power sector
In addition to the above, the following list provides the names of the companies in state sector:
- Assam Electricity Board
- Arunachal Pradesh Electricity Board
- Andhra Pradesh Electricity Board
- Chhattisgarh Electricity Board
- Delhi Electricity Board
- Goa Electricity Board
- Gujarat Electricity Board
- Haryana Electricity Board
- Himachal Pradesh Electricity Board
- Jammu & Kashmir Electricity Board
- Jharkhand State Electricity Board
- Karnataka State Electricity Board
- (xiii) Kerala State Electricity Board
- (xiv) Madhya Pradesh Electricity Board
- (xv) Orissa Electricity Board
- (xvi) Punjab State Electricity Board
- (xvii) Rajasthan Electricity Board
- (xviii) Tamil Nadu Electricity Board
- (xix) UP Electricity Board
- (xx) Uttarakhand Electricity Board
- (xxi) West Bengal State Electricity Board
1.12 STATE-LEVEL SCENARIO, LOAD SHEDDING
The following chart (Figure 12.7) shows the state wise renewable energy production in MW.

(a)

(b)

(c)
Fig. 1.27 (a) Bio-mass, (b) Waste to Energy, (c) Wind Power
1.13 CARBON CREDITS
In 1992, several countries came together to create United Nations Framework Convention on Climate Change (UNFCCC). This compelled the countries to work together to limit emissions of greenhouse gases that cause an increase in global temperature and climate change, and to deal with the resulting impacts.
In 1995, UNFCCC adopted the Kyoto Protocol held in Kyoto, Japan. The protocol has a legally binding emission reduction mechanism for a specific period that was to be respected by the developed countries. The period of first commitment ran from 2008 to 2012. The duration of second period began on 1 January 2013, which will end in 2020. A total of 195 nations across the globe (parties) participated in the UNFCCC and 191 nations (parties) ratified the Kyoto Protocol. In 2010, nations (parties) agreed to limit the global temperature increase to below 2°C. To reduce current or future emissions of greenhouse gases, organizations in these countries are free to engage in various environment-friendly activities or ‘methodologies' (voluntary or non-voluntary).
Based on the Kyoto Protocol, an authority such as government department decides the cap or quota of pollution that a group or organization can cause. Groups and organizations that pollute below this quota are eligible to sell their balance quota as carbon credits certificates (or just credit) to another organization that has already gone or could go beyond the assigned cap. Under the Kyoto Protocol, the caps are issued by National registry as ‘assigned amounts' or ‘Kyoto units'. Companies can choose to donate their allowance to a non-profit group, while availing tax deductions. Transfers and acquisitions of these units are tracked and recorded through the ‘registry systems'. An ‘international transaction log' based in Bonn, Germany, verifies and ensures secure transfer of emission reduction units between countries keeping the rules in mind.
United Nation's Kyoto Protocol created by the United Nations set limits in the form of caps/quota for parties. With it, the United Nations also introduced a ‘carbon market' governed by three mechanisms to assist organizations reach the emission reduction targets.
As per the United Nations, ‘The Kyoto mechanisms:
- Stimulate sustainable development through technology transfer and investment.
- Help countries with Kyoto commitments to meet their targets by reducing emissions or removing carbon from the atmosphere in other countries in a cost-effective way.
- Encourage the private sector and developing countries to contribute to emission reduction efforts.'
The three mechanisms by UN's Kyoto protocol:
(i) IET or International Emissions Trading
Under the Kyoto Protocol, Article 17, countries have accepted to reduce the emissions to meet the targets committed to UN. These targets refer to allowed emissions or assigned emissions. The allowed emissions are further broken into ‘assigned amounts units (AAUs).' Countries those are able to save units assigned to them can sell them to countries that are over their assigned targets. IET created a new trading platform called, carbon market.
Another unit that may be transferred under the scheme, each equal to one ton of CO2 is a Removal Unit (RMU), Article 3.3, 3.4, which is based on the land use, land-use change and forestry (LULUCF) activities such as reforestation. RMUs are issued by national registry.
(ii) JI or Joint Implementation
Developed countries working with developed countries are allowed to earn Emission Reduction Units (ERU). Under the Kyoto Protocol, Article 6, a developed country that is committed to reduce or limit its greenhouse gases' emissions can implement or run or sponsor projects or activities that are environment friendly, in a developed country. This allows for technology transfers and foreign investments. It also enables both the parties to earn carbon credits.
(iii) CDM or clean development mechanism –Developed countries working with developing countries can earn certified emission reductions (CER) equaling a reduction of one ton of carbon dioxide equivalent. CERs are issued by CDM registry.
Under the Kyoto Protocol, Article 12, a developed country that has committed to reduce or limit its greenhouse gases' emissions can implement or run or sponsor projects or activities that are environment friendly, in a developing country, enabling for technology transfers and foreign investments. Thus, the organizations in developed countries to earn CER credits and meet the caps or quota set under Kyoto Protocol. If an organization is able to earn more CER credits than it requires, it can even sell them to other groups.
Developing countries do not have restrictions to emit gases because such countries go through the same phase of development as developed countries went through years ago. But by participating in the CDM project, they assist in controlling the damage already done by the developed nations.
Reserves of ERUs, CERs, AAUs and/or RMUs have to be maintained in the national registries of respective countries to ensure that parties do not ‘oversell' units.
Eligibility requirements for participating in carbon credit trading
UN offers accreditation to environment-friendly projects that deliver more than what is expected of them under normal working conditions. There is a mechanism to calculate the difference between emission reductions that would have occurred under normal circumstances and additional reduction in emissions due to special efforts.
According to the United Nations:
‘To participate in the mechanisms, Annex I Parties must meet, among others, the following eligibility requirements:
- They must have ratified the Kyoto Protocol.
- They must have calculated their assigned amount in terms of tons of CO2-equivalent emissions.
- They must have in place a national system for estimating emissions and removals of greenhouse gases within their territory.
- They must have in place a national registry to record and track the creation and movement of ERUs, CERs, AAUs and RMUs and must annually report such information to the secretariat.
- They must annually report information on emissions and removals to the secretariat.’
The exception to the eligibility is nuclear-powered energy and cancelling or stopping a deforestation project.
India being a developing country has no emission targets to be followed but can enter into CDM projects. India has generated approximately 30 million carbon credits and approximately 140 million in run, the second highest transacted volumes in the world. India's carbon market is growing faster than even information technology, bio technology and BPO sectors as 850 projects with a huge investment of Rs 650,000 million are in pipeline. As per the Prime Minister's Council on Climate Change, the revenue from 200 projects is estimated at Rs. 97 billion till 2012. India has been able to register approximately 350 projects spread across various sectors with major dominance of renewable energy, energy efficiency and biomass energy projects. Carbon is being traded on India's multi-commodity exchange and has become first exchange in Asia to trade carbon credits.
1.14 QUESTIONS
1.14.1 Objective Questions
- The commercial sources of energy are
- solar, wind and biomass
- fossil fuels, hydropower and nuclear energy
- wood, animal wastes and agriculture wastes
- None of the above
- The main source of production of biogas is
- human waste
- wet cow dung
- wet livestock waste
- All of the above
- India's first nuclear power plant was installed at
- Tarapore
- Kota
- Kalpakkam
- None of the above
- In fuel cell, the following energy is converted into electrical energy.
- Mechanical
- Chemical
- Heat
- Sound
- Solar thermal power generation can be achieved by
- using focusing collector or heliostats
- using flat plate collectors
- using a solar pond
- any of the above system
- The energy radiated by sun on a bright sunny day is approximately
- 700 W/m2
- 800 W/m2
- 1 kW/m2
- 2 kW/m2
- The overall efficiency of thermal power plant is equal to
- Rankine cycle efficiency
- Carnot cycle efficiency
- Regenerative cycle efficiency
- boiler efficiency × turbine efficiency × generator efficiency
- Rankine cycle efficiency of a good steam power plant may be in the range of
- 15 –20 percent
- 35 –45 percent
- 70 –80 percent
- 90 –95 percent
- A steam power station requires space
- equal to diesel power station
- more than diesel power station
- less than diesel power station
1.14.2 Review Questions
- Draw a general layout of a steam power plant showing the different circuits and systems and explain them.
- Discuss the relative advantages and disadvantages of a gas turbine plant versus steam and diesel engine plants.
- With the help of block diagram, draw the layout of the principal power plants.
- Discuss the various factors to be considered for the site selection of
- steam power plant
- gas turbine plant
- hydro-electric plant
- nuclear Plant
- What are the different sources of energy? Classify them.
- Discuss the possibilities of various renewable energy sources as potential contenders for power generation.
- Discuss principal types of power plants, their special features and applications.
- Write a short note on present status and future trends of power generation under Indian context.
- How cycle efficiency can be increased in combined power cycles?
- Discuss briefly on resources and development of power in India.
- Elaborate on present status of power generation in India.
- What is the role played by private and government organizations in power sectors?
- 13. What do you understand by carbon credits? Discuss.
Answers
- 1. b 2.d 3. a 4. b 5. d 6. c 7. c 8. b 9. b
1.14.3 References
- Central statistics office Ministry of Statistics and Programme Implementation Government of India, New Delhi.
- Central Electricity Authority (CEA).
- Ministry of Power Website, June 2009.
- Ministry of Power Website, ‘Power for all by 2012' and National Electricity Plan, by Central Electricity Authority, August 2007.