R
RACI Chart – See RACI Matrix.
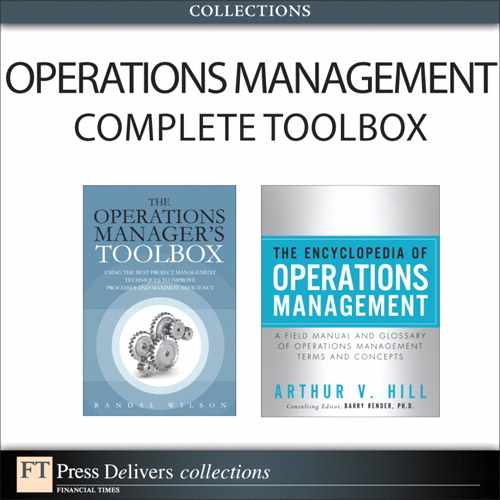
RACI Matrix – A matrix that identifies the roles and responsibilities for all stakeholders involved in any process; the activity of creating a before and after RACI Matrix is called responsibility charting or RACI Analysis; also called a RACI Chart, Responsibility Assignment Matrix, and Linear Responsibility Chart; RACI is pronounced ray-see.
When an organization is going through any type of change, it is important to identify the people involved in the process (the stakeholders) and understand how their roles and responsibilities change from the current process to the new process. The RACI Matrix can be used to ensure that all team members, managers, sponsors, and others know their roles for each step in the new process. The benefits of using the RACI Matrix include fewer misunderstandings, less time wasted in meetings, increased productivity and capacity, fewer disputes about responsibilities and authorities, and better ownership of roles and responsibilities. The RACI Matrix can also be used as the basis of a communication plan before the project and the control plan at the end of the project.
The matrix identifies the process steps down the left side and the individuals or functional roles on the columns across the top. For each step in the process, the matrix indicates the following roles (“decision rights”) for each individual or function:
• R = Responsible – The person responsible for the actions and implementation of the change. Ideally, only one person is assigned to each task, and each row will have only one R cell.
• A = Authority – The person ultimately responsible and accountable for making sure that the task is completed. This person is ultimately answerable for the decision or activity and is usually the supervisor of the person responsible to do the task. This person has decision rights (“yes/no” authority) with respect to the important decisions. Only one person should be accountable for each task, which means that each row should have one and only one A cell. (Note: Most sources call this “Accountable.” However, the terms “responsible” and “accountable” are easy to confuse. Therefore, many sources are now using the less ambiguous term “authority.”)
• C = Consulted – This person should be consulted before, during, and after the task. This person should be “kept in the loop” with two-way communication. The rule here is “no surprises” for this critical person.
• I = Informed – This person should be informed when the task is completed. This person should be “kept in the picture” with one-way communication.
Many organizations add the letter “S” for the people who provide support for the responsible (R) role. The acronym for this form is RASCI and is pronounced ras-see. Some organizations assign colors based on the letter in the cell.
RACI Matrix wedding example
The project team has its own project RACI Matrix, and the process has both a before (“as is”) and after (“should-be”) RACI Matrix. Begin with the A for each task. Each row should have exactly one A, very few Rs, and only a few Cs and Is. Be careful that each column does not have too much work for any one individual. The stakeholder analysis entry discusses these issues further.
A simple hypothetical example of a RACI Matrix for a wedding is shown above. In this example, the bride is both responsible (R) and accountable (A) for the “get wedding dress” task. The mother is to be consulted (C) on this task, and the groom is not involved at all. The groom is both responsible and accountable for the “get tuxedos” task, and the bride is to be consulted. The “groom’s dinner” task has both A and R for the mother of the groom, with others being informed or consulted.
Vertical analysis reveals that the bride has many responsibilities and raises concerns that she will be overwhelmed. This analysis suggests that she delegate some “R” tasks to others.
Horizontal analysis starts by ensuring that only one person is the authority (A) and only one person is responsible (R) for each task. This analysis finds no problems with this particular RACI Matrix.
See change management, control plan, human resources, implementation, job design, lean sigma, organizational design, project charter, stakeholder, stakeholder analysis, workforce agility.
rack jobber – See wholesaler.
Radio Frequency Identification (RFID) – The attachment of transponders to products, as an alternative to barcodes, to enable product identification using a scanner from some distance away. ![]()
Transponders may be either read only or read/write. Although these technologies are generally used inside a plant, some interesting new options are now available through the Internet and even satellite technologies.
See Automated Data Collection (ADC), barcode, Electronic Product Code (EPC), part number, Universal Product Code (UPC), warehouse, Warehouse Management System (WMS).
random number – A uniformly distributed value in the range (0, 1); often used in a computer simulation.
Random numbers can be generated on a computer using a pseudo-random number generator. These generators typically generate a recursive sequence of long integer values, where the next value in the sequence is computed from the previous value. These integers are then translated into the range (0, 1) by dividing by the largest possible integer. This is called a “pseudo” random number generator, because the values appear to be random from a statistical point of view but are not truly random.
For example, Von Neumann developed the simple, mid-square pseudo-random number generator in 1946. With a given seed integer, the next random integer is found by squaring the previous value and finding the middle integer value. The table below shows the sequence for the mid-square random number generator with a seed integer of 1111. The random number is the random integer divided by 10,000. The last column shows the random integer squared and uses square brackets [ ] and bold font to show the middle integer. The random integer 1111 squared is 1234321, which has a middle integer 2343, which becomes the second random integer. The third random integer is the middle integer of (2343)2, which is 4896.
The initial value (the random number seed) uniquely identifies the entire sequence (stream) of random integers and random numbers. In other words, the entire sequence can be repeated exactly for multiple simulation experiments by using the same random number seed each time.
Although the mid-square random number generator is a good way to teach the concept of a random number generator, it has very poor cycle length (i.e., it repeats itself fairly quickly) and has poor statistical properties. In fact, the mid-square method in the example above begins to repeat every fifth value, starting with the 54th random number. As a result, the mid-square random number generator should never be used for any serious simulation analysis.
Mid-square pseudo-random number generator

The linear congruential random number generator (LCG) can generate streams of millions of random numbers without repeating and also has good statistical properties vis-à-vis the runs test, serial correlation, and other tests. Law (2007) presents more details on LCGs.
In Excel, random numbers can be generated with the formula RAND(). However, the RAND() function can return a value of zero, which causes serious problems with many cumulative distribution functions. Using interval notation, the range for RAND() is [0,1). A simple way around this problem is to use 1-RAND(), which is also a uniformly distributed random variable with range (0,1], and therefore will never return a value of zero52.
52 The entry on interval notation explains the precise meaning of the brackets (, [, ), and].
The Excel function RANDBETWEEN(A,B) can be used to generate equally probable (uniformly distributed) random integers between A and B, including the endpoints (i.e., range [A, B]). The Excel formula A+RAND()*(B-A) can be used to generate continuous uniform values between A and B. In VBA, random numbers are generated with the Rnd() function. To generate a stream of random numbers in VBA with a user-defined random number seed, use Rnd(-1) immediately before using the Randomize[stream_number] statement.
Knüsel (2005) found that the random number generator in both Excel 2003 and Excel 2007 has a short cycle length and therefore should not be used in simulations or statistical analyses where accuracy is important. Microsoft has apparently fixed this problem in Excel 2010.
See Erlang distribution, exponential distribution, interval notation, inverse transform method, normal distribution, random variable, runs test, simulation.
random number generator – See random number.
random storage location – A warehouse policy that stores an item in one or more locations labeled with bin IDs rather than a single fixed storage location labeled with the item ID.
Storage locations in a warehouse can be either fixed or random. Fixed storage locations often do not work well over time, because the mix changes (items are added or removed) and the demand rates change (increase or decrease). These issues force the organization to reallocate space to the “fixed” storage locations.
A random storage location often allocates inventories to the first available location that has enough (but not too much) space. This approach will end up with most items stored in more than one location. Random storage makes better use of space and does not require that the fixed storage locations be changed; however, random storage systems require an information system to keep track of where items are stored. With random storage, it is almost impossible for people to remember where an item is stored.
Many warehouses use a combination of fixed and random storage systems. The fixed storage area is the primary location (reserved location) for the item, and the shelf is labeled with item ID. The primary location is the default stocking location and pick face and is used for receipts and picks for a given item. Items can be moved from random bulk storage to the fixed locations as needed.
See fixed storage location, inventory management, locator system, picking, warehouse, Warehouse Management System (WMS), zone storage location.
random variable – A quantity that can take on multiple values (or a continuum of values) with a probability specified by a probability distribution; also called a random variate; sometimes abbreviated RV.
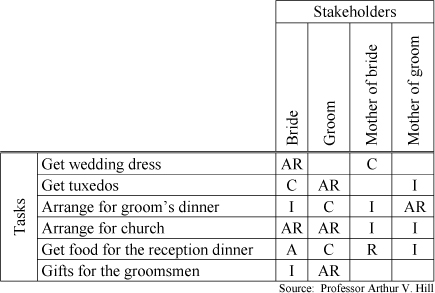
Random variables can be either discrete (integer) or continuous (any real value). Discrete random variables have a probability mass function p(x), which is the probability that random variable X equals the value x (i.e., Prob(X = x) = p(x)) and a cumulative distribution function (CDF), which defines the probability that random variable X is less than or equal to the value x (i.e., Prob ![]() ). Continuous random variables have a probability density function f(x) such that the cumulative distribution function (CDF) is
). Continuous random variables have a probability density function f(x) such that the cumulative distribution function (CDF) is 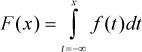 .
.
See probability density function, probability distribution, random number.
range – (1) In a statistics context: The difference between the maximum and the minimum of a set of observed values. (2) In a marketing context: The variety of products offered to a market.
In statistics, the range is a measure of the dispersion (or variability) of a random variable. The range for a sample is the difference between the highest and lowest value observations in the sample. For a normally distributed random variable, the range will be about 6σ. See the entry interval notation for an explanation of the mathematical notation for a range (or domain) for a variable or parameter.
In marketing, the product range is the variety of products offered to the market. See the flexibility entry.
See box plot, interquartile range, interval notation, r-chart, standard deviation.
Rapid Process Improvement Workshop (RPIW) – See kaizen workshop.
RASCI – See RACI Matrix.
rated capacity – See capacity.
ratio scale – See scales of measurement.
raw materials – Purchased items that are the basic inputs to a manufacturing process.
Raw materials are usually bulk or basic commodities, such as chemicals and metals, but may include commonly used parts, such as nuts, bolts, and screws. Some firms make a distinction between raw materials and purchased components, where purchased components are typically purchased assemblies or manufactured parts.
See inventory management, part number.
r-chart – A quality control chart that monitors the range (variability) of a process.
A sample of n parts is collected from the process every so many parts or time periods. The range (maximum minus minimum) of the sample is plotted on the control chart. If the sample range is smaller than the specification limits, the process is said to be “under control.”
See control chart, range, Statistical Process Control (SPC), Statistical Quality Control (SQC).
reality tree – See current reality tree.
real-time – A adjective that describes any process that handles data immediately received rather than periodically in batches or with a delay.
See Business Process Management (BPM), locator system, Manufacturing Execution System (MES), perpetual inventory system, Point-of-Sale (POS), Warehouse Management System (WMS).
receiving – The organization and its supporting building space and equipment that process materials coming into a facility, such as a plant, warehouse, distribution center, or hospital.
When a shipment is received, the receiving organization verifies the contents, quality, and condition of the shipment against a purchase order, interplant order, or customer return (RMA). In some cases, extensive quality testing is done while the shipment is kept on hold. Once verified, the items are then moved either to inventory or directly to the point of use in the facility.
See Advanced Shipping Notification (ASN), bill of lading, cross-docking, dock-to-stock, incoming inspection, materials handling, no fault receiving, Over/Short/Damaged Report, point of use, reconciliation, Return Material Authorization (RMA), supplier qualification and certification, Third Party Logistics (3PL) provider, warehouse, Warehouse Management System (WMS).
recency effect – See primacy effect.
reconciliation – In the accounting/information systems context, the process of comparing two sets of records and resolving differences so the two sets are in agreement.
See purchasing, receiving.
red tag – A lean manufacturing practice used in the 5S “sort” step.
The term “red tag” is used as a verb to describe the process of labeling parts, tools, furniture, measurement instruments, office materials, books, magazines, scrap, etc., that are no longer needed. The term is also used as a noun for the tag placed on an item to signal that the item should be disposed and how it should be disposed (e.g., used in another location, stored, recycled, sold, or discarded).
The sort step in the 5S process often finds many items in a work area that are not necessary for the job. These items might have some value, but make the work area less visible. If an item might have some value, it is red tagged to signal that it should be moved to the red tag area. If an item obviously has no value, it should be discarded, with special care for hazardous materials. The items in the red tag area should be reviewed regularly (e.g., every two weeks) by a cross-functional team of supervisors and engineers. Organizations often invite employees to peruse the red tag area for items they could use in their own areas or buy for their personal use. The result of a good red tag process is a more visible workplace, which is a main objective of lean thinking.
See 5S, cross-functional team, lean thinking, obsolete inventory, scrap.
re-engineering – See Business Process Re-engineering (BPR).
refurb – See refurbished.
refurbished – Products that have been returned by the customer, disassembled, repaired, tested, and repackaged for sale; sometimes called refurb or refurbed products.
The refurbishing (remanufacturing) process often involves disassembly, replacement of some parts, and reassembly. In some cases, these products are marked as “refurb” products and sold at a discount with a shorter warranty. However, in some industries, refurb products are used interchangeably with new ones. Although this might seem unethical, these firms are typically using components that have a very long MTBF (Mean Time Between Failure), which means that this practice rarely affects product performance.
See remanufacturing.
regeneration – See Materials Requirements Planning (MRP).
regional sourcing – See sourcing.
regression – See linear regression.
reintermediation – See disintermediation.
Relative Absolute Error (RAE) – A forecasting performance metric that compares the actual forecast error to the forecast error of a very simple forecasting model; defined mathematically as the mean of the absolute values of the actual forecast errors divided by mean of the absolute values of the forecast errors from a naïve (simplistic) forecasting model.
The RAE is the forecast error expressed as a percent of the error from a very simple forecasting model. When this ratio is close to zero, the forecasting model is good; when this ratio is greater than one, the forecasting model is worse than the naïve forecasting model.
Armstrong and Collopy (1992) proposed a simple RAE metric that compares the forecast errors against the absolute error of a random walk forecast. A random walk uses the actual demand from the previous period as the forecast for this period. The equation for the RAE using the random walk forecast as the basis of comparison is  , where Et is the forecast error in period t, Dt is the actual demand (sales) in period t, and T is the number of values collected so far. The difference Dt − Dt-1 is the change in the demand from the last period to this period.
One problem with this approach is that when the demand is constant for two successive periods (i.e., |Dt − Dt−1| = 0), the RAErw will have a divide-by-zero problem. Also, when this difference is small, the RAE ratio can be very large. Collopy and Armstrong (2006) suggest “Winsorizing” (bounding) the RAE in each period so the ratio does not exceed some maximum value. Many authors suggest a bound of 1. For example, if the demand is 0 and the forecast error is 20 units, |Et|/Dt should be set to 1. This means that MAPE is defined in the range (0, 100%).
A slightly more sophisticated approach is to generate the naïve forecast with a simple exponential smoothing model where α = 0.1. Mathematically, this is expressed as SAt−1 = 0.1Dt-1 + 0.9SAt-2, where SAt-1 is the smoothed average demand at the end of period t − 1 and is used as the naïve forecast for period t. One advantage of this method is that the smoothed average will almost never be zero.
Collopy and Armstrong (2006) argue persuasively that the Mean Absolute Scaled Error (MASE) metric is better than any RAE metric.
See exponential smoothing, forecast error metrics, Mean Absolute Deviation (MAD), Mean Absolute Percent Error (MAPE), Mean Absolute Scaled Error (MASE), Thiel’s U, Winsorizing.
reliability – The probability that an item will continue to function at customer expectation levels during a specified period of time under stated conditions.
Mathematically, reliability is expressed as one minus the cumulative distribution function (CDF). In other words, 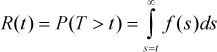 , where T is a random variable that represents the life of the product (starting at time zero) and f(t) is the density function for the time to failure.
See availability, bathtub curve, commonality, Design for Reliability (DFR), downtime, maintenance, Mean Time Between Failure (MTBF), metrology, New Product Development (NPD), probability density function, quality management, reliability engineering, Total Productive Maintenance (TPM).
reliability engineering – An engineering field and function that deals with the ability of a system, machine, product, or component to perform required tasks under stated conditions for a specified period of time.
Reliability engineering practices include the design, specification, assessment, and achievement of product or system reliability requirements. This involves aspects of prediction, evaluation, production, and demonstration.
See maintenance, reliability, Total Productive Maintenance (TPM).
Reliability-Centered Maintenance (RCM) – A maintenance approach that prioritizes machines and maintenance activities to increase system reliability.
The seven basic questions for RCM are:
1. What are the functions and associated performance standards of the asset in its present operating context?
2. In what ways does it fail to fulfill its functions?
3. What causes each functional failure?
4. What happens when each failure occurs?
5. In what way does each failure matter?
6. What can be done to predict or prevent each failure?
7. What should be done if a suitable proactive task cannot be found?
RCM emphasizes the use of predictive maintenance techniques in addition to traditional preventive measures. A well-run RCM program focuses scarce economic resources on the assets that would cause the most disruption if they were to fail.
See maintenance, Total Productive Maintenance (TPM).
remanufacturing – The process of repairing, refurbishing, or disassembling products into reusable components.
Remanufacturing often involves breaking a product down into modules, disposing of modules, replacing those that cannot be refurbished, repairing those that can, and then reassembling and testing the product. Remanufacturing is being driven by both economic and environmental interests. In some countries, remanufacturing is required by law. Examples of products that are often remanufactured include aircraft engines (Chua, Scudder, & Hill 1993), diesel engines, and other expensive equipment.
See Design for Disassembly, green manufacturing, refurbished (refurb), reverse logistics.
reorder point – An inventory management policy that orders more inventory when the inventory position hits a critical level called the reorder point; also called an order point system. ![]()
The graph below shows the reorder point system through two order cycles. Whenever the inventory position (on-hand plus on-order minus allocated) goes below the reorder point, a new order is placed.

An order point system is a continuous review system, which means that it compares the inventory position with the reorder point after every transaction. The standard equation for the reorder point is R = LμD + SS, where L is the constant planned leadtime, μD is the average demand per period, and SS is the safety stock in units. The safety stock is normally set to ![]() , where z is the safety factor, and σD is the standard deviation of demand per period. The safety stock entry explains how to select the safety factor z and the planned leadtime L to achieve a user-specified service level.
, where z is the safety factor, and σD is the standard deviation of demand per period. The safety stock entry explains how to select the safety factor z and the planned leadtime L to achieve a user-specified service level.
The first term of the reorder point (LμD) is the expected (or forecasted) demand during leadtime, which could be a moving average, a simple exponentially smoothed average, or a more sophisticated forecast that also includes trend and seasonal factors. In contrast, the Time Phased Order Point (TPOP) system used in all MRP systems uses the planned requirements (consumption) from higher-level assemblies to forecast (or plan) the demand during leadtime. The second term of the reorder point is the safety stock.
See continuous review system, demand during leadtime, exponential smoothing, inventory management, inventory position, leadtime, min-max inventory system, order cycle, order-up-to level, periodic review system, safety stock, service level, Time Phased Order Point (TPOP), two-bin system.
repatriate – (1) To return to the country of birth, citizenship, or origin. (2) One who has been repatriated.
For example, a division of a multinational firm might need to repatriate funds to the firm’s headquarters. See expatriate.
repetitive manufacturing – A production process with large lotsizes (long runs) of standard products.
The term “repetitive manufacturing” is often used in the context of a pull system.
See continuous flow, pull system.
replenishment leadtime – See purchasing leadtime, leadtime.
replenishment order – A purchase or manufacturing order used to resupply an item.
See continuous review system, demand during leadtime, fulfillment, safety stock, two-bin system, vendor managed inventory (VMI).
repositioning – (a) Inventory context: Moving inventory to where it can better serve customers. (b) Transportation context: Moving empty ocean containers to where they will more likely be needed. (c) Marketing context: Changing the identity of a product relative to competing products.
See backhaul, deadhead, logistics.
request date – See job shop scheduling, respond to order (RTO), service level.
Request for Information (RFI) – See Request for Proposal (RFP).
Request for Proposal (RFP) – An invitation to prospective suppliers to submit a document that includes the price, schedule, technical specifications, and additional supporting information.
The RFP specifies the required product or service and the due date and time. RFPs request information, such as the technical specifications of the products and services, quantities, price, schedule, place of delivery, method of shipment, packaging, instruction manual requirements, data requirements, training, support, technical capabilities of the supplier, references (other customers), and financial information (so that financial stability of the supplier can be evaluated).
A well-run RFP process informs prospective suppliers about the customer’s requirements, encourages them to make their best offers, collects factual proposals from a number of suppliers, and uses an objective and structured evaluation process to select the best supplier.
Similarly, many buyers submit a Request for Information (RFI) or a Request for Quotation (RFQ). An RFI is used to find suppliers that can meet the specifications. A buyer uses an RFI to discover supplier capabilities without having to reveal volume or service requirements. An RFP takes an RFI one step further by requesting that the supplier bid on specific items defined by specification, quantities, delivery locations, packaging, method of shipment, etc. An RFQ is used when a supplier is already familiar with the buyer’s requirements and the focus is on price.
See purchasing.
Request for Quotation (RFQ) – See Request for Proposal (RFP).
requisition – A purchasing term for a formal request for materials or services sent from an organizational unit to the buying organization.
Requisitions are often used to replenish inventory, meet a particular customer need, conduct maintenance, acquire consulting services, or meet some other need. They usually take the form of a document or electronic record. Like purchase orders, requisitions specify a creation date, request date, requested items, and quantities; but unlike purchase orders, requisitions usually leave pricing and vendor selection to the buying organization.
See purchase order (PO), purchasing.
reserve storage area – A warehousing term for an area used to store inventory that is used to replenish forward pick areas; also called bulk storage, overflow storage, reserve locations, and backup storage.
See forward pick area, picking, slotting, warehouse.
resilience – The ability of an organization to reinvent business models and strategies as circumstances require.
A resilient organization has the power to prosper in almost any economic climate. To be resilient, organizations need management systems that facilitate innovation and experimentation. According to Hamel and Välikangas (2003, p. 62), “Battlefield commanders talk about getting inside the enemy’s decision cycle. If you can retrieve, interpret, and act upon battlefield intelligence faster than your adversary you will be perpetually on the offensive, acting rather than reacting. In an analogous way, one can think about getting inside a competitor’s renewal cycle. Any company that can make sense of its environment, generate strategic options, and realign its resources faster than its rivals will enjoy a decisive advantage. This is the essence of resilience. And it will prove to be the ultimate competitive advantage in the age of turbulence when companies are being challenged to change more profoundly, and more rapidly, than ever before.”
They argue that managers can reduce the time to recognize the need to change a business model in three ways: (1) get first-hand evidence by visiting places where change happens first (e.g., talking to people under 18, visiting a research lab), (2) filter out the “filterers” who have a vested interest in continued ignorance, and (3) face up to the inevitability that your current strategy will decay.
See agile manufacturing, Business Continuity Management (BCM), flexibility, robust, scalability, time-based competition.
resource based view – A strategic point of view that firms can gain competitive advantage if and only if they have superior resources and those resources are protected by barriers to entry; sometimes called RBV.
A firm’s unique combination of resources and organizational capabilities create the potential for competitive advantage to the extent to which they are valuable, rare, inimitable (hard to imitate), and non-substitutable. The resource based view holds that these resources and capabilities are the foundation of a firm’s strategy, the primary source of the firm’s profit, and the only stable basis of the firm’s identity (Wu, Melnyk, & Flynn 2010).
See core competence, operations strategy.
Resource Requirements Planning (RRP) – A process used to check higher-level plans to ensure that sufficient resources are available; also called resource planning.
RRP is done at the product family/aggregate unit level before the master schedule is updated to ensure that the production plan does not exceed the available capacity.
See Business Requirements Planning (BRP), capacity, Capacity Requirements Planning (CRP), Master Production Schedule (MPS), product family, production planning, Rough Cut Capacity Planning (RCCP), Sales & Operations Planning (S&OP).
respond to order (RTO) – A customer interface strategy that postpones one or more value-adding activities in the supply chain until after the customer order has been received. ![]()
The term “respond to order” was coined by this author to describe assemble to order (ATO), make to order (MTO), engineer to order (ETO), and other customer interface systems that support customization. The following table contrasts the make to stock (MTS) strategy with the three main RTO strategies.
Similar RTO customer interface strategies include:
• Build to order (BTO) – Another name for make to order (MTO) or assemble to order (ATO). See Gunasekaran and Ngai (2005) for an article on BTO.
• Configure to order (CTO) – A customer interface strategy that adjusts parameters or adds modules to a product in response to a customer order.
• Pack to order – A customer interface strategy that collects components and packs them in a box or some other shipping container in response to a customer order.
• Print on demand – A customer interface strategy that prints books, manuals, and other materials in response to a customer order rather than creating an inventory of printed materials. This is commonly called “Print-on-Demand” in the publishing industry.
The service level entry presents metrics for all types of RTO strategies.
See assemble to order (ATO), build to order (BTO), configure to order (CTO), customer leadtime, engineer to order (ETO), fabrication, flexibility, make to order (MTO), make to stock (MTS), mass customization, operations strategy, order-to-cash, pack to order, postponement, print on demand, push-pull boundary, service level, standard products.
response time – The time between a request and the satisfaction of that request.
In the field service context, response time is usually defined as the time from the initial customer request for service until the technician appears at the customer site. In some cases, the technician might be delayed in getting to a machine after arriving at the site due to building security and walking time. Some field service organizations offer response time guarantees.
See field service, service guarantee.
responsibility charting – See RACI Matrix.
restocking charge – See buy-back contract.
Results-Only Work Environment (ROWE) – An employment policy co-created at Best Buy by Cali Ressler and Jodi Thompson that allows workers to choose when and where they work provided they achieve their required goals.
ROWE is a radical experiment designed to provide unparalleled freedom for employees to decide when, where, and how much they work (Ressler & Thompson, 2010). With ROWE, jobs are not defined in terms of showing up for work but rather in terms of the required outcomes. ROWE empowers individual workers to decide how they will achieve results. Workers are often not even required to attend meetings in person.
Although this program began only for salaried employees, it has been extended to hourly workers. Salaried employees are only required to work as much time as it takes to complete their goals. Hourly employees, however, have to work a set number of hours to comply with U.S. labor regulations, but they can still choose when they work.
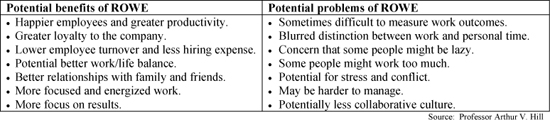
The developers’ website is http://gorowe.com.
See human resources, job design, productivity.
retrospective validation – See process validation.
Return Goods Authorization (RGA) – See Return Material Authorization (RMA).
return logistics – See reverse logistics.
Return Material Authorization (RMA) – A document or electronic record provided by a supplier that gives a customer authority to return a product; also called Return Goods Authorization (RGA).
An RMA gives a customer permission to return a product for credit, repair, or disposal. The RMA gives the receiving location information about the product and instructions on how to process the return.
See buy-back contract, receiving, return to vendor, reverse logistics.
Return on Assets (ROA) – A financial measure of a company’s after-tax profitability relative to its total assets.
ROA is calculated as (net income)/(total assets).
See financial performance metrics.
Return on Capital Employed (ROCE) – A measure of how effectively a firm is using its capital.
ROCE is calculated as EBIT divided by capital employed, where EBIT is earnings before interest and taxes and capital employed is total assets less current liabilities.
See financial performance metrics.
Return on Investment (ROI) – The rate of return of an investment over some time period.
ROI is calculated as net income divided by total assets.
See financial performance metrics.
Return on Net Assets (RONA) – A measure of the productivity of a company’s invested capital regardless of the amount of financial leverage employed.
RONA is calculated as profit after tax divided by fixed assets plus working capital, where working capital is defined as current assets minus current liabilities.
See DuPont Analysis, financial performance metrics.
return to vendor – Purchased material found to be defective during receiving inspection or the production process and then designated to be returned to the supplier for credit or replacement.
For example, a regional dairy company found that some of its ice cream cartons were defective after it started the manufacturing process. The company immediately informed the carton supplier of the problem and then later charged the relevant costs to the supplier, including the cost of the cartons, the cost of the ice cream lost in the process, and the lost labor and machine capacity.
See buy-back contract, Return Material Authorization (RMA), reverse logistics.
revenue center – An accounting term for an area of responsibility that is only held accountable for its sales.
Revenue centers are almost always customer-facing organizations, such as the sales organization.
See cost center, investment center, profit center.
revenue management – See yield management.
revenue sharing contract – See buy-back contract.
reverse auction – An auction in which a buyer submits requests for quotations from suppliers for goods or services.
The buyer calls for bids for something that it needs to buy, and the suppliers quote the price and volume at which they are willing to supply the good or service.
For example, General Electric invites a group of qualified suppliers to participate in an electronic auction with a clearly defined date and product specification. At the time of the auction, participating bidders assemble at a common Internet site and bid for the General Electric contract.
See Dutch auction, e-auction, e-business, e-procurement, purchasing, sniping.
reverse engineering – The process of dismantling and studying a competitor’s product to understand the strengths and weaknesses of the design to support the design effort for a similar product.
Reverse engineering can be used to better understand product technologies, materials, process technologies, assembly methods, and suppliers. Reverse engineering is a legal competitive strategy if the product is obtained legally and so long as no patents, trademarks, or copyrights are violated.
See New Product Development (NPD), technology transfer.
reverse logistics – The management of the flow of warranty returns, products, salvage, and waste from the customer back to the supplier; also called return logistics.
Reverse logistics returns materials to a manufacturer, distribution center, repair center, or disposal site to be reused, serviced, repaired, recycled, re-manufactured, or disposed. The materials can be either hazardous or nonhazardous. In some cases, firms integrate their forward and reverse logistics activities.
For example, 3M has its field service technicians manage the return of hazardous circuit boards for refurbishing or proper disposal. Likewise, Volkswagen takes back old cars to recycle and reuse some seat materials. Interest in reverse logistics is driven by both environmental concerns and cost-saving opportunities.
Many order management systems have reverse logistic modules that allow service reps to create Return Merchandise Authorizations (RMAs) to send to customers so items can be brought back into the retailer’s supply chain and tracked appropriately.
See distribution, field service, green manufacturing, logistics, remanufacturing, Return Material Authorization (RMA), return to vendor, upstream.
revision control – See version control.
revision level – See version control.
rework – Any activity that attempts to fix, correct, or repair an unacceptable product or service.
In manufacturing, rework is often required to fix units that had defects in the manufacturing process. If rework cannot be done or is unsuccessful, the defective units are usually scrapped.
In the lean philosophy, rework is waste, because it adds cost, reduces capacity, takes up space, etc. Lean consultants are fond of saying that any word that starts with the letters “re” is evil. For example, readjust, reassemble, rebuild, recalibrate, recertify, recheck, recount, recreate, redo, reenter, reinstall, reopen, repack, repair, repeat, replan, reprint, resend, reset, reship, resort, restart, restate, retell, retest, retrace, return, retype, revisit, and rework are almost always wasteful. However, many “re” words are also good in operations. For example, record, recycle, redeem, reduce, refill, refine, relax, relate, remember, remove, repair, repent, replace, replenish, respect, and reuse.
See 8 wastes, hidden factory, lean thinking, Overall Equipment Effectiveness (OEE), prevention, process map, scrap.
RFID – See Radio Frequency Identification (RFID).
RFP – See Request for Proposal.
Richards Curve – See logistic curve.
right of first refusal – A purchasing practice where a buyer’s favored supplier sees bids of all other participating suppliers before announcing its own.
Elmaghraby, Goyal, and Pilehvar (2010) found that this practice has both qualitative and quantitative benefits for the buyer when the buyer has a second auction in the near future with the same participating suppliers. This outcome depends on the suppliers managing the information generated in the first auction to optimize the joint outcome of both auctions.
See purchasing.
The term “risk” is often used synonymously with “probability,” but in professional risk assessments, risk takes into account both the probability of a negative event with how harmful that event might be. An event is said to be of high risk only if the probability and the impact are both high.
See http://en.wikipedia.org/wiki/Risk for a good summary on this topic.
See Failure Mode and Effects Analysis (FMEA), risk assessment, risk mitigation.
risk assessment – The identification and evaluation of nearly all possible causes (modes) of failure.
For each possible failure mode, a thorough risk assessment considers (1) what can fail, (2) how likely is it to fail, and (3) the economic and social consequences of a failure. The Failure Model and Effects Analysis (FMEA) entry describes this process in more detail.
See decision tree, Failure Mode and Effects Analysis (FMEA), fault tree analysis, risk, risk management, risk mitigation.
risk management – The assessment and mitigation of risk.
See Occupational Safety and Health Administration (OSHA), risk assessment, risk mitigation, safety.
risk mitigation – Actions taken to reduce the probability or lessen the impact of an adverse event.
Ideally, risk mitigation completely prevents an adverse event. However, when total prevention is not possible, it is important to (a) reduce the probability of the event and (b) reduce the impact of the event if it does occur. Risk mitigation also planning how the recovery should be implemented.
See error proofing, Failure Mode and Effects Analysis (FMEA), fault tree analysis, risk, risk assessment, risk management, safety.
risk sharing contract – An agreement between two parties to engage in a transaction where the payment is based on uncertain results.
Video store revenue sharing (risk sharing) contract example

Adapted from Cachon and Lariviere (2001)
The table on the right presents an interesting example of a risk sharing agreement (a revenue sharing agreement) between Blockbuster (a north American video rental chain) and the video manufacturers. In this example, Blockbuster pays a lower up-front charge, but gets more DVDs to rent. In exchange, the manufacturer gets a share of Blockbuster’s rental revenue.
Cachon and Lariviere (2005) compared revenue sharing to a number of other supply chain contracts, such as buy-back contracts, price-discount contracts, quantity-flexibility contracts, sales-rebate contracts, franchise contracts, and quantity discounts and found that revenue sharing is equivalent to buy-backs in the newsvendor case and equivalent to price discounts in the price-setting newsvendor case. They also identified several limitations of revenue sharing, which explain why it is not prevalent in all industries.
See buy-back contract, fixed price contract, purchasing, quantity discount, service guarantee, supply chain management.
Robinson-Patman Act – See antitrust laws.
robotics – The science, development, and application of self-contained, programmable, multifunctional electronic, electric, or mechanical devices called robots that can function without human intervention and can augment humans in their work.
Robots combine artificial intelligence software, mechanical manipulators, sensors, controllers, and computers to provide programmable automation. Czech writer Karel ![]() apek introduced the word “robot” in his play R.U.R. (Rossuum’s Universal Robots) in 1921. The word “robot” comes from the Czech word “robota,” which means “compulsory labor.” The word was popularized by science fiction writer Isaac Asimov.
apek introduced the word “robot” in his play R.U.R. (Rossuum’s Universal Robots) in 1921. The word “robot” comes from the Czech word “robota,” which means “compulsory labor.” The word was popularized by science fiction writer Isaac Asimov.
See Artificial Intelligence (AI), Automated Guided Vehicle (AGV), automation.
robust – (a) Hard to break; (b) Useful in a wide variety of situations; (c) Useful in the presence of high variation; sometimes called fault tolerant or error-proof; antonym: error-prone.
Robust design: A component or product design is said to be “robust” if it (1) can be used in a wide variety of products, (2) can be adapted to new requirements, (3) is reliable, sturdy, and almost never breaks (i.e., resilient and error resistant) in the presence of environmental variation, or (4) can be produced in the presence of variation without defects. Points (1) and (2) support part commonality.
Robust process: A process is said to be “robust” if it (1) can be used for a wide variety of products, (2) can adapt to new requirements, and (3) can withstand a wide variety of stresses and almost never fails (i.e., is error resistant).
See Business Process Management (BPM), commonality, Design of Experiments (DOE), durability, error proofing, Failure Mode and Effects Analysis (FMEA), maintenance, mass customization, Mean Absolute Deviation (MAD), operations performance metrics, operations strategy, process, resilience, Taguchi methods.
rolled throughput yield – See yield.
Root Cause Analysis (RCA) – A tool used to identify the contributors to an adverse event (or events) after the fact. ![]()
Unlike Failure Mode and Effects Analysis (FMEA), RCA is usually conducted after an adverse event rather than before. The purpose of RCA is to identify what caused the event and then improve the system so the problem does not reoccur. As the name implies, the goal is to track down and fix the root cause (or the system of causes) of the problem, not simply deal with the symptoms of the problem.
RCA is fundamental to all process improvement programs. Many tools are useful in RCA. The 5 Whys and Pareto analysis are particularly useful starting points. Causal maps, C&E Diagrams, and fishbone diagrams go beyond the 5 Whys approach. These tools can be facilitated with a Nominal Group Technique (NGT) and affinity diagrams. If enough data is available, linear regression analysis and graphical tools, such as scatter diagrams, can often help identify the potential “problem drivers.” The end result of RCA should be an action plan for fixing the system of causes of the problem.
The causal map entry argues that the term “root cause” can be misleading, because most problems have more than one cause. In fact, most problems have a system of causes that need to be understood, prioritized, and managed.
See 5 Whys, affinity diagram, C&E Diagram, causal map, error proofing, Failure Mode and Effects Analysis (FMEA), fault tree analysis, impact wheel, issue tree, learning organization, Nominal Group Technique (NGT), Pareto Chart, Pareto’s Law, scatter diagram, sentinel event, service recovery.
root cause tree – A causal map that begins with the undesired effect and tracks back to root causes.
A root cause tree is very closely related to causal maps, C&E Diagrams, and fault trees. Root cause trees usually put the undesired effect (the problem) at the top of the page, identify the main causes of the problem below it, and then identify the causes for each cause below that.
See C&E Diagram, causal map, fault tree analysis.
root mean squared error (RMSE) – See mean squared error (MSE).
Rough Cut Capacity Planning (RCCP) – A process that checks if enough capacity is available to achieve a given Master Production Schedule (MPS).
The Rough Cut Capacity Planning (RCCP) process converts the Master Production Schedule (MPS) into a requirements plan for a few key resources using a bill of resources. If the required resources (the load) exceed the available resources (the capacity), production planners must find additional capacity or lower the load.
Some consultants use the term “rough cut capacity planning” to describe the process of checking the capacity for the highest-level production plan. However, according to the APICS Dictionary and other sources, Resource Requirements Planning (RRP) is used to compare load and capacity for the production plan (also known as the aggregate production plan), and RCCP is used to compare load and capacity for the MPS.
See bill of resources, Business Requirements Planning (BRP), capacity, Capacity Requirements Planning (CRP), Master Production Schedule (MPS), production planning, Resource Requirements Planning (RRP), Sales & Operations Planning (S&OP).
routing – The sequence of manufacturing steps (operations) required to make an item.
Whereas the bill of material (BOM) defines which items are required to make a product, the routing defines the sequence of operations required to make each item (material, part number, item number, or SKU). Each operation is usually identified by a sequence number, workcenter, operation effectivity date, standard setup time, and standard run time per part. The routing information may also include tooling, special labor and machine resources, alternate routings or operations, and other specifications. Materials Requirements Planning (MRP), Capacity Resources Planning (CRP), and Manufacturing Execution Systems (MES) use routing information for planning purposes.
The primary routing defines the normal sequence of operations used to assemble or manufacture an item and therefore is normally used for capacity planning and standard cost estimation. The alternate routing is a sequence of steps used when the primary routing is not viable due to machine downtime or congestion.
See bill of material (BOM), Capacity Requirements Planning (CRP), leadtime, Manufacturing Execution System (MES), Materials Requirements Planning (MRP), operation, run time, shop floor control, shop packet, Theory of Constraints (TOC), workcenter.
R-squared – See correlation, linear regression.
RTO – See respond to order (RTO).
run chart – A simple graph that displays data in time sequence; also known as a runs chart, time series graph, time series plot, trend chart, run-sequence plot, line graph, and run diagram.
The x-axis for a run chart is either time or the observation number. The y-axis is an output (performance) metric for a process. The mean or median of the performance variable is often included in the graph to show a horizontal reference line.
A run chart can be used to monitor a process to check for changes in the mean or trend and also to check for outliers. Unlike a control chart, the y variable for a run chart usually represents a single observation rather than a sample statistic (such as the mean or range of a sample) and does not show control limits.
See control chart, outlier, scatter diagram, seven tools of quality.
run time – The time required to produce a single part or product.
The total time for an operation is the setup time plus the batch size (lotsize) times the run time. The total time for an order is the sum of the operation times for all operations in the routing. The planned leadtime for an order should include queue time. In the queuing theory context, the average run time is called the average service time.
See Economic Lot Scheduling Problem (ELSP), leadtime, queuing theory, routing, setup time, touch time.
running setup – See external setup.
runs test – A statistical test that checks if a sequence of values is sequentially (serially) independent.
The runs test is a non-parametric statistics test used to answer questions about a time series such as:
• Is this sequence data generated from a random process? If the sequence is truly random, it should change directions fairly often, but not too often.
• Is this process in control? If a process is in control, the performance variable will have a constant mean and can be modeled as yt = μ + et, where yt is the t-th observation, μ is the mean, and et is the error term in period t. If the sequence of errors is random, the errors should change signs fairly often, but not too often.
• Is this model a good fit for the time series data? If the model is a good fit for the data, the errors should be random and should change signs fairly often, but not too often.
• Does this time series have serial correlation? If successive values are correlated (e.g., COR(xt, xt-1)) > 0), the time series has serial correlation and is not serially (sequentially) independent.
• Can we assume that values from two different sources come from the same underlying population? If we have values from two different sources (locations, firms, subpopulations), are they from the same distribution or are they different?
The above questions involve a sequence that can be coded (represented) as a sequence of 0 and 1 values. All sequences can be coded as a binary variable using methods such as:
• Code an increase from period to period as a 1 and a decrease as a 0.
• Code a value greater than the mean (or median or mode) as a 1 and below as a 0.
• Code a value greater than zero (or some other cut point value) as a 1 and below as a 0.
• Combine the sequences from the two sources, rank them from lowest to highest values, and label the data from the first source with a 0 and the second source with a 1.
A run is defined as a sequence of one or more binary variables (0 or 1) that have the same value. For example, the sequence {0, 0, 1, 1, 1, 0, 0, 0, 1, 0, 0, 1, 1, 1, 0, 0} has seven runs. We can use probability theory to calculate the probability that a sequence has exactly r runs given the number of 1’s and 0’s in the sequence. If the number of runs in the sequence is far less or far more than expected, the sequence is judged to be not sequentially independent. For example, when flipping a coin, the sequence HHHHHTTTTT would be considered just as unexpected as HTHTHTHTHT. The runs test is called a “non-parametric” test, because it can make inferences from the data without making any statements about the parameter values and requires no assumptions about the distribution of the data.
See autocorrelation, Durbin-Watson Statistic, random number.