
26
Keeping your stakeholders engaged
On a person-to-person basis, nothing replaces maintaining personal contact and gauging attitudes on an ongoing and informal basis. Do not underestimate the benefits of walking around and talking to people.
“The single biggest problem in communication is the illusion that it has taken place”
GEORGE BERNARD SHAW, 1856–1950
- Understand your stakeholders, their needs and interests.
- Decide what you need to communicate.
- Plan the timing of your communications.
- Choose the most appropriate way of delivering your communications.
- Check how effective your communications are and change your plan if necessary.
Why stakeholder management?
A stakeholder is any person or group of people who are affected by the outcome or undertaking of a project. For the project to be successful you either need the stakeholders’ commitment or at least know they won’t get in the way. Stakeholder management is the set of activities relating to the identification, analysis, planning, and engagement of stakeholders.
Project success does not only rely on effective technical management and planning, but frequently on managing the politics. This is particularly the case for internal major change projects or where you are supporting your customer through a significant change. You ignore your stakeholders at your peril; they have the power to turn even the best planned project to chaos if their interests are not understood and managed. The aim of stakeholder management is to lead stakeholders to behave in a way beneficial, or at least neutral, to the aims of the project.
Stakeholder management falls into four broad activities:
- Identification and analysis: in this activity you should identify your stakeholders and determine what their attitude is towards the project and the impact this may have on the outcome. Chapter 17, Project setup, looked at this but you will also need to do this throughout the project as new stakeholders appear.
- Planning: through this activity you decide which of the stakeholders you need to engage to ensure the project objectives will not be compromised and then decide what actions to take.
- Engagement: this is the real work when you carry out the actions you have planned. This will involve meeting people (formally and informally), as groups or individuals, presenting at meetings, writing personal emails or letters and generally using whatever media available to influence the support you need. I tend to think of stakeholder engagement as the more personal activities, whilst regarding “communications”, covered later in this chapter, as addressing large numbers of people.
- Monitoring: you should monitor the actions resulting from your engagement plan and determine to what extent they have been successful. If they are not working, you may need to change your approach. You will also find new stakeholders are identified and some existing ones will “disappear” and become irrelevant.
Identification, analysis, and planning
Identify your stakeholders and analyse their needs
The identification and analysis of stakeholders requires a number of activities to be undertaken. First, identify your possible stakeholders, capturing any personal information, such as their role and contact details. You also need to understand the interest they may have in the project outcome, often called “WIFM” or “What’s in it for me?” The idea is to gain an understanding of each stakeholder and determine their importance in achieving the project objectives. Think of them as:
- advocates, who proactively back the aims of the project; you can call on whenever needed;
- supporters, who support the aims of the project and will help the project team, if asked;
- neutral, who are ambivalent about the project and will let the project happen. Beware of the neutral ones, they may be just hiding negative views; do not lose sight of them;
- critics, who are against the project and take every opportunity to speak or act against the project team;
- blockers, who work to ensure the project does not proceed, or fails.
Try to discover what motivates each of your stakeholders and understand their source of power, which may be:
- position, resulting from rank, formal authority and whatever decision rights they have;
- status, resulting from how an individual is perceived, often related to charisma and leadership qualities but may bear no relationship to facts of any particular project. Status can also be “reflected” (when a person uses the position of their boss to enhance their own standing);
- resource, where a person has direct authority over resources and can thereby smooth the way, or block, any initiative requiring those resources. They can be directors, managers, or unions or even be the person with the key to the stationery cupboard;
- expertise, where the knowledge or skill of an individual is such that others listen to and follow them;
- legal and regulatory, where a group or body has authority over the “rules of engagement” for an industry.
Determine what you require from each stakeholder; for example, do they hold resources you need? Look at the relationships between the stakeholders and not just the formal company reporting lines and hierarchy; look at personal friendships or animosities. In modern organizations, people change jobs frequently and the formal hierarchy is not always representative of who knows whom. In one organization I worked in, many of the senior managers were from the armed forces and often knew each other well before they joined the organization. If your project extends outside your organization, relationships can be even more important. Work out who has power or influence over others which may be valuable to you and whom you have no access to. This is particularly useful if you have a vital but particularly difficult stakeholder you want to become an advocate. This may sound Machiavellian, but it can be done ethically and with integrity. The same techniques and tools can be used for good as well as darker purposes; what matters is the motivation of the person using the tools.
For all stakeholders, you need to consider what they stand to gain or lose from the change you are attempting to make and the extent they are vital. What do they control that can affect your ability to implement the change and what can they provide? Determine what part they play; are they a:
- decision maker: are they required to make a decision?
- influencer: can this person sway the decision makers toward or away from your objectives?
- pla yer: are they required to play an active part in making the change happen?
- consenter: are they on the fringes but, without their agreement, success is impossible (for example unions)?
This analysis can become overwhelming, especially as the number of stakeholders rises. For this reason, stakeholder mapping tools are useful to help visualize the relative positions, relationships, and interests of stakeholders so you can start making judgements and choices on who matters and why. If you did Workout 17.6, you have already started to use mapping. There are more tools and variants of tools being developed all the time, but Figures 26.1 to 26.4 show a number of commonly used mapping techniques, each looking at stakeholders from different points of view.
Stakeholder landscape
The stakeholder landscape is used to check you have a good spread of stakeholders across the organizations impacted by the project (Figure 26.1).
Divide the map into sectors, one for each “domain” you want to look at. The commonest would be the divisions or departments in an organization. Next, place each of your stakeholders in the appropriate sector, positioning the most powerful towards the centre. You can then see, at a glance, if each sector is covered and the position of each stakeholder.
I n the following example I have shown eight sectors, representing major parts of the organization. We can now see that Jim in Finance is the main blocker for this
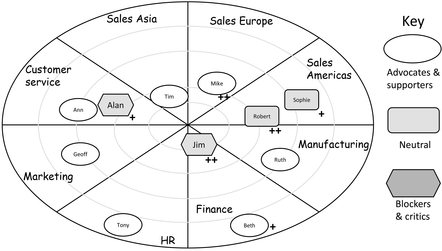
Figure 26.1 Stakeholder landscape
The stakeholder landscape is used to check you have a good spread of stakeholders across the organizations impacted by the project.

Figure 26.2 Power-influence stakeholder map
The power-influence map shows each stakeholder, either individual or group, and their relative power and influence over the project and its outcomes.
project. Beth is also in Finance but appears to have little power to help. Sales Americas doesn’t seem to care one way or another, so perhaps they see the project as being irrelevant; the other two Sales are positive. You are also able to see where any gaps are; for example, do you need a power figure in HR? If so, Tony may not be adequate for your needs.
You can have variants of this map, by plotting influence or level of support, instead of power. You could also use different markers on the plot icons to provide additional information, such as adding a “++” to those with high influence or “+” for moderate influence. I have also shown this in Figure 26.1.
Power-influence map
The power-influence map shows each stakeholder, either individual or groups, and their relative power and influence (Figure 26.2 opposite).
On a scale of 1 to 10 (10 = high), assess how much power an individual or group has; think in terms of their formal authority and resources they can mobilize.
On a scale of 1 to 10 (10 = high), assess how much influence the person or group has; think in terms of their informal power, rather than the authority they have. For example, a trusted consultant may have very high influence but relatively low power.
You can then plot each stakeholder on the grid and gain a visual appreciation of where the balance of stakeholder positions lie. Those with both high power and influence need to be managed closely in order to retain momentum and turn around any detractors. Those with high power and low influence should be kept satisfied. Those with high influence and low power need to be kept informed, and not feel neglected. Remember, these people can sway others’ opinions for the better or worse in their day-to-day interactions with other stakeholders. Finally, those in the lower left quadrant need to be monitored, in case their role changes.
Figure 26.2 shows a problematic stakeholder situation. Most of the advocates and supporters have low power and influence, but the two main detractors, Jim and Alan, have both high power and influence. Unless these two can have their views changed, the project is likely to founder. Mike is the only positive stakeholder who could influence the detractors but that would depend on his relationship with them. Robert and Sophie are not likely get involved as they have no position on the project, unless you can convert them into advocates.
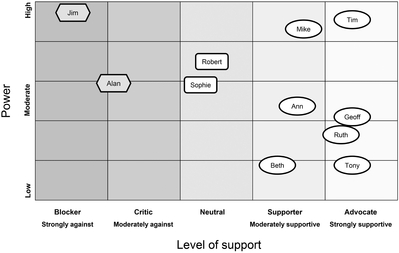
Figure 26.3 Power-support stakeholder map
The power-support shows each stakeholder’s stance on the project, plotting their level of support against their power.
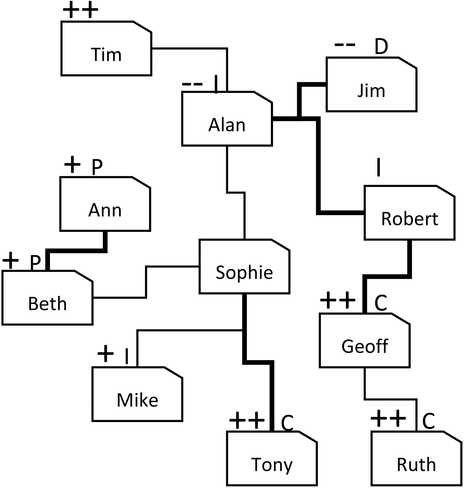
Figure 26.4 A stakeholder relationships map
This map shows the relationships between individuals and group, and can therefore help you identify different routes to engaging each stakeholder.
Power-support map
The power-support map is an alternative way of viewing the data to that shown in the power-influence map. Plot each stakeholder’s stance on the project, showing their level of support against their power (Figure 26.3).
I have plotted this for the same project as we used in the other two maps. The marked difference between the two detractors, Jim and Alan, and the backers, becomes obvious. This project certainly has a groundswell of support from the less powerful stakeholders, but they also have Mike and Tim on their side. Would this be enough to ensure the success of this project? Without understanding the project, its aims and the interests of each stakeholder, it is impossible to determine.
Stakeholder relationships map
This map shows the relationships between individuals and groups and can, therefore, as shown in Chapter 17, help identify different routes to engaging stakeholders.
For instance, if the example project is to succeed, Jim and Alan’s attitude needs to be changed. Jim and Alan have a close relationship, with Jim, as decision maker, being influenced by Alan. Perhaps, if Alan could be persuaded of the merits of the project, he would deal with Jim. As it happens, Tim, Sophie, and Robert all have access to Alan. Robert’s relationship is stronger, but he doesn’t seem to care about the project. Tim cares a great deal but his relationship with Alan is more remote. You could, therefore, try to influence Robert, so that both he and Tim could take on Alan, who, in turn, could deal with Jim. You might also look at why Robert and Sophie are neutral to the project. They both have a relationship with Alan, so they might really want the project but do not want to jeopardize the relationship with Alan, whom they both know to be antagonistic towards the project.
You can tailor this map in a number of ways to show other aspects by adding “qualifier” tags to the named boxes.
Plan how you will engage them
Having determined who your stakeholders are, both as individuals and groups, plan how to approach them. The stakeholders will fall into two broad groups:
- positive stakeholders, who are well disposed to the changes you intend to make;
- negative stakeholders, who are antagonistic to the project outcomes and may work to undermine your objectives.
There may also be others who appear to be neutral to your project’s aims. They need to be watched with care, as apparent neutrality can often hide real negative feelings. They could also be persuaded either way, for or against.
For each stakeholder, determine how to approach them, either to neutralize their negative feelings or harness their positive attitudes. For the groups, tie this in with your communications plan. Identify the activities, resources, funding and time required for this work and build it into your project plan. Such work is not cost-free but if you are looking for success, it is not optional. Think how much time politicians spend on stakeholder management when seeking election or a higher office in government. Like politicians, use quantitative measures to determine how well your stakeholders are engaged. These metrics can be very simple, for example the level of attendance at user group or stakeholder forums, or more sophisticated, relying on statistical sampling in the form of well-designed surveys.
Nothing, however, can replace maintaining personal contact and gauging attitudes on an ongoing and informal basis. Do not underestimate the benefits of walking around and talking to people to assess what their feelings are and how their colleagues are disposed. People are far more open in an informal setting; I can’t count the number “unexpected!” meetings I have engineered near a water cooler, in the company café or at a favourite pub.
Engagement and monitoring
Checking the mind-set of stakeholders throughout a project is essential if you are to achieve your aims. As time passes, attitudes will change. Some who were positively disposed may become antagonistic and vice versa. Unless you keep up to date, your engagement plan and activities may be misplaced or even detrimental. Having identified any issues, take action to put your plan back on course. Don’t forget to use supporting processes, such as risks or issues management to highlight particular problems but be careful how you phrase those connected to individuals or groups of stakeholders.
Not only attitudes will change, but the stakeholders list itself will also alter over time. New people will appear and old ones will become less relevant. Review the completeness of your stakeholder list at frequent intervals and then analyse and plan for any new stakeholders or changes in attitude. Stakeholder engagement activities will only end after the outcome of the project has become clear. As such, stakeholder management is required throughout the project life cycle, starting when the proposal is formed, running through the investigative and “doing” stages, right to the end of the project.
Signs of resistance
When working with your stakeholders, look for signs of resistance, some of which are listed in Table 26.1 .
Be careful, as these signs can be misread. Sometimes they do not reflect resistance at all, but a genuine concern to “get it right” and I have indicated some of these alternative views in the table. Don’t take just one sign of resistance and act on it. Look for clusters of behaviours which reinforce each other. It’s no different to reading a person’s face rather than just hearing their words. Angry words with a smiling face may simply be a joke. Angry words with an angry face are likely to be the real thing. If you need a person on board, take time to investigate their concerns – they might be right and if they believe you care about their opinions they may turn into your greatest advocate. On the other hand, you might just have the right project at the wrong time. You may know that an organization needs a new capability, facility or whatever which would significantly improve the organization’s performance, but if the key stakeholders either don’t agree or are distracted, even the best idea will fail. Feedback from stakeholders will tell you if your project is in that situation and if so, it is up to the sponsor and key stakeholders to trim or terminate the project to suit the reality.
Table 26.1 Signs of resistance
| Sign of resistance? | Or is it? |
| Postponing meetings on a regular basis | or they might really be busy |
| Attacking the detail to find one flaw and use it to discredit the whole concept | or they really could be experts in the area concerned |
| Promising everything but doing nothing | or they may simply lack the resources |
| Referring to the "real world" to infer the proposal is an academic pipe dream | or they may see real flaws |
| Asking for more detail and no matter how much you give, it is never enough | or they really do have a genuine concern |
| Flooding you with detail to "prove" you do not understand what you are doing | or they are passionate about helping you see another point of view |
| Silence. If you want people to act, you can never assume silence as meaning consent | or they may be busy on other things |
| Attacking your methodology They ask so many questions about the method, you never have the chance to discuss the real issues raised by the change | or they may have experience which they wish to share |
Why communications?
Whilst engaging some stakeholders face to face and on an individual basis is possible and desirable, you need to address any larger groups in a different way. This is where good communications are essential to project success. A common understanding of what the project is about and how different stakeholders are affected will increase commitment and reduce opposition. Communication is about giving people the information they need so they can do their jobs properly, make decisions, and gain a common understanding. Information must be timely, two-way, open, honest, and fair. It must also be seen in this way by the people receiving it. Both the sent message and the received message must be the same and be understandable. You need to establish:
- who the audience is;
- what the message is;
- when the message is to be delivered;
- how the message is to be delivered; and
- how effective the communications are.
There are many reasons for communicating, the commonest being to inform, influence and instruct (see Table 26.2).
Table 26.2 Reasons for communicating
| Purpose | Example |
| Inform | to publicize success to let them know where to find more information |
| Instruct | to provide people with enough information to do their jobs properly to tell people to undertake specific, required actions |
| Influence | to gain commitment through understanding to move opinions |
Communications are about informing, instructing, and influencing
You should also differentiate between “communications” and “reporting”. In some standards this is not made clear. Reporting happens within the project team and includes reports from the team managers to the project manager and reports from the project manager to the project sponsor. It may include others “in the know”, such as user groups or the project board or managers of those employed on the project. Reporting should be regular, routine, and in a consistent format; it is an essential part of a project’s information flow and hence governance. On the other hand, communications go to people outside the immediate project team. They can be any in any media as long as it takes the message to the right people. Often multiple approaches are used to gain people’s interest. Communications need not be regular, although sometimes a “newsletter”, or similar, can be used.
Right audience, right message, right time, right media
There are many audiences to consider, often with different needs. Everyone with an interest in a project, direct or indirect, needs to know what is happening. Effective stakeholder identification and analysis will ensure the audience is identified and what their interests are.
Having identified the audience, consider what kind of information is needed, for example:
- how they, and the way that they work, will be affected;
- how the change will benefit their work and help provide quality service to customers; and
- how this change relates other ongoing changes – remember change on change on change can look like “chaos” to the uninformed observer.
Different groups may need different messages and you may need to tailor what you say to suit their circumstances and even the type of language they use. Be careful to ensure you are consistent across all your messages and not telling different groups contradictory stories. How you time communications is governed by the following considerations.
- is there something important to say?
- is action needed from those you communicate with?
- is the change about to affect the people you communicate with?
- is a significant milestone due?
Remember, communication involves lead times which, in the case of established channels (for example, internal newsletters, internal web casts, business newspapers, magazines, radio and TV), are beyond your control and you need to take this into account when planning to ensure deadlines are captured and tracked within your overall project plan.
Having defined your communication aims, what you want to communicate, when and to whom, you will need to choose the most appropriate way of doing this. Most large organizations have a number of channels you can use and many employ communications specialists to help. On some projects, communications will be a significant work package which may be handled by a specialist contractor or team manager. As project manager, you still have ultimate responsibility for ensuring all communications support the aims of the project.
Communications plans are used to capture this information. They can take many forms but typically include the topics listed in Table 26.3.
Table 26.3 Communications plans
| Key audiences | Segmentation of the audiences as defined in the stakeholder analysis. |
| Key messages | Statement of the key messages to be drawn on throughout all communications, who is the key provider and what the intended impact is of delivering the message. |
| Channels | Communications channels which are available for use. Include both "transmit" and "receive" channels. |
| Communications plan | Listing of planned communications events. |
| Measuring effectiveness | Method of gauging feedback and the success of the communications events. |
| References | List of the documentation which is referred to in this document. |

Figure 26.5 A typical communications road-map or plan
A typical communication plan showing the target audiences, timing and the media used. A similar approach can be used to show the timing of key messages to each audience, rather than media.
Presenting the plan in a graphic way is also helpful, as in Figure 26.5 above.
In a similar way, you should plan each communication event, making sure you can answer the questions in Table 26.4 below.
Table 26.4 Communications questions
| Area | Prompt questions |
| Objectives Driver | What is the change really about? What is the case for change? What are the key changes being proposed? What are the key milestones? |
| Specific purpose Why | What do we want to achieve through this communication - Why are we doing it? Inform? . . . why? Instruct? . . . to do what?. . . . why? Influence? . . to do what? . . . . why? |
| Audience Who | Who do we need to communicate with? Who do we need to take action as a result of this communication? Change behaviour, be aware? Which people/groups are critical to success and which aren't? |
| Internal issues | What is the current culture, behaviours, attitude, or expectation? What else is going on that may affect audiences – do we need to coordinate timetables? |
| External issues | Will our communication have an external impact? News; PR; City; customers; suppliers, etc. |
| Messages What | What are our messages we need to put across? Do we need to tailor different messages for different audiences for different objectives? |
| Channel How | Where are our audiences? How can we communicate with our audiences? Which channels/media are most suitable and which can we use? |
| Accountabilities Who | How should we allocate tasks and delivery accountability? Do we have the communication skills/resources to achieve our objectives? Have we allocated accountabilities? |
| Timing When | When do we need to communicate to each audience? |
| Measuring effectiveness and feedback | How do we measure the effectiveness of the communication against the objectives? How do we receive feedback form the targets (if required)? Have our messages been understood? Does what we have learned affect any follow up communication plans? |
Were your communications successful?
You may have had the right message, going to the right audience at the right time but was it enough? Did anyone see or hear what you said? Did they understand what you wanted? Did they react in the way you wanted them to? Unless the answer to all these questions is “yes”, you may need to start again. If they understood the message but then responded in the way you least wanted, it could be damaging: in the public domain, users of social media can be very explicit and cruel. In a company, people tend to be more polite and might keep a low profile but attack the project quietly over a drink with friends. You must therefore evaluate your communications to understand the effects of what you are saying. There are many ways of soliciting feedback, for example, interviews, questionnaires, surveys, and you should check whether your communications are effective in three general areas:
- What has been learned?
- What was liked or disliked?
- What is still needed?
Table 26.5 Measuring company media
| Channel | Measure |
| Company news sheet | For printed news sheets you will only know how many were sent out, not if any were read. If an on-line newspaper, you can monitor how many people accessed the pages and how long they spent on each page. |
| Web conference broadcasts | Attendance is the main indicator as a number as a percentage of those invited. How long did people stay on the call? Some facilities have features to survey the participants and gain immediate feedback on content. |
| Web conference recordings | These are used to record live conference broadcasts, aimed at those who could not attend. You can monitor how many people accessed the recording. I found usually double the number of people accessed a recording than attended the live event. |
| Percentage number of read receipts but some people will not allow read receipts to be sent. | |
| Project specific newsletters | This is something that people may opt to receive or not receive. Measure would be the number of current recipients; number of new recipients; number of lost recipients. Specific feedback and requests for articles. |
| Events | Number of attendees. Level of satisfaction with the event and the information provided, whether they will attend subsequent events. General comments about presenters, content and style of event or via an exit feedback form. |
| Podcasts | Number of participants. Number of questions and advice sought, its relevance to the podcast and depth of engagement shown via questions. Number of volunteers for specific tasks. |
| Web sites and blogs | Number of hits and clicks through. Time spent on each page. Specific information sought and downloaded. Feedback provided on each page/blog. |
| Meetings | Number and level of attendees. Actions taken as a result of the meeting. |
It is difficult to build a complete picture but because something is difficult it doesn’t mean it should be ignored. Table 26.5 lists some commonly used company media and how you might measure them.
When designing any media, always consider how people can get in touch if they have something to say or ask. Always provide information on whom they can contact and make sure every web page has a simple “feedback” button, with a form they can complete.
![]() Raising awareness in your chosen audience
Raising awareness in your chosen audience
I was implementing an enterprise-wide programme and project management method at a major company with over 100,000 people worldwide, of which 5,000 considered themselves “project professionals”. One issue raised was the method was designed for the practitioners already in the profession while, in reality, many projects were being run by “accidental project managers” who found the new method a bit daunting. I decided to create a video, “The essence of project management in 15 minutes” which covered all the basic principles. To promote this, we used the profession’s internal news channel, but, as the “accidental project managers” weren’t in the project management profession, they would not see these news releases. We therefore took a four-week slot on the company’s internal web site home page, which simply had a still shot from the video and the title. By combining the promotional media (company web site) with the message media (video) we had over 12,000 viewers; this was a significant proportion of the management staff in the company and almost three times the number in the project profession. In addition, as we encouraged people to feedback, we received pages of very positive comments and mostly 5* ratings for the video.
 Workout 26.1 – Stakeholder communication planning
Work with your project team using the output from Workout 17.6 on stakeholder identification and influence mapping.
- On a flip chart, brainstorm the following for each stakeholder:
- the messages you need them to receive;
- possible methods/media or people you could use to communicate with them;
- frequency of communication.
- Consider, if you were them, what you would want to know and when. Aim to see things from their perspective. If possible, ask them!
- On a large sheet of paper or a white board, list each stakeholder along the top.
- Decide who should receive the standard regular progress report. Put an asterisk over the relevant stakeholder to indicate this.
- Brainstorm the possible communications to send out to the stakeholders. Write each on a Post-It® Note. Place these on the chart on the left-hand side, in chronological order.
- On smaller Post-It® Notes, add a tick to show which stakeholder(s) is/are “hit” with each particular communication.
- Review how frequently each stakeholder will receive a message. Is it too often? Not frequently enough? Rearrange the Post-It® Notes until you create a plan the team is comfortable with (see Figure 26.5 for an example plan).
- Focus on your key stakeholders and create a separate sheet, just showing them; make sure the messages and number of communications are right for each of these.
- Transfer the key communications to your schedule plan and “fix” the plan onto your white board by rewriting directly onto it rather than onto Post-It® Notes.
Do not be concerned if you cannot always see very far into the future. The objective is to make sure you consider whom you need to communicate with, when and how, while you also need to be able to react quickly to any emerging situations.
 Workout 26.2 – Stakeholder communication tracking
Using the same white boards from Workout 26.1, simply write the communication made and the date on the left-hand side, ticking the relevant stakeholder columns similar to that shows in Figure 26.6.
You will thus build a listing from which you will easily see who you have missed. You can then work both from your formal plan and add extra communications when you see these as desirable. You will also be confident that they look rational and consecutive to the recipients.
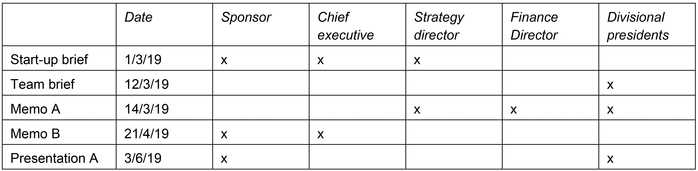
Figure 26.6 Stakeholder communications tracking
A simple grid can be useful for tracking which stakeholders receive which communications and that each stakeholder is not ignored nor bombarded with too many messages.
Always check your stakeholders continue to support you
Copyright © 2016. Robert Buttrick