Chapter 4
Three More Variables and Voilà!
Businesses have nearly infinite operational possibilities. A company always starts with an idea that can be sold, such as an internet search engine algorithm or a clothing line. Then that idea or business model must first be expressed in terms of an income statement. What are the start-up costs? What is the cost to produce and deliver the product? How will the product be priced? How much will the corporate overhead be? If your business requires real estate or equipment, how much money will be required every year to maintain or replace assets used in the business?
Operational questions pertaining to business investment are no less numerous. How will your product be made? How much real estate and equipment do you need to make the product? Can you outsource any of the product manufacturing? What are your inventory needs? Do you have to provide deposits against inventory orders? Can you get terms from your trade vendors? How fast will your customers pay you? Can you get customer deposits?
In all business models, there is a cycle of interdependence. Operational fundamentals reflected in your income statement are key to the determination of your business investment and OPM, which comprise the first three universal business model variables. In turn, your business investment and OPM are impacted by the income statement, which is the source of the final three universal business model variables.
We have already discussed the three variables pertaining to business investment and the amount and cost of OPM. This leaves the remining three important variables that are associated with the income statement.
Variable #4: Sales
Sales is where every business starts. Sales is principally a function of customer count, product price, and average purchases per customer. For the purposes of our analysis, sales are shown on an accounting basis, meaning that they are accrued and not cash sales. In many financial models I have seen, companies do what is called a cash budget, and so only show sales happening when the cash is received. Here, thinking of the discussion in chapter 2, Daymond John's first sales order was for $300,000, and so the sales would be shown as soon as the garments were delivered to the customer, even though the cash from the sales would not be received until four months later.
In my approach, using a cash budget approach is unnecessary, which means that accrual-based, accountant-prepared numbers are just fine to use. The fact that the cash from sales may not be immediately collected is already taken into consideration by virtue of the definition of business investment, which includes the cash flow lag represented by accounts receivable as an investment.
Variable #5: Operating Profit Margin
This is the amount of earnings before interest, taxes, depreciation (and other non-cash accounting conventions), together with the rent expense you have on assets you could otherwise have elected to purchase (EBITDAR) shown as a percentage of revenues. When it comes to rents, you might have to lease office space or storefront space in a multi-tenanted building, which you would never have otherwise purchased. That type of rent is simply an annual expense. Then there is the rent on free-standing buildings or aircraft or machinery that you could have otherwise purchased. The proceeds from lease providers used to purchase these assets are a part of OPM and so this expense is backed out of operating expense to compute EBITDAR. Depreciation is an accounting non-cash convention designed to mimic a charge for wear and tear use of building and equipment you own and, like all non-cash accounting numbers in our definitions, is excluded. As with sales above, expenses can be derived from accountant prepared financial statements, even though the expenses may not all be in cash. That is because accrued expenses and trade payables are embodied as a deduction in the definition of business investment. With that said, computing an operating profit margin is simple:
It is important that company expenses include market compensation to be paid to the leadership group. When leaders are the founders or shareholders of a company, they often exclude their own compensation when creating a business model, simply thinking that they will be paid from corporate profits. In doing so, they miss an important point: If they were not there, they would have to hire someone else to run the company. The idea is that the operating profit margin should be there to cover the cost of OPM, the cost of annual maintenance capital expense (the discussion for this cost follows), and the returns to equity investors. You should never mistake market-based employee compensation for your equity return.
Variable #6: Annual Maintenance Capital Expense
Also called “maintenance capex,” the final income statement variable is actually not an accounting income statement expense at all. The presence of this variable is another example of where finance and accounting diverge. Accountants use depreciation as a proxy for maintenance capex, but, since it is a convention, the number will be wrong.
STORE Capital is a poster child for how depreciation conventions deviate from reality. Annually, STORE records significant amounts of depreciation expenses on the real estate it holds. Yet, over the company's history, real estate sold has realized aggregate prices that have exceeded its cost. In other words, the real estate did not depreciate in value at all, which is why investors customarily ignore this expense when looking at the financial performance of many real estate-centric businesses. Real estate is far from alone with depreciation conventions that can part ways with reality. Businesses owning assets ranging from heavy construction equipment to aircraft often have income statements loaded with depreciation expenses that exceed actual costs associated with wear and tear.
Since every accounting entry has an opposing entry, the opposing entry to depreciation expense is a corresponding reduction in asset cost. As with the frequent errors associated with wear-and-tear estimation, this is also wrong, because the prices of hard asset investments never change unless you sell them or add on to them. Non-cash accounting conventions like depreciation simply do not reflect financial reality, which is why I exclude them.
If you have a business that requires the use of real estate or equipment, you will absolutely have annual costs to maintain or replace the assets, and you should estimate the annual amount of these future costs. Chances are that, in earlier years, maintenance capex will be low, since new equipment or real estate requires less upkeep. Later on, the maintenance costs can be expected to rise. For example, if you operate a consumer-facing business, you may want to remodel your storefront every five years to have a fresher look. From a financial point of view, such costs should be averaged and included as an annual corporate expense. I cannot tell you how many times I have seen companies expend huge amounts on remodeled storefronts and call this a “non-recurring” expense. That is often a means for business leaders to exclude certain costs to make their near-term operating results look better than they really are.
Putting the Six Variables Together
With the Six Variables defined, it is time to illustrate how a company works. To make things simple I chose a restaurant. The first company I helped take public in 1994 was initially exclusively devoted to financing restaurant real estate, and restaurants tended to have comparatively simple business models. Here is the illustrative model that we will use throughout this book:
Restaurant Case Study
| 1 Business Investment | $1,000,000 | |
| 2 Sales | 1,500,000 | |
| 3 Operating Profit (EBITDAR) | Profit margin is 20% of revenues | 300,000 |
| 4 Maintenance CapEx | 2% of business investment annually | 20,000 |
| 5 OPM | OPM is 75% of business investment | 750,000 |
| 6 Interest and Rent Expense | Cost of OPM is 9% | 67,500 |
| 7 Pre-Tax Cash Flow | 3 - 4 - 6 | 212,500 |
| 8 After-Tax Cash Flow | 75% of cash flow | 159,375 |
| 9 Equity | Opposite of OPM (25% of business investment) | 250,000 |
| Return on Equity | ||
| Pre-Tax | 7 ÷ 9 | 85.0% |
| After-Tax | 8 ÷ 9 | 63.8% |
The model is designed to compute the current corporate return on equity, which is the foundation for wealth creation. I placed in bold the Six Variables comprising the model. Actually, there is a seventh variable, which is the income tax rate, which I assumed to be 25%. Therefore, the after-tax cash flow on line 8 is 75% of the pre-tax cash flow. As we move forward, I will often ignore taxes because the taxes from the earnings of most companies in America are passed through to their shareholders.
Our restaurant cost $1 million in business investment, does $1.5 million in sales annually, has an EBITDAR profit margin of 20% of sales, spends 2% of its original business investment annually in maintenance capex, has annual interest and rent expense (OPM cost) of $67,500, and delivers $212,500 to its shareholders. To fund the business investment, the shareholders were able to borrow or lease 75% of the money at an annual cost of 9%. Comparing the restaurant's pre-tax cash flow to the YOM equity investment of $250,000 results in a current pre-tax return on equity of 85%. The current after-tax rate of return is 63.75%.
You are potentially thinking that an 85% annual pre-tax rate of return sounds too good to be true. The average return on stock and bond investments is a fraction of this. In fact, the returns from an investment in Berkshire Hathaway (which became a STORE shareholder), led by legendary investor Warren Buffett, approximated 20% from 1965 through 2020. I would note that Berkshire Hathaway is a taxable corporation and so might be compared to the after-tax corporate rate of return here of 63.75%. In my experience, however, such high rates of annual return are not uncommon.
There are three important items of note.
First, this sample model is for a single restaurant and so has far more risk than a large and highly diversified company like Berkshire Hathaway.
Second, the model excludes debt principal repayment, which will lessen the cash current ROE slightly because the total OPM payment is typically higher than just the interest cost.
Finally, the return on equity is just a current rate of return. The Six Variables can and do change from year to year, sometimes a lot. You can easily guess where the real variability lies: The three largest numbers of business investment, sales, and operating profit margin. These tend to be the principal drivers of future growth as well as performance volatility. The remaining three variables are comparatively less significant and less variable. Assuming you have shopped hard to understand your OPM alternatives, changing the OPM and equity mix can be a challenge. Same with the OPM interest cost. More than this, OPM interest cost and maintenance capex tend to be smaller numbers, which means that changes in these variables will be less impactful on equity returns.
The truth is that successful businesspeople create impressive business models capable of generating gargantuan rates of return on their initial equity investments all the time. Think of any self-made billionaire in the Forbes 400, and their historic cost basis in the equity of their company is likely small. Sergey Brin and Larry Page were doctoral students when they conceived Google, and Daymond John was working out of his home. Basically, the small relative investments they collectively made in companies that became highly successful allowed their equity returns to approach Mort's Model and be almost too high to count.
Another important characteristic of the self-made members of the Forbes 400 is that the companies they founded were highly scalable. This stands in contrast to our restaurant. Restaurants tend to have little operating leverage, which is the ability to grow revenues with minimal added business investment. For our restaurant operator to materially grow revenues, new restaurants will have to be built, requiring a corresponding increase in business investment. As a result, there were just six members of the 2021 Forbes 400 list of wealthiest Americans whose net worth was centered in restaurant operations. Of these fortunate few, five benefited not simply from food service operations, but from other activities, such as product sales, franchising, and real estate rental revenues, as well. Generally speaking, restaurant business models are simply not good enough to earn inclusion into this elite status.
As noted earlier, business model variables can and do move around. Sales and operating profit margins can change. The capital stack can also change. For instance, we are starting out with a company using 75% of OPM and 25% of equity. However, if you repay the OPM, then the mix of equity will correspondingly move up, which will lower the current equity rates of return. Then there is revenue, which can be subject to constant change. If sales were to rise by 5%, then the current pre-tax return on equity would rise to 91%. With another sales increase of 5%, the current pre-tax equity return would rise another 6% or so to 97%. While it's common for business professionals to evaluate investment opportunities using multiyear models, business model variables can and do change frequently from year to year in ways that can materially alter current equity returns.
Gordon Growth Model
If our simple restaurant financial model shows just the current annual rate of return, what might be the total rate of return? A common way to think of this is to use a variant of what is called the Gordon Growth Model, which simply adds a constant growth rate to a current rate of return, to arrive at a total expected rate of return. Taking our initial model, let's assume that sales increase 5% annually, resulting in a long-term equity return growth rate approximating 6%. To estimate total expected pre-tax equity rates of return, all you need to do is to add the 6% in annual return growth to the beginning 85% current pre-tax equity return to achieve an estimated total pre-tax equity rate of return of 91%.

In the case of our restaurant illustration, the current equity rate of return is high, while the expected annual rate of sales growth is expected to result in a low rate of return growth over time. On the other hand, most highly valued growth companies tend to have lower current rates of equity return, combined with materially higher expected annual growth rates.
The Gordon Growth model, also called the Gordon Equation, was devised by American economist Myron Gordon in 1956 while an associate professor at MIT and is widely used in the investment community. For example, through the end of 2019, our five-year average dividend yield at STORE Capital approximated 4.5%. Add that to the annual growth rate of our adjusted funds from operations per share (AFFO, which is intended to approximate a stabilized equity cash flow growth rate), which grew at a compound rate just over 7% annually, and you arrive at an expected average annual rate of return of better than 11%. For the five-year period from 2015 to 2019, our business model was reflected in our annual rates of return.
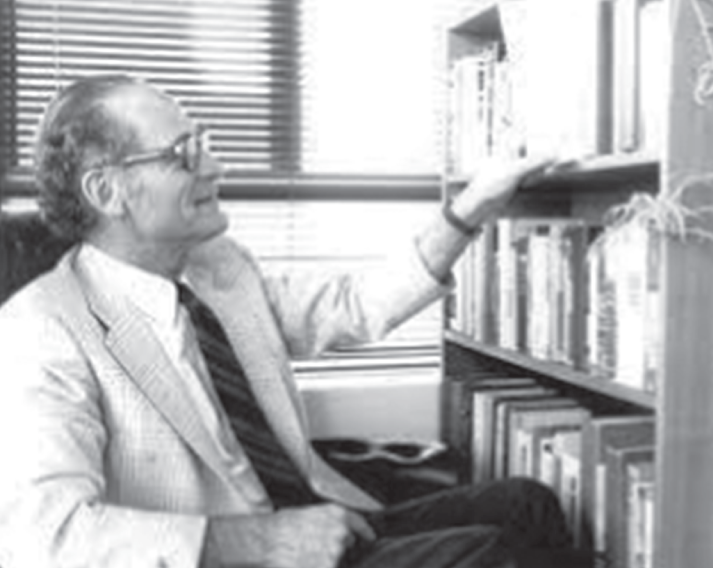
Myron Gordon at the University of Toronto in 1982
Credit: Jennifer Bremner/Joseph L. Rotman School of Management
With publicly traded companies, business model performance does not always result in near-term equivalent investor return performance. The public markets have a way of altering relative share values due to constantly shifting investor sentiments. As public company business leaders, there is little we can do about this. What we can do is to keep our eyes on our business model with the expectation that this will ultimately be reflected in our investor return delivery.
Equity Valuation
We are now at a key moment with a final question to be answered. After all your work to create your first successful restaurant location, what is the value of your business and how much wealth have you created? As I noted very early on, the notion of wealth creation is central to the formation of financially successful companies. Companies capable of generating equity returns that create equity market value added (EMVA) are the companies that can attract outside independent investor capital to help them fulfill their growth potential. In this case, the initial equity investment was $250,000, the current pre-tax equity rate of return is 85%, with a current equity return growth rate of 6% annually. Assume that the investment community would generally be acceptable with a current annual pre-tax rate of return of 20%, given the risk of your restaurant and its prospects for growth. In that case, you now have a company having an equity valuation multiple of 4.25X more than it cost as follows:
Equity Valuation Multiple Formula
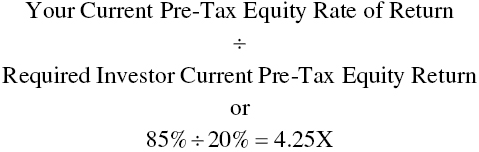
Your restaurant now has an equity value of $1,062,500, computed by taking your $250,000 equity investment and multiplying it by 4.25. After you have recovered your $250,000, the amount of wealth you have created is $812,500 ($1,062,500 − $250,000). That $812,500 is also your equity market value added, which is the value of your equity investment in excess of its creation cost.
Personally, I find it exciting that material wealth like this can often be created over a comparatively brief period, in this case by having a single successful restaurant location. What is more exciting is that this is simply where business wealth creation begins.
The Miracle of Compounding
Computing a total estimated pre-tax return of 91% by adding the current annual equity return achieved by the restaurant investment to its expected return growth rate is neat but is just the tip of the iceberg of the company's wealth creation potential. Successful companies capitalize on potent business models by reinvesting their free cash flows. In the case of the restaurant illustration, the after-tax cash flow available to reinvest after the initial year amounts to $159,375. What if this money could be reinvested into expansion at a similar 85% current pre-tax rate of return? And what if the current pre-tax rate of return of the reinvested free cash flows, like the returns on the initial invested equity, could be expected to rise 6% annually? And what if you could achieve similar results with subsequent future free cash flows over the first five years of your business? You have now altered the nature of your initial equity investment. That investment has been transformed from a single stand-alone enterprise to one benefiting from the availability of future recurring equity investments enabled by its growing after-tax free cash flows. By reinvesting your equity cash flows, you are compounding your current investment returns.
Here's how founding father and successful entrepreneur Ben Franklin described compound returns: “Money makes money. And the money that money makes, makes money.”
Leading physicist and Nobel laureate Albert Einstein reportedly once referred to compound interest as mankind's greatest invention.
Noted investor Warren Buffett frequently discussed the power of compound interest, famously noting, “My wealth has come from a combination of living in America, some lucky genes, and compound interest.”
The result of this compounding is that after tax annual cash flows could be expected to rise more than 70% annually, substantially more than the growth arising from 5% annual sales increases at a single restaurant location. In taking your initial equity investment of $250,000 and then reinvesting all your company's free after-tax cash flows, you end up having nearly $3.3 million in equity at cost at the conclusion of the fifth year, including the $1.3 million in fifth year after-tax cash flows that would be reinvested in continued growth the following year. The 5% sales increases realized each year enable the growth in current after-tax returns to reach nearly 70% by the fifth year, with the resultant equity valuation multiple rising to 4.65X. Best of all, your equity is now valued at better than $9 million, of which over $7 million (the $9 million company value less the $1.9 million equity cost) is EMVA. Equity value and equity at cost are each actually $1.35 million more if one were to include the cash flows from the fifth year that have yet to be reinvested in future growth.
Your $250,000 initial equity investment made money and reinvesting the money made by your initial equity investment made even more money.
From a single equity investment offering a solid return, but modest potential for growth, emerges a larger, more diversified business having far greater growth potential driven by the benefits of return compounding. As impressive as the results are, they can get even better. The current pre-tax equity return investor hurdle rate of 20% could be expected to drop materially with the company's radically elevated growth, size, and diversity. Cutting the hurdle rate as a result of the material added growth would stand to add to EMVA, potentially significantly.
Five-Year Company Model with No Dividend Payout
| ($000’s) | Year 1 | Year 2 | Year 3 | Year 4 | Year 5 |
|---|---|---|---|---|---|
| Beginning Equity at Cost | $250 | $409 | $682 | $1,146 | $1,940 |
| Ending Equity at Cost | $409 | $682 | $1,146 | $1,940 | $3,293 |
| Current Reinvested After-Tax Cash Flows | $159 | $272 | $465 | $793 | $1,354 |
| Growth Rate | 71% | 71% | 71% | 71% | |
| Current After-Tax Return | 63.75% | 66.50% | 68.19% | 69.19% | 69.79% |
| Equity Valuation Multiple | 4.25X | 4.43X | 4.55X | 4.61X | 4.65X |
| Total Equity Valuation | $1,063 | $1,815 | $3,098 | $5,288 | $9,024 |
Dissecting Investment Returns
Investment returns are not hard to understand. They are generally only determined by three components: the initial amount invested, cash flows received and the change in investment value upon ultimate sale. In the case of the compounding illustration described earlier, the initial equity investment is $250,000, with the business paying no distributions, instead reinvesting the free cash flow into company growth. At the end of the fifth year, with the equity investment valued at over $9 million, the after-tax rate of return would amount to nearly 100% annually. That return is comprised of average current after tax rates of return approximating 67.5%, together with a change in value arising from the 4.65X equity valuation multiple at the conclusion of the fifth year. Of this return, approximately two thirds is derived from annual cash flows, with the remainder coming from the increase in equity valuation. Had the current pre-tax equity investor return hurdle rate fallen in half to 10%, the annual return would rise to 125%, propelled by a change in ending company value, which would deliver nearly half the expected rate of return.
(For the purpose of this return computation, I excluded $1.35 million in ending equity arising from the fifth-year free cash flow, which is sitting in the bank and awaiting deployment at the beginning of year six. I omitted the cash amount because valuing the company as a going concern implies cash flow reinvestment, which is essential to the high annual free cash flow growth rate. So, to the extent investors will pay up for growth as reflected in equity valuation multiples, the balance sheet cash is effectively already incorporated into the company's valuation.)
I like to understand where investment returns come from. Expected returns having strong contributions from current equity cash flows are less dependent on future equity valuation multiples, and are therefore less risky.
What would happen to equity returns if half of the annual after-tax free cash flows were paid out as dividends? First, the company would wind up having an ultimate equity valuation nearly 60% less than where it would have been with all its free cash flow reinvested in future growth. Annual free cash flow growth would likewise decline from 71% to 39%.
Five-Year Company Model with a 50% Dividend Payout
| ($000’s) | Year 1 | Year 2 | Year 3 | Year 4 | Year 5 |
|---|---|---|---|---|---|
| Beginning Equity at Cost | $250 | $330 | $440 | $594 | $807 |
| Ending Equity at Cost | $330 | $440 | $594 | $807 | $1,103 |
| Current Reinvested After-Tax Cash Flows | $80 | $111 | $154 | $213 | $296 |
| Growth Rate | 39% | 39% | 39% | 39% | |
| Current After-Tax Return | 63.75% | 67.16% | 69.80% | 71.80% | 73.28% |
| Equity Valuation Multiple | 4.25X | 4.48X | 4.65X | 4.79X | 4.89X |
| Total Equity Valuation | $1,063 | $1,476 | $2,049 | $2,844 | $3,944 |
When it comes to the expected rate of investment return, the loss of compounding by distributing half the annual free cash flow would lower the after-tax rate of return from 98% to 91%. With an ability to only reinvest half of the free cash flows into growth, I tend to prefer using what is called a modified internal rate of return computation, which assumes that the reinvestment rate of the distributed cash flows is going to be different from the return produced by the investment. In this case, if one were to assume that the reinvestment rate falls to 10%, which would be closer to the long-run return posted by the S&P 500, the return falls to 77%, with current cash flows (including those distributed) comprising approximately 90% of this amount.
IRR for a Five-Year Company Model with a 50% Dividend Payout
| Year | ||||||||
|---|---|---|---|---|---|---|---|---|
| 0 | 1 | 2 | 3 | 4 | 5 | |||
| Initial Investment | (250) | |||||||
| Dividends | 80 | 111 | 154 | 213 | 296 | |||
| Residual Value, Net of Tax | 3,308 | |||||||
| Total | ($250) | $80 | $111 | $154 | $213 | $3,604 | ||
| After Tax IRR | 91% | |||||||
| Modified IRR | 77% | |||||||
Business model fundamentals and growth prospects vary widely, which can greatly alter return dynamics. In our restaurant illustration, the expected 5% unit-level revenue growth is modest, which is typical of a mature industry. Business models that address newer industries and large markets offering elevated growth potential will look far different. Making two simple changes to the operating margin and growth assumptions in our business model provides an illustration:
Model with 15% Operating Margin and 35% Growth
| ($000’s) | Year 1 | Year 2 | Year 3 | Year 4 | Year 5 |
|---|---|---|---|---|---|
| Beginning Equity at Cost | $250 | $353 | $558 | $951 | $1,696 |
| Ending Equity at Cost | $353 | $558 | $951 | $1,696 | $3,095 |
| Current Reinvested After-Tax Cash Flows | $103 | $205 | $393 | $744 | $1,399 |
| Growth Rate | 99% | 92% | 89% | 88% | |
| Current After-Tax Return | 41.25% | 57.98% | 70.50% | 78.26% | 82.53% |
| Equity Valuation Multiple | 2.75X | 3.87X | 4.7X | 5.22X | 5.5X |
| Total Equity Valuation | $688 | $1,365 | $2,622 | $4,963 | $9,329 |
With no dividends paid, the return result from compounding approximates that of our initial example. The relative return contributions of cash flows and ultimate value change is also similar. What is different is the rate of cash flow and current after-tax equity return growth. Relying on such growth imposes greater risk that the ultimate expected rate of return will be attained.
Given the power of reinvested free cash flows to elevate returns, most rapidly growing companies having potent business models choose to limit dividend distributions or share repurchases. Taking money out of such companies simply imposes performance drags.
Founding a business blessed with a solid business model capable of EMVA creation and then turbocharging EMVA growth through return compounding is among the most assured and fastest means to create material wealth that I know of, and follows a well-worn path forged by the wealthiest among us.