Chapter 11
A Look at Public Companies
On August 19, 2004, approximately nine years after its founding, Google launched its initial public offering (IPO), selling 22.5 million shares (about 7% of diluted equity), netting the company over $1.9 billion. The company hardly needed the money. Google had long transformed its idea for a superior internet search engine into a potent business model, and at the time of its IPO was sitting on nearly $550 million in cash and no debt.
By the end of that year, the company's cash hoard had grown to $2.1 billion. A year later, the company would have over $8 billion in cash and the cash balances would grow uninterrupted from there. By the end of 2019, the company was sitting on a pile of nearly $120 billion in cash and was debt-free.
If you are wondering why Google felt the need to go public, it wasn't for the money. It was for the enhanced corporate valuation and for the liquidity offered to employees and founding shareholders, including Larry Page, Sergey Brin, and various sophisticated private and institutional early investors. Between the company's IPO and the end of 2019, the two original founders would each divest more than $10 billion in shares and yet still retain stock valued at more than $25 billion each. Given that they hold class B shares that provide them with 10 share votes for every share of stock they hold, at the end of 2019, Larry and Sergey controlled over 51% of the voting power of the company. By that time, the company they founded had also become the fourth to ever reach $1 trillion in market value. Cumulatively, Google (later folded into a holding company named Alphabet) had created an astounding $689 billion in equity market value added, helping propel many of its early shareholders and employees into the ranks of the ultra-wealthy.
During the 15 years between its 2004 public offering and the end of 2019, Google had no need to use the public markets to issue added shares of stock. Meanwhile revenues climbed at nearly a 35% compound annual rate from almost $1.5 billion at the end of 2003 to over $160 billion in 2019. During that period, Google would materially grow its initial internet search engine franchise. At the same time, the company aggressively expanded through corporate acquisitions, purchasing over 230 companies engaged in diverse technology-centric business activities. Some of the company's biggest acquisitions included Motorola Mobility, YouTube, DoubleClick, Nest Labs, and Fitbit. Given Google's expansion into diverse products ranging from self-driving cars to computer manufacture, video sharing, web-based television, cell phone operating systems, home automation, and wearable technology, the company elected to change the name of the public company to Alphabet in 2015, reflecting its status as a diverse technology holding company. Still, over 80% of the company's 2019 revenues and most of its profits were derived from advertising activity associated with its internet search endeavors, with many of the new technological initiatives having limited near-term financial success. The company's most notable failure came with its largest single acquisition: the $13 billion buyout of Motorola Mobility, which it sold to Lenovo two years later for just $2.9 billion, though it retained much of the investment's intellectual property. All this change and product exploration was telegraphed to investors upon the company's IPO in an iconic letter from Sergey and Larry in which they noted they had no intention of ever being a conventional company. Indeed, they have not been a conventional company, which means that their business model is subject to constant change from the potent, simple model they originally brought to the table in their 2004 IPO.
Another name for a holding company that owns a variety of independent, free-standing, unrelated businesses is a “conglomerate.” Such companies can be difficult for analysts and investors to decipher because their financial statements tend to provide limited financial disclosure by business line.
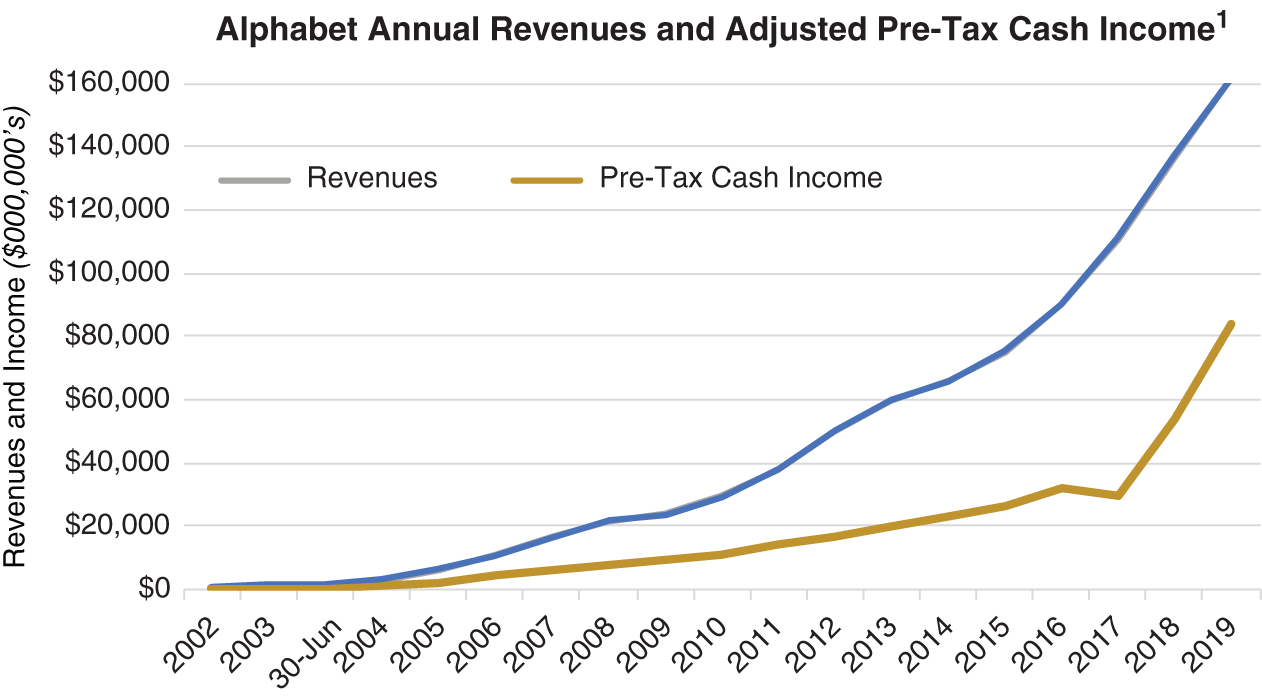
1Pre-tax income before non-recurring costs, depreciation, amortization, and non-cash compensation.
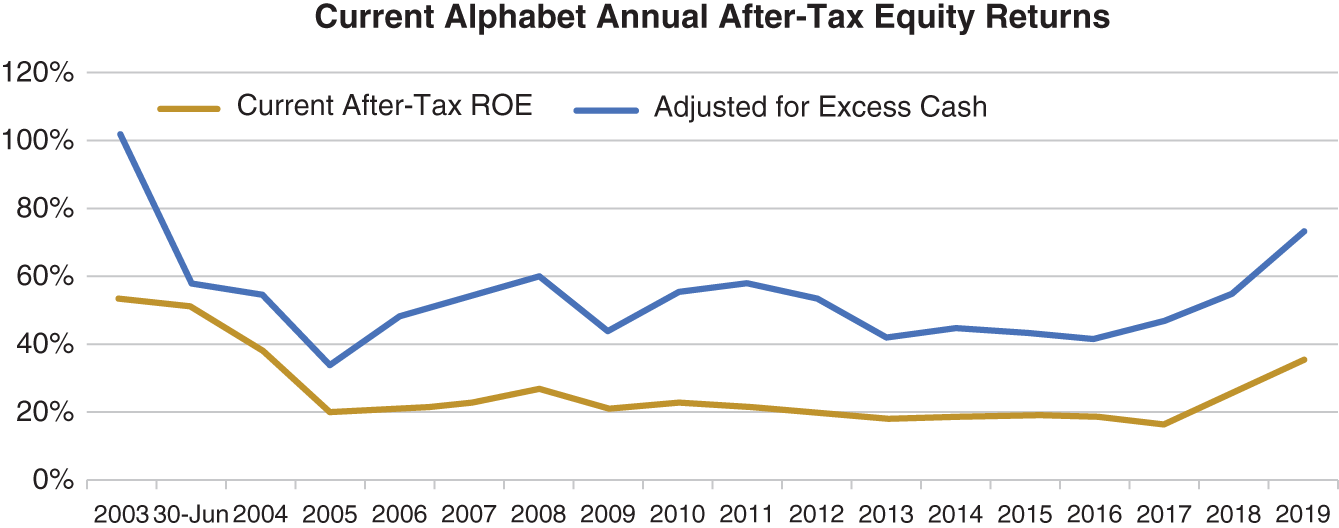
Over two decades of uninterrupted revenue and income growth, Alphabet impressively maintained an after-tax current equity return consistently in the area of 20%. What is really notable is that, by 2019, slightly over half of the business investment in the company consisted of cash, which was just sitting on the balance sheet. Were excess cash to have been returned to shareholders, after-tax current equity returns from year to year would have generally doubled, or occasionally tripled. There was a fair amount of current return volatility from year to year, but for Alphabet to achieve this kind of performance while realizing outsized compound growth was a rare accomplishment. All the more impressive is that the company achieved this kind of performance while absorbing more than 230 acquisitions. With that said, were one to have access to detailed business line performance, it would not be surprising to see highly divergent underlying current equity returns.
The following chart shows Google's sustained current after-tax equity returns since its IPO. Given the company's large cash balances, which elevate business investment and lower equity returns, I also elected to illustrate even more impressive returns eliminating the company's excess cash balances.
Of course, the Google investors who benefited most from the company's impressive annual current equity returns and return compounding were the original shareholders. This is because they enjoyed a material markup of their investment in publicly listing the company, serving to depress the comparative returns of subsequent shareholders. In recalling the earlier case study of the restaurant company used throughout this book, the current pre-tax equity return sought by third-party investors having similar risk and growth expectations was 20% annually. But the public markets can be generous, especially when they see outsized potential for growth. For 2004, Google's pre-tax equity rate of return approximated 46%. By the end of the year, barely six months following its IPO, Google's shares had nearly doubled in value, approaching a price of $200. Computing current equity rates of return using such a share price would yield an approximate current equity pre-tax rate of just 2%, or far lower than the 20% in our case study.
Google's equity valuation multiple exceeded 20X. However, at the time, Google investors were willing to make this bet, which centered on the earnings growth potential of its internet search franchise, together with further earnings growth expectations driven by the reinvestment of their small portion of the company's growing free cash flow at far higher pre-tax rates of return. They would be rewarded for their confidence.
In the previous chapter, I provided a case study example of a restaurant operator doubling the equity investment in the company using OPM equity while retaining over 88% of the ownership. Issuing shares to investors at unequal valuations means that a corporate current equity return no longer tells the whole story. In the case of Google, the $1.9 billion raised from its IPO represented close to two thirds of the company's equity at cost, while ceding just around 7% of company ownership. Corporate current equity returns do provide insight into the quality of a corporate business model, but they don't tell you much about how the returns are divided. With the share dilution from the Google's IPO, the current equity returns in 2004 for the founding shareholders were in the ballpark of 20X the current returns accorded to the new public equity holders.
With the equity investment relative to cost divided unequally from the outset, all equity holders would then proportionally benefit from Google's stellar future performance based on their ownership, with the shares multiplying in value by about 50 times between the IPO and the end of 2019. Not coincidentally, revenues likewise rose by about 50-fold.
Investors making the early bet to invest in Google were highly rewarded with returns well in excess of those realized by the broader stock market. In buying in at the IPO and having their 7% ownership of current equity returns reinvested in the company at its elevated rates of return, they participated in a like amount of future EMVA creation. Some of the wealth created from thin air would fall on them. Between Google's IPO and the end of 2010, investor returns approached 28% annually, trouncing broader stock performance indices.
Of course, as companies grow, “the denominator effect” starts to kick in, which is to say that as the company gets larger, it becomes more difficult to sustain outsized growth. In that vein, between 2010 and 2019, Google's revenues increased far less, growing 5.5 times, which was still impressive. Were you to have invested in Google's shares in 2010, the value of those shares would have risen about 4.6 times over that nine-year period, providing a compound annual rate of return of approximately 16%. While that figure represented strong performance, outperforming the roughly 14% annual return from the broader stock market (using the S&P 500 Index), this is still far from the results realized by the earliest public shareholders and light years from the returns realized by the company's founding shareholders, whose collective basis in the company's stock at cost was about 5% of that of the IPO investors.
When talking about a company like Alphabet, grouping the founding shareholders together does not tell the complete story. This is because the equity divisions between the company's founders, Sergey Brin and Larry Page, and early important shareholders, would not have been based on the cost basis of their respective equity contributions. Key early shareholders who helped to seed Google included Andy Bechtolsheim, founder of Sun Microsystems; Ram Shriram, a former executive with Netscape, an early internet search engine provider; David Cheriton, a Stanford computer science professor and serial technology entrepreneur; Jeffery Bezos, founder of Amazon; Eric Schmidt, who would serve as president of the company from 2001 to 2011 and then later as executive chairman; and John Doerr of the venture capital company Kleiner Perkins, who would also go on to serve as a board member of Alphabet. All these early shareholders would go on to be worth billions of dollars each from Google and other investments, with Jeff Bezos eventually rising to the top of the Forbes' 400 list of wealthiest Americans and claiming the title as the world's richest person. However, when it comes to Google, the division of equity value ultimately benefited the two initial founders the most. As graduate students at the time of the company's conceptualization, Sergey and Larry would ultimately be dependent on OPM equity, likely having little or no cost basis in their shares of the company, and ultimately serving as shining examples of the possibilities of realizing Mort's Model.
Determining Public Stock Equity Returns
The approach introduced in this book to computing current equity rates of return can be modified for stock market investors. Determining current corporate equity returns and the quality of a corporate business model using the V-Formula is informative but falls short of what it means to evaluate a company like Alphabet as a personal stock investment.
To do this requires that you compute Alphabet's EMVA and involves three steps:
- Compute the equity market capitalization of the company. The absolute easiest way is to use the company's equity market capitalization available from virtually any online stock quotation provider. Or you can look to a company's public quarterly (10-Q) or annual (10-K) Securities and Exchange Commission (SEC) filings to see the share count, which is typically in small type somewhere at the bottom of the first page. You can always get a link to corporate SEC filings from the website of any public company, or you can go directly to the SEC itself, which has a search engine called “Edgar.” To compute the company's equity market capitalization, simply multiply the number of shares by the daily stock price.
- Compute the cost of Alphabet's equity. To do this, I look at the financial statements of the company, adding the cost of the cash assets of a company and subtracting from this cost the cash obligations, or liabilities. I ignore such balance sheet items as accumulated depreciation, together with non-cash accounting conventions, such as “right to use” assets or liabilities or straight-lined rents.
- Compute Alphabet's EMVA as follows:

To determine equity returns available to shareholders requires various V-Formula adjustments using EMVA. This is because a current shareholder cannot buy Alphabet at cost. The company has been marked up and the amount of that markup is equal to EMVA. This means that business investment, from the viewpoint of a shareholder, cannot be simply computed from the company point of view. EMVA added or lost must be incorporated into the equation as follows:
Chances are that you may not be able to figure out the rents on “Land, building, furniture, fixtures and equipment you could buy, but rent instead.” If you can't figure this out, it's all right. The V-Formula will still compute current equity rates of return. On the other hand, if you have an idea how much reported rent expense is for items that might otherwise have been owned, then “capitalize” the rent expense into business investment as follows:
I prefer to take this approach whenever I can to make companies more comparable. Oftentimes, the differences between the balance sheets of two companies can be whittled down to who rents and who owns their hard assets. As a result, capitalizing the assets of companies that elect to rent their hard assets can give much better insight into their comparable use of OPM, as well as a better understanding of the estimated cost of assets they deploy in their business. Keep in mind that you will be adding the computed value of leased assets to both the business investment and also to the amount of OPM used. At the same time, you will need to back out of corporate operating expenses the rents for these assets, which will serve to elevate the company's operating profit margin variable.
If you are unable to make an estimate of the value of leased assets that could otherwise have been bought, then your operating profit margin will be lower, as will your business investment and OPM, but the V-Formula result will be the same.
Earlier I noted that business investment cannot generally be readily determined from accountant-prepared financial statements. Part of this is due to the noise created by non-cash accounting conventions. Part of this is also because accounting rules permit companies to alter their hard asset investment amounts. For instance, if I decide to sell a piece of real estate I own at a loss, accountants will expect me to “impair” the asset and literally mark its cost down to estimated market value. Or, if I am Google and need to take a $10.1 billion write-down on my business investment in Motorola Mobility, then either hard assets or intangible assets (goodwill) might be so impacted. Of course, from a finance point of view, none of this alters the business investment made or the fact that the current equity rate of return is less because of a few problem investments—in this case, real estate, or the business value of an acquisition. By eliminating or lowering the value of assets, the accounting profession impedes our ability to precisely know what the actual business investment was. Therefore, this elimination of corporate business investment costs prevents us from completely understanding how much EMVA company leadership has added to or taken away from the business. What's more, the financial disclosure associated with asset valuation write-downs will typically seek to minimize their importance by noting them to be “non-cash.” This is not true. The investments clearly consumed cash and were a part of business investment, but that cash was simply invested in a prior period. Again, this is where finance and accounting can diverge, with the latter obscuring the image of the former. From a financial vantage point, you cannot alter business investment with non-cash adjustments like depreciation or impairments.
Presuming equity market value added to be a positive number (and not all public companies trade for values worth more than their equity at cost), then incorporating it into the V-Formula will lower the computed current pre-tax and after-tax equity rates of return, often by a lot. For one thing, the ratio of sales to business investment will be a great deal lower. In the case of Google's 2004 year-end financial statements, the ratio falls from 1.05:1 at business investment cost to just .06:1 with EMVA added to that cost. If your company makes use of OPM, then your OPM mix will also be lower, which will further lower your comparable equity rate of return. The one small positive will be that your maintenance capex, staying constant as a number, will be less as a percentage or your new elevated business investment number.
Making such adjustments to the V-Formula inputs to compute current corporate equity returns transforms the V-Formula. Now, the formula no longer computes current corporate equity rates of return at cost; instead, it computes the current returns realized by the public shareholders. I refer to this revised value equation as the Market V-Formula.
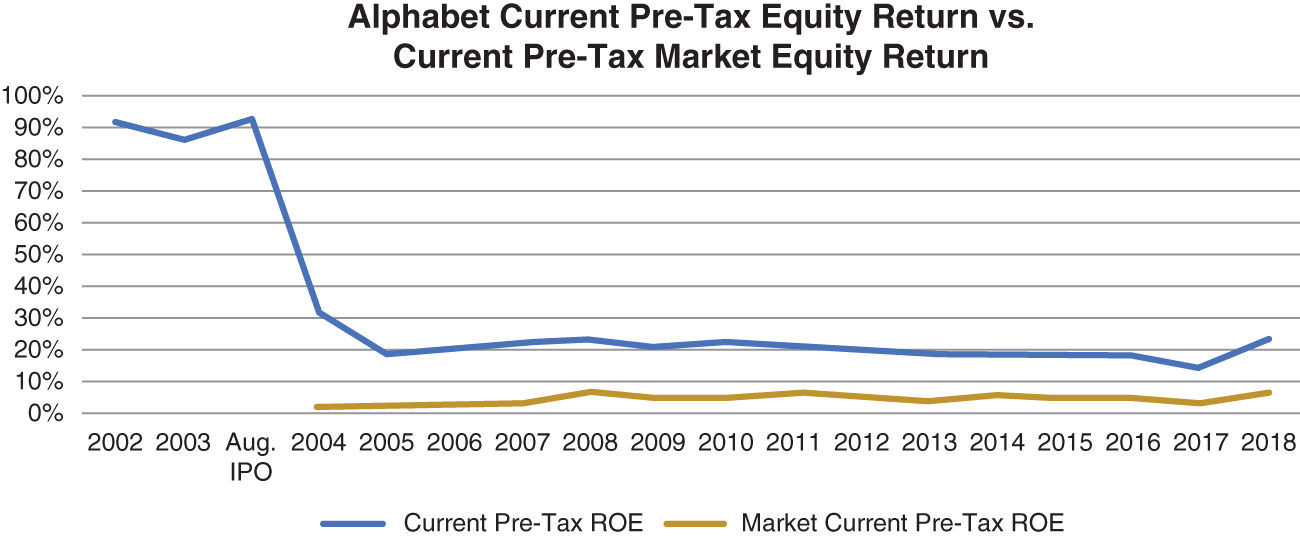
So, how does the market equity return of Alphabet stack up to the earlier current equity return graph? For one thing, it will be a bit more volatile. This is because EMVA is subject to the normal volatility of a company's business model and also to the volatility delivered by the changing sentiments of public markets. Between 2004 and 2019, Alphabet's after-tax market return on equity averaged 5%. Adjust this amount for the excess cash, and the average current after-tax equity return available for shareholders investing in Alphabet shares would rise to nearly 7%.
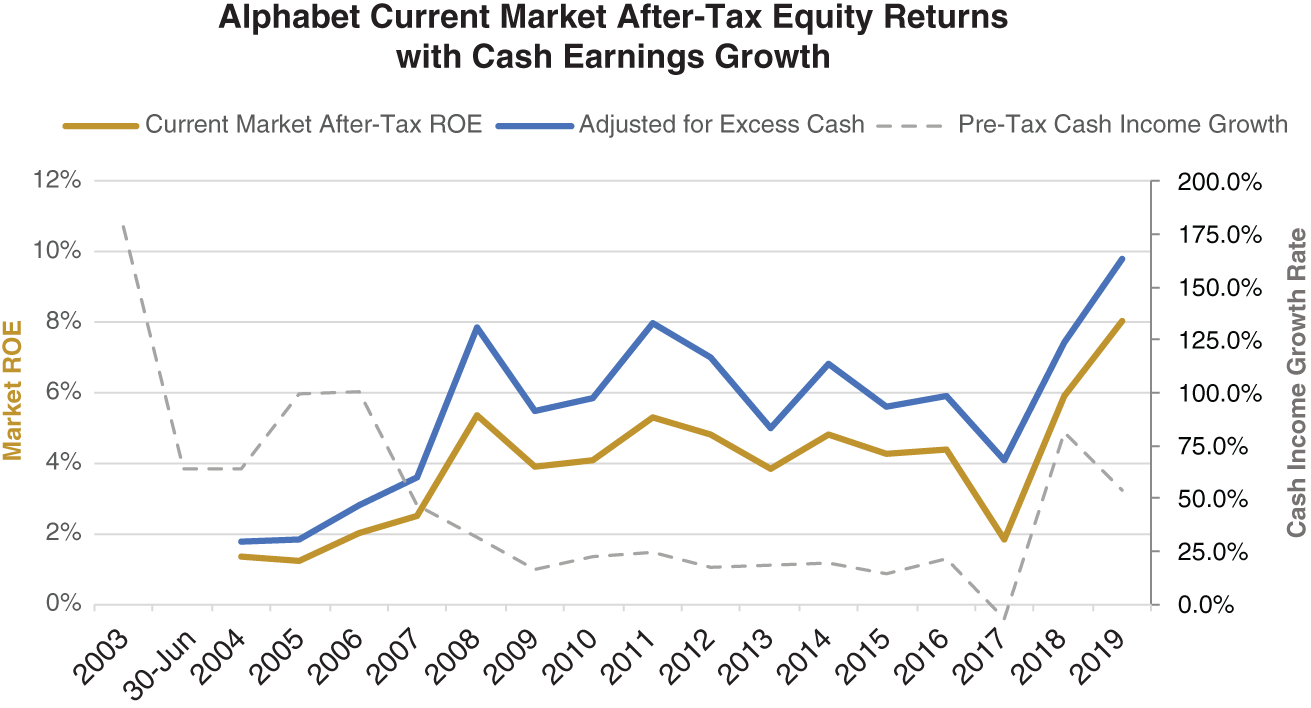
Given that the broad S&P 500 stock market index has posted equity returns since its 1926 inception in the area of 10%, having a current return of 5% is attractive, especially given Alphabet's median annual growth in net income and cash earnings in the area of 23% annually. Add the two together using the Gordan Constant Growth formula and you get about 28% expected annual rates of return.
The actual annual compound rate of return for an investment in Alphabet in 2004 and held to the end of 2019 was closer to 20% because the public markets ultimately placed less value on the company's current equity returns, especially in 2018 and 2019. As companies age, outsized growth becomes harder to maintain, and so share valuations tend to decline relative to equity cash flows. In other words, the price of shares and the EMVA created did not rise as fast as cash flow growth.
A current after-tax market equity return is interesting, but Alphabet did not pay any of that cash flow out to its shareholders in the form of dividends. Instead, it retained and reinvested all its cash flow into the business. Therefore, an investor at the end of 2019, electing to make an investment in Alphabet shares, would be electing to buy into an 8% current market equity return with the hope that such a return could grow through the compounding available through cash flow reinvestment as well as cash flow growth from its various businesses. Was that a good deal? For sure, the rate of growth in cash income experienced a fair amount of volatility between 2017 and 2019, suggesting less predictability. However, by historic valuations and historic rates of growth, the price of Alphabet shares at the end of 2019 would appear to have been historically attractive. And, indeed, the company delivered shareholder returns of over 30% over the following 12 months, or more than double the returns delivered by the broad S&P 500 index.
Walmart
Companies and their business models change over time. At the same time Alphabet was delivering growth powered by a consistently strong corporate business model, Walmart, the largest retail chain in the United States, was on a different path. Founded in 1962 by Sam Walton, the first Walmart store in Rogers, Arkansas, redefined retailing by eliminating middlemen and selling merchandise at consistently low prices. Fifty-eight years later, by the end of its fiscal year ending January 31 2020, Walmart had expanded globally, employing over 1.5 million and serving as the largest employer in 22 states. The company also had an equity market capitalization of nearly $325 billion, of which $121 billion was equity market value added. EMVA as a percentage of equity at cost approximated 40%. At the end of 2019, the Forbes 400 list of wealthiest Americans included no fewer than seven members of the Walton family, boasting combined estimated net worths exceeding $200 billion. As impressive as this is, the Walmart business model was not as robust as it had been in its earlier years. The company had become a mature business operating within a less hospitable, highly competitive marketplace.
For its fiscal year ended January 31, 2000, Walmart posted a current pre-tax equity return of approximately 25%, not materially different from the returns posted by Alphabet, though with a capital stack composed of approximately 44% of OPM. The portion of OPM is hardly a surprise; Walmart is not an asset-light company, operating many thousands of costly locations with multiple banners across the globe.
Incidentally, Walmart is a good example of a company that elects to lease a fair amount of its real estate assets that it might otherwise own. Between January 2000 and January 2020, company rent expense rose from $573 million to over $3 billion annually. Using estimated rental capitalization rates of 7% in 2000 and 6% in 2020, the estimated value of leased real estate OPM proceeds would rise from approximately $8 billion in 2000 to approximately $60 billion in 2020.
By contrast, Alphabet had historically been operated with little or no OPM, which is unusually low for a public company and adversely impacts equity returns in comparison to a business like Walmart.
By end the company's 2020 fiscal year, Walmart's current pre-tax equity rate of return had fallen to below 15%, driven by some operating profit margin compression and even more by a decline in its ratio of sales to business investment, from around 2.5:1 to roughly 1.7:1.
Over 20 years, Walmart's business model changes resulted in lower current equity returns and EMVA erosion. Between its fiscal years ending January 31, 2001, and January 31, 2020, Walmart actually lost nearly $145 billion in EMVA as follows:
| ($000,000s) | |
| Walmart Equity Market Value Added Change | FY 2001 – FY 2020 |
| Cash Flow from Operations | $437,954 |
| Less: Stock Repurchased | (107,795) |
| Less: Dividends Paid | (86,864) |
| Equals Equity Cash Reinvested In Business | $243,295 |
| Less: Actual Increase in Equity Market Valuation | (98,509) |
| Equals Market Value Lost | $144,786 |
In the 20 years between fiscal years 2001 and 2020, Walmart generated over $435 billion in cash, using $108 billion to repurchase approximately 37% of the company's shares and another $87 billion to pay dividends, leaving $243 billion of its realized cash flows over that period in the company. Assuming that equity sum was reinvested into the business, one would expect the company would have raised its equity capitalization by a like amount. In that case, Walmart would have created no EMVA on the reinvested cash; the company's value would simply rise by the equity reinvested in the business. However, the company's equity valuation rose by approximately 40% of the free equity cash flow reinvested in the business, meaning that approximately 60% of the reinvested cash flow effectively evaporated. The result was a loss in EMVA of nearly $145 billion.
This illustrates that a company can metaphorically “light money on fire” in the process of growing its share price and earnings per share. Over the 20-year period from 2001 to 2020, Walmart's share price did slowly grow, eventually more than doubling. As a result, shareholders who held on to their Walmart shares over this entire period realized a comparatively anemic rate of return of less than 6% annually. That included the Walton family, which collectively held approximately half the company's shares at the beginning of 2020. Walmart may have underperformed over 20 years, but the net worths of Walton family members grew from the modest share price appreciation (below 4%, compounded annually), together with the collection of more than $40 billion in dividends.
That the Walton family could slowly and steadily grow their net worths over a 20-year time frame as the company they founded lost EMVA and underperformed the broader stock market is instructive. You can indeed get richer holding onto poorly performing investments, even as they erode EMVA. And investors are often content to earn modest returns as they search for safety. Given Walmart's size, market position, and financial strength, many investors would characterize the company as safe. And, indeed, the company lived up to this expectation, recovering lost EMVA during a global pandemic and delivering shareholders an approximate 25% rate of return for its 2021 fiscal year.
In the 1920s, iconic comedian Groucho Marx invested heavily in the stock market. As all the stock prices rose, it looked like easy money! But in the great stock market crash of 1929, Groucho lost $800,000—his entire net worth. He later joked that he would've lost more, but that was all the money he had.
He and his brothers slowly rebuilt their fortunes. Later, he was asked by a floor trader on the New York Stock Exchange what he invested in. Groucho replied that he invested in Treasury bonds. The trader shouted back that Treasury bonds, historically considered to be the safest of investments, don't make much money. “They do,” Groucho retorted, “if you have enough of them.”
If you are an equity investor thinking about investing in Walmart, what might this history tell you?
First off, it would say that Walmart's business model is no longer the same lucrative one that created an ocean of wealth out of thin air for shareholders and the Walton family. Over the 20-year period between 2001 and 2020, EMVA as a multiple of equity at cost fell from approximately 4.3X to less than .6X.1
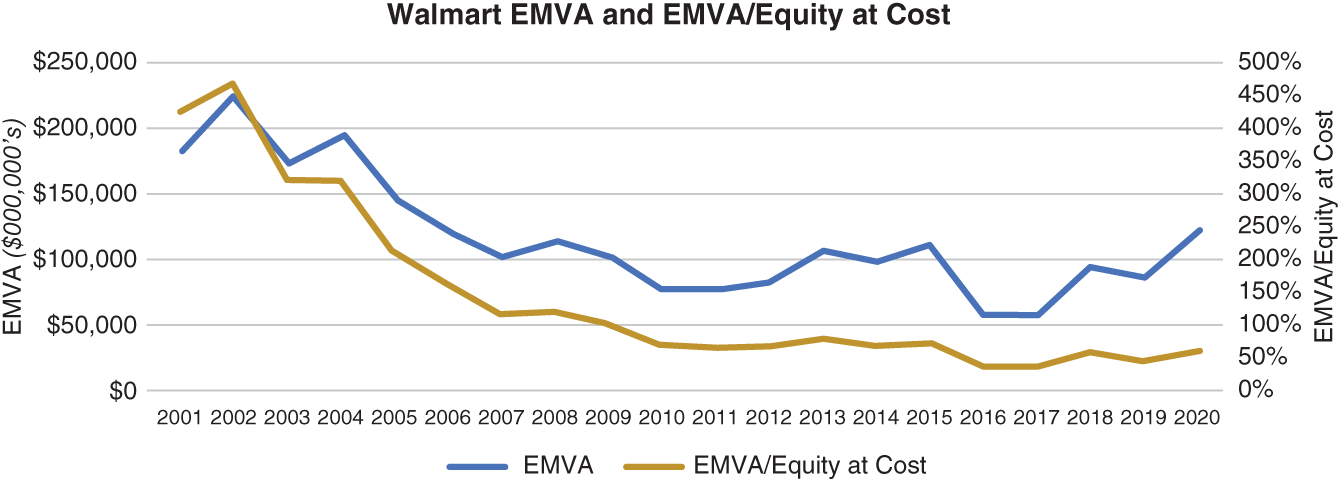
Second, it would say that a substantial portion of the company's retained after-tax current market equity return (or the amount of cash flow kept in the company after the payment of dividends) is subject to evaporation as the company invests its free retained cash flow into lower yielding investments. Indeed, time and changing market dynamics contributed to Walmart's transformation from an EMVA-creating machine to a company that destroyed value in the process of delivering modest investor returns.
As an important rule of thumb, one would be selective about being a “buy and hold” investor in a company having business model limitations. Instead, when investing in a large company having a propensity for destroying the value of much of its free retained cash flows, one would generally consider their equity price entry point and then target an exit point. By contrast, holding onto shares in companies like Alphabet, which have steady business models capable of EMVA creation, tends to correlate with less long-term performance risk. Above all, a key observation to be made is that companies and their business models change from year to year. Few growth companies can maintain growth and deliver elevated returns forever.
Note
- 1. If you look closely at the chart and then look to the cash flow estimate of lost value, you may notice that they do not tie out. In fact, if one computes the cost of Walmart’s balance sheet and equity each year and looks to the EMVA differences between 2001 and 2020, the loss in EMVA will approximate $130 billion, or more than $70 billion short of what the statement of cash flows would suggest. The difference principally lies in the company’s large share repurchases, which were bought in at well above the underlying cost of those shares. Some differences may also arise from non-cash accounting asset impairments, which will obscure the degree of lost shareholder value by distorting the true cost of business investment. Cash flow statements rule, but the chart, taken from the company’s fiscal year-end balance sheets, is still instructive.
