Chapter 9
Opportunity Cost
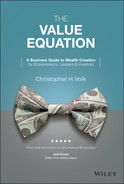
One of the great books in business is Economics in One Lesson by Henry Hazlitt. First published in 1946, he wrote it when he served as the principal editorial writer on finance and economics for The New York Times. The first chapter in this book is entitled “The Broken Window,” where he describes the economics of a broken shop window, together with the thoughts that often accompany such an event. For example, you might say that, while a nuisance, the broken window simultaneously creates a societal opportunity. A job will be created to replace the window and the income earned by the associated labor force will then benefit others as the money they earn flows through the economy. Such thoughts are commonplace as we consider the repercussions of accidents or natural disasters. In making such observations, our tendency is to think about what is and what we can see.

Henry Hazlitt
In this case, the window is broken.
But what about what could have been? Had the window not been broken, the shopkeeper could have taken the money needed to replace the window and spent it elsewhere, benefiting other businesses. In turn, that same money would have flowed through the economy to create new jobs and perhaps build new buildings, rather than just repair existing ones. But that opportunity was lost, with the resultant cost of the broken window.
Instead, the shopkeeper had to spend money just to stay even; from his expenditure he realized no additional benefit or value.
Think of this as an opportunity cost.
Companies incur opportunity costs like this every day. The groundwork for these costs is laid by leadership that, like Hazlitt's window example, is focused on what is, rather than what might be. Often, opportunity costs arise from capital stack and OPM choices.
This chapter is designed to offer an illustrative framework to help assess the impact of opportunity cost probability and thereby help you capture future opportunity value.
Some Opportunity Cost Illustrations
Consider this example. You are offered an attractive loan to finance the purchase of a piece of real estate used in your business. The advance rate is aggressive, the interest rate is amongst the best you have seen, and you can live with the financial covenants. But what happens if you want to change your business model in a way that creates a risk of covenant violation? Or what happens if you elect to sell the building, or your business and the loan is not assumable or desirable? Or what happens if you want to pay off or modify the loan, only to discover that modifications are difficult and expensive and that there is a material prepayment penalty? Like our earlier window illustration, these are “what ifs,” whereas business leaders all too often focus on the “what is.”
Here is another illustration. Let's say that you learn about, and consider, an alternate means of OPM for your building. You choose to sell it and then to rent it back in what is called a sale-leaseback arrangement. You like the real estate price and the lease rate offered by your proposed landlord, and you accept the deal. But sometime later, you elect to sell your company and you find that the lease is not assumable without landlord consent, which exposes you to business risk, elevated legal bills, and extended time.
Or maybe you one day find that the property is such a strong performer that you would like to expand it. You go to the landlord to see if they can help fund the expansion. They can't, or won't, and it turns out that borrowing for the expansion is hard because there is no way to pledge the expansion of another person's real estate to your bank.
The opposite could also happen. You find that the property is not performing well, and you would like to close it down or relocate it, so you ask your landlord for help. Again, the landlord takes a pass. Your landlord likes this location and prefers you to pay the rent obligation, even it means that you will suffer meaningful losses. Maybe your landlord financed the real estate in such a way as to impose financial flexibility limitations that would disallow location closure, lease assignment, or an asset substitution. Oftentimes, financial limitations imposed on landlords by their lenders become your financial limitations.
In both the preceding real estate OPM illustrations, one pertaining to mortgage loan financing and the other pertaining to a landlord lease arrangement, the business leader focused on what is rather than what might be. In so doing, both real estate OPM solutions imposed potential long-term corporate opportunity costs. The business leader, by locking in favorable financing while at the same time ignoring the possibilities for resultant corporate constraints, set in motion this opportunity cost potential. Or, looking at the glass half full: The business leader made it difficult or impossible to harvest opportunity value that could have been there. Leaving opportunity value on the table can cost a great deal.
A big reason business leaders fall prey to opportunity costs is because opportunity value capture is hypothetical, whereas the financing terms delivered by various OPM choices are known. We are brought up to think this way, hearing maxims such as “a bird in the hand is worth two in the bush,” and so are generally conditioned to overlook hypotheticals. Should future problems arise from our capital stack or operational decisions, we simply assume we can readily address them later.
Creating a Model to Evaluate Real Estate Lease Opportunity Costs
Part of the problem in evaluating opportunity costs is knowing how to begin to estimate the opportunity value we are giving up. I will start our opportunity cost case study by evaluating the impact to your business of being partners with an intractable real estate landlord. This is purely illustrative. The important elements to be taken away from this chapter pertain to how to set up the problem as you quantify the potential costs of lost opportunity value.
Invariably, multilocation retail and service companies have some locations that do not pencil out. For our initial illustration, assume that 5% of your locations underperform. To evaluate the impact on your business, we will use the restaurant case study and wealth creation illustration from chapter 4:
Restaurant Case Study
| 1 Business Investment | $1,000,000 | |
| 2 Sales | 1,500,000 | |
| 3 Operating Profit (EBITDAR) | Profit margin is 20% of revenues | 300,000 |
| 4 Maintenance CapEx | 2% of business investment annually | 20,000 |
| 5 OPM | OPM is 75% of business investment | 750,000 |
| 6 Interest and Rent Expense | Cost of OPM is 9% | 67,500 |
| 7 Pre-Tax Cash Flow | 3 - 4 - 6 | 212,500 |
| 8 After-Tax Cash Flow | 75% of cash flow | 159,375 |
| 9 Equity | Opposite of OPM (25% of business investment) | 250,000 |
| Return on Equity | ||
| Pre-Tax | 7 ÷ 9 | 85.0% |
| After-Tax | 8 ÷ 9 | 63.8% |
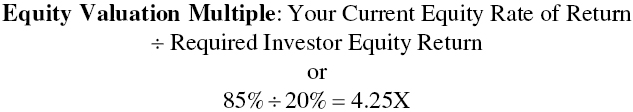
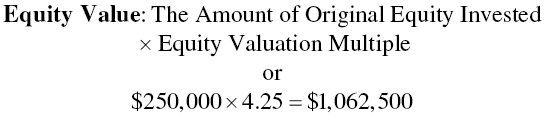
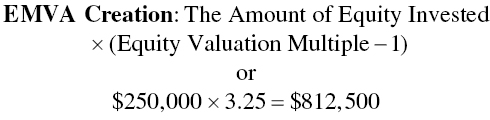
… and the resultant all-important Wealth Creation Formulas:
In our illustration, your business has an operating profit margin of 20%. But if just 5% of your properties post reduced operating profit margins of 10% each, then this would drag your EBITDAR margin down by .5%, which is computed by multiplying the 10% profit drag by the 5% of properties underperforming. In total, your operating profit margin would be reduced from 20% to 19.5%.
I might say that this is a mild description of the possible.
It is not uncommon for underperforming assets to have no operating profit margins at all, in which case the 5% of the properties might have a comparative profit drag of 20%. That would reduce your overall EBITDAR margin by 1% (that is, 5% × 20%). And if 10% of your assets underperform, that would lower your EBITDAR margin by a full 2% (10% × 20%). I have seen companies that have had far greater challenges, facing larger percentages of underperforming locations having negative operating profit margins. Here's a draconian case: 20% of your locations underperform, swinging from a 20% operating margin profit to a 20% operating margin loss. The unfortunate result: An 8% change in your operating profit margin, from 20% to 12% (20% of locations × a 40% operating margin drag). Faced with such dismal results from those locations, you would likely want to go to your landlords to see what you might be able to do to offset this profit drag. There could be the potential to improve the properties in such a way as to help recover lost profitability. Or you might seek to sublease, close, or relocate those locations.
Unfortunately for you, it is not uncommon for landlords to decline your requests. They frequently view their business arrangement with you as having been carved in stone the day you signed your lease. And it is not uncommon for landlords to offer no money to aid with improvements to your underperforming properties. Or perhaps they have restrictions imposed on them by their lenders that become your restrictions.
Landlords are often intractable, which can exact a material cost. You are often on your own.
During my years of providing real estate capital solutions to businesses, I have heard many stories of such landlords. Often, those stories can shape the views of business leaders, leading them away from landlord solutions and toward banker solutions. Not infrequently, I have listened to the chief financial officers of real estate–intensive companies expound on the essentiality of owning their mission-critical real estate.
To this, I would note that commercial real estate lenders often deliver products having material restrictions of their own. These can range from covenants to modification, prepayment, and assignability constraints. Moreover, because real estate ownership invariably requires an elevated mix of equity, corporate returns and value creation can be adversely impacted, and the capital stack can be harder to adjust. A key part of the reason for ultimate capital stack adjustment inflexibility is often that real estate owned for a long time becomes characterized by an increasingly low tax basis as a result of accumulated depreciation. In such cases, even if the real estate is sold for its original cost, the taxable gains can be enormous, often precluding using lease OPM at a future date. This is a big reason why some well-established and larger companies continue to own their real estate; the tax consequences of real estate divestitures can make altering their capital stacks in favor of leasing alternatives too costly.
To the problems imposed by leasing poorly performing properties from intractable landlords, there is a flip side: You could have outperforming properties that you would like to expand, and yet you're saddled with intractable landlords. Let's say that you have 5% of your properties that outperform, and you would like to expand them. The cost for the expansion will be 25% of the initial cost of the property, but the added revenues will be 10%. Best of all, the incremental operating profit margin from the revenues will be 40%, reflective of the high margins you can generate on your marginal (or last dollar of) revenues after all your fixed costs are covered.
This set of circumstances will impact four of your six V-Formula Variables.
The first variable to be impacted is sales, which is computed by multiplying the percent of outperforming locations to be expanded by the 10% in expected same store sales growth. In this first illustration the sales growth amount to .5% (5% × 10%).
The second variable is the operating profit margin change, which works out like this:
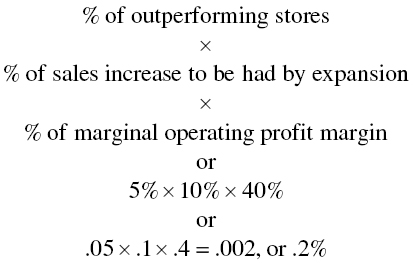
Five percent of your properties with 10% sales increases each at a 40% margin will raise your overall EBITDAR margin from 20% to 20.2%. If 10% of the stores outperform, your margin increase would be .4%. And if the marginal sales increase is 25% at each remodeled location, your margin increase would rise a full 1%, elevating your overall operating profit margin to 21%. You could be more fortunate and have 20% of your locations outperform, with remodeled and expanded locations seeing 50% increases in revenues. Now your operating profit margin has the potential to improve a full 4%.
Your only problem is that you need your landlord to commit to the 25% expansion dollars, for which you are willing to pay a corresponding increase in your rents. This added business investment is the third V-Formula variable change.
If you are fortunate and your landlord funds the added business investment for you, your OPM mix will rise slightly, which is the final V-Formula variable change. The basic formula for the OPM increase is illustrated as follows:
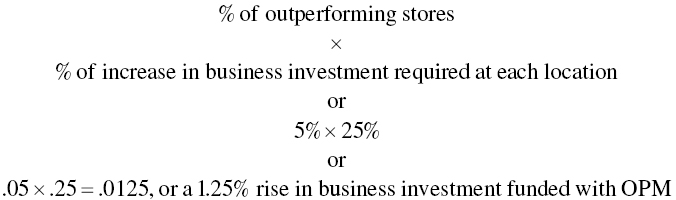
In this case, if the landlord is funding the expansion of 5% of your locations, the OPM mix rises 1.25%, reducing your equity mix by a like amount and serving to slightly elevate your returns. In the original restaurant example, there is 25% equity committed to support your business investment. Subsequent to the expansion of outperforming locations funded by your landlords, the mix now becomes 76.25% OPM and 23.75% equity.
Landlord commitments to expansion funding is ideal. Unfortunately, many landlords will refuse requests for additional investment. As with the earlier intractable landlord illustration of underperforming properties, you are on your own.
Being on your own is not a good thing when it comes to improving rented real estate. With an inability to pledge the real estate improvements you need to make, the expansion of rented properties will often rely heavily on equity, which will reduce the desirability of rented property expansion and lower corporate equity returns.
While the illustrations of the potential impacts on your company from underperforming or outperforming locations are hypothetical, they reflect a range of possibilities that are not at all far-fetched. So, the question becomes, if you have constraints that limit your ability to address underperforming or outperforming company locations over time, how much can this impact your business value?
When it comes to the potential for underperforming locations, we'll start with the most draconian scenario, with 20% of underperforming locations coupled with a 40% operating profit margin swing from a 20% profit to a 20% loss. The resultant 8% decline in corporate operating profit margin to 12% causes your current equity rate of return to drop from 85% to 37% representing a nearly 57% of your equity valuation (37% ÷ 85% – 1).
The drop in business valuation arising from operating underperforming locations assumes that you continue to keep those locations open and operational. The key is to find solutions that will either enable a performance reversal or a way to cut your losses. Often, as the well-known investment adage goes, “Your first loss is your best loss.”
Here is where it is helpful to have factored into your business model average maintenance capex variable the expected average annual losses of business investment value associated with location closures. Those costs could be in the form of lease termination fees paid to accommodating landlords or simply losses over location cost upon the sale of owned facilities. In the near term, a clear option is often to simply close the facility, rather than incur negative operating profit margins. Given the meaningful 57% loss in equity valuation resulting from open unprofitable locations, there are likely many options that would serve to lessen the adverse corporate impact.
Let's return to outperforming assets. In this case, we will select the optimistic outlier case offered earlier that you can remodel 20% of your locations, with each location to realize a 50% rise in revenues and a 40% profit margin on your incremental sales with an incremental landlord-funded location investment of 25%. Your overall increase in sales amounts to 20% of the locations multiplied by the 50% rise in remodeled store revenues, for a 10% rise in company revenues. The increased margin is computed by multiplying the 20% of locations by the 50% revenue increase by the 40% operating profit margin on marginal sales (.2 × .5 × .4 = .04, or 4%). Your business investment rises by .5% (20% of the locations multiplied by a 25% rise in location business investment). Finally, your OPM rises by 5% to 80% (20% of the locations multiplied by the 25% rise in remodeled location OPM), resulting in an equivalent drop in relative equity contribution.
With four of the six V-Formula variables impacted by the above illustration, we can use the shortened V-Formula formula construct set forth in Chapter 5. In this case the sales ÷ business investment ratio rises from 1.5:1 to 1.57:1, given the 10% rise in sales and the 5% increase in business investment. The result of the expansion and remodeling effort is a spectacular 67% rise in current pre-tax ROE from 85% to 142%. In turn, the elevated performance raises the equity valuation multiple from 4.25X to 7.1X. This raises your EMVA creation from 3.25X your initial equity invested to 6.1X, or better than $1.5 million.
You never know where opportunity costs might bite you. As you know by now, I like to create data tables that illustrate the impacts of changes in V-Formula variables. The table that follows illustrates what can happen to your equity value given different changes in operating margin and equity mix within our restaurant case study. In essence, the table comprises our prior illustrations of the impacts of outperforming and underperforming locations and their impact on your business.
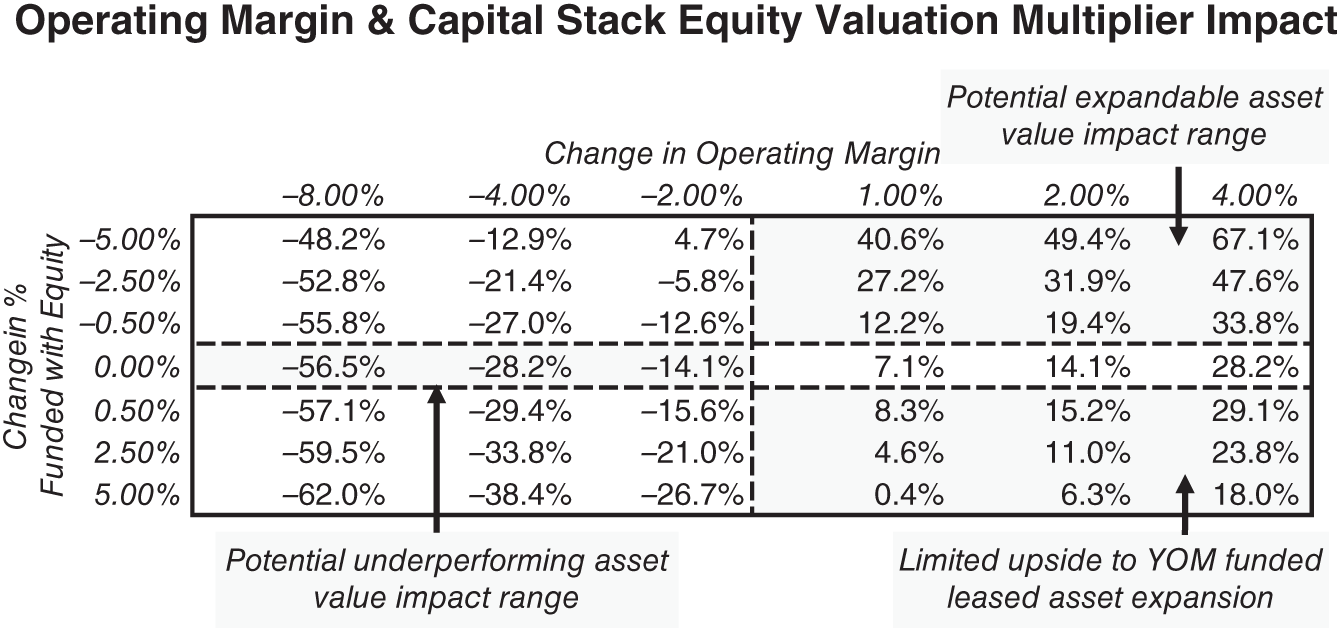
Our initial restaurant case study was for a single location having $1.5 million in revenues. Illustrations of the potential impact on your business value of location outperformance or underperformance clearly require a much larger company. It does not matter. Part of the beauty of the V-Formula is that it's all about the interrelationship of the Six Variables.
A few observations on the sensitivity table. Drops in your corporate operating profit margin, taken alone, will have no impact on your equity mix, which is why I put a border around the three squares having no equity alteration for the illustration of underperforming location impact. On the other hand, expanding outperforming properties can be expected to come with an equity mix alteration, which is why I put a border around the nine squares at the top and bottom of the table.
Should you be able to prevail on your various landlords to fund the cost of expansion, and should you be able to limit your corresponding equity investment, then the result could well be a favorable change in your capital stack that results in elevated equity returns. This is reflected at the top right of the table.
On the other hand, the opposite is also true. Should your landlords be intractable, compelling you to make the investment in expansion yourself due to an inability to obtain bank financing on real estate you do not own, then the resultant lower returns from equity funded renovations may cause you to forego your expansion plans.
The equity valuation impact, demonstrated by the lower right-hand squares, of having to fund location expansion with equity is far less compelling. You may simply have a better use for the equity, which means that your landlords will have imposed a permanent cost on your company because of their unwillingness to help you take advantage of your expansion opportunities.
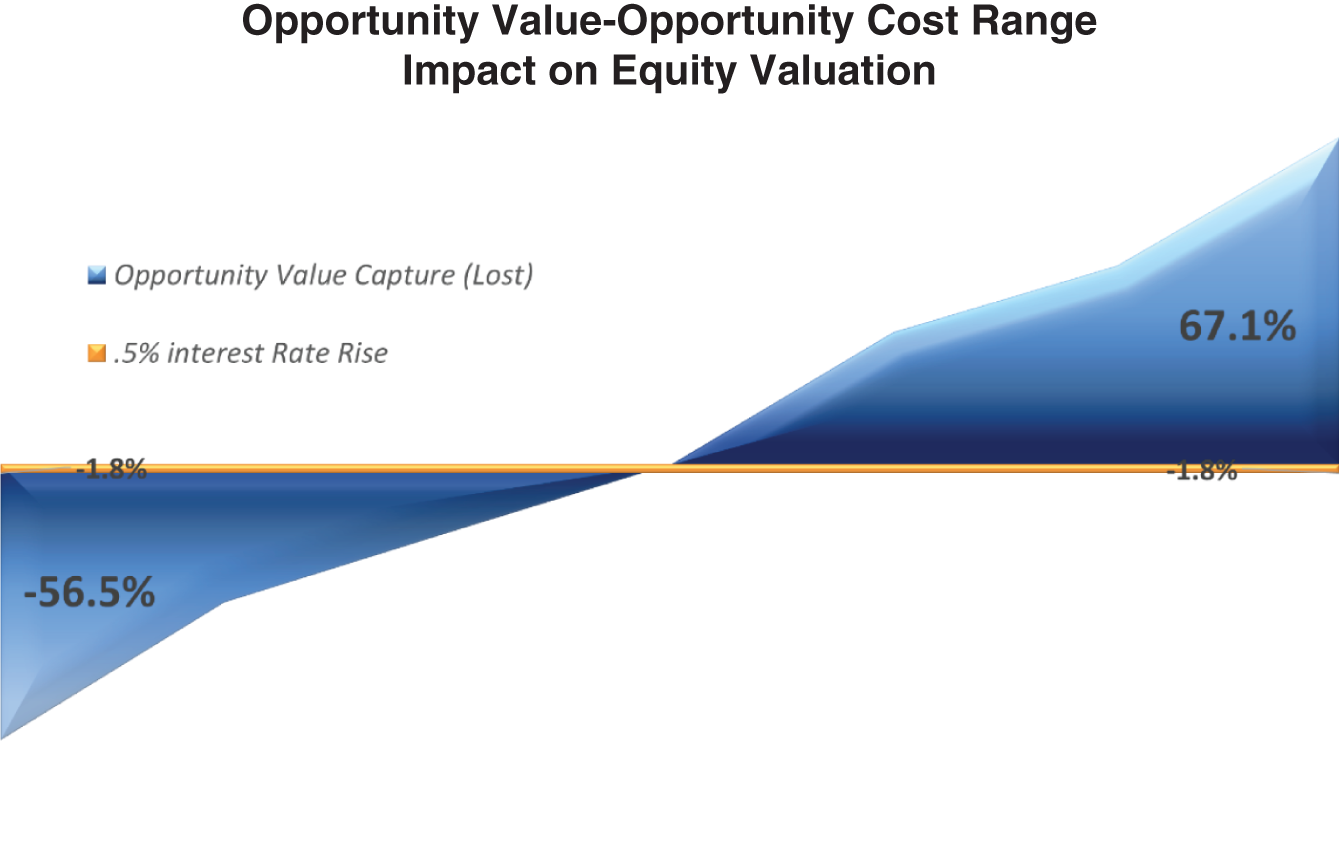
The equity valuation impacts to your business can perhaps be best illustrated pictorially. In this case, the range is simply the top four lines of the data table, since they are most likely and cover the ranges in the bottom right quadrant as well. I basically omitted the bottom left quadrant. Your equity mix can indeed increase if your profit margins fall, but this is not a given; it is at your option. As you look at the graphic that follows, the most obvious observation is the wide range of opportunity cost outcomes that can swing your equity valuation by nearly 60% or more in either direction.
For fun, I inserted one more variable into the graphic illustration. What if the cost to get a more flexible loan or the cost to have a landlord offering your company added flexibility was an increase in OPM cost from 9% to 9.5%? When introducing the V-Formula and then later discussing the financial efficiency levers at your disposal to improve corporate value, I made the observation that three variables (sales, business investment, and operating profit margin) tend to have an outsized impact on equity rates of return. Behind them would be the capital stack and the OPM/Equity mix. The cost of OPM tends to be the least important variable with respect to business valuation creation. In this case, the half point in excess interest rate serves to reduce your equity valuation by 1.8%, but it provides valuable insurance that enables you to seize inevitable chances to take advantage of opportunity value capture. The likelihood that the higher interest rate would not pay for itself over time is low and represents an intelligent form of opportunity value capture insurance.
When I first moved to Arizona in 1986, our chairman was Robert Halliday. Bob gained a reputation for his strategic business acumen as the treasurer and director of Boise Cascade, which he helped grow into one of the nation's largest timber and real estate companies. He later became a consummate entrepreneur, helping start a wide range of companies, including Franchise Finance Corporation of America, where I worked.
Bob had cut his leadership teeth decades earlier, serving in the U.S. infantry in northern Africa, then being among the first ashore during the D-Day invasion, and ultimately concluding his service approaching the Rhine River near Aachen, Germany. In total, he received seven Purple Hearts, the last of which was a severe head injury that sent him home for an extensive recuperation.
With all Bob's intellect and collective experience came abundant wisdom. He was among the first people with whom I shared my early V-Formula observations in 1999. Appropriately, one of Bob's most frequent aphorisms was this observation: “Availability of capital is everything.” That observation plays out in the preceding illustration. OPM may occasionally be expensive, but it's valuable if it permits continued accretive growth. OPM that lessens your likelihood of corporate opportunity cost imposition is undeniably preferable. Finally, your chances for corporate opportunity value capture tend to be greater with more liquidity. Such liquidity can be in the form of excess cash balances or unused lines of credit. The former will elevate your business investment and the latter involves larger lender commitments, both of which can modestly lower your current pre-tax return on equity.
Over 30 years of working with three successful public companies, we have adhered to Bob's maxim. We have raised capital, even when it was expensive, so long as we were able to deploy the capital in a manner that was accretive. We have likewise added to our liquidity as a way to provide our companies greater margins for error while raising our chances to seize opportunities that came our way.