Chapter 12
Animal Spirits
Up to this point, I have painted a highly rational picture of the way businesses are valued and deliver shareholder EMVA. At the heart of this image lies the ability of businesses to reliably deliver current equity returns. But facts have a way of interfering with such an orderly worldview. I can hear you thinking about the heady valuations often accorded public companies possessing little or nothing in the way of operating profit margins, together with business models that have yet to be proven or defined.
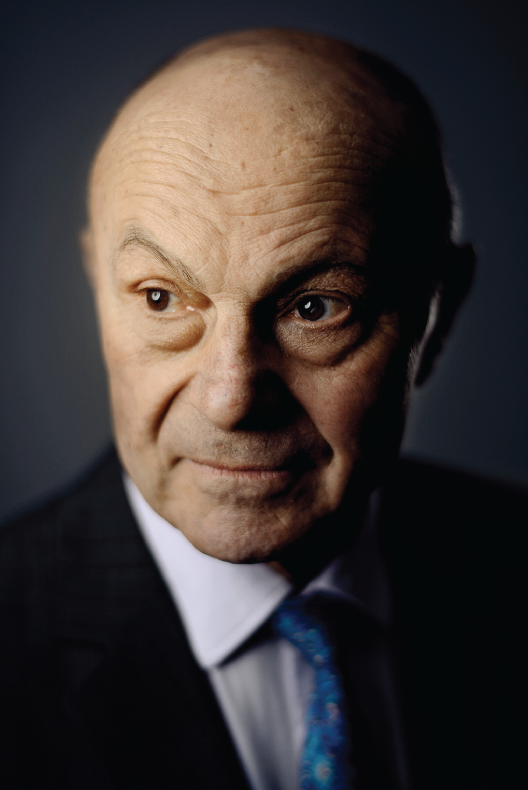
In his seminal 1936 work, “The General Theory of Employment, Interest, and Money,” British economist John Maynard Keynes pointed out that the world does not work as neatly as mathematical expectations might suggest. Instead, spontaneous optimism and urges to action arising from “animal spirits” can cause actual market performance to deviate from what might be expected. Nearly a century later, the prevalent influence of social media could only serve to magnify animal spirit formation. Keynes's observations would place him at the forefront of the eventual study of behavioral economics.
John Maynard Keynes
Credit: Universal History Archive/Universal Images Group/Getty Images
Public companies, of which there were fewer than 4,000 in the United States at the end of 2020, are often different with respect to the immediate linkage between corporate business models and equity valuations.1 Occasionally, investor sentiment, the ability to easily trade, and the resultant elevated corporate capital access have the potential to cause the relationship to blur.
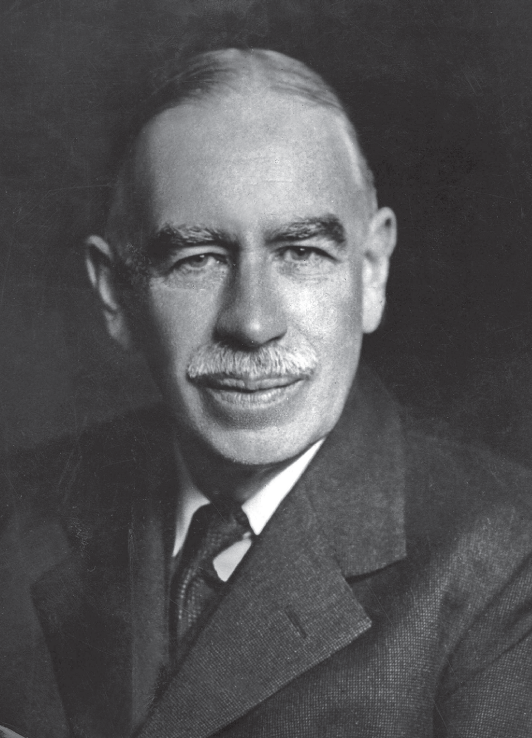
Credit: © Hedgeye Risk Management, LLC with permission granted by Hedgeye, reproduction and republication is expressly prohibited
Between 1995 and 2000, the Nasdaq Composite stock market index rose 400%, ultimately reaching a mindboggling price–earnings ratio of 200. The dot-com bubble, named for the many overly hyped public companies engaged in the cyberspace race to harness new internet product delivery technologies, left many investors bleeding. Between March 2000 and October 2002, under the weight of a sea of business failures and earnings disappointments, the Nasdaq Composite stock market index fell 78%, wiping out all the gains from the bubble.
Just 10 years prior, the Nikkei 225 Index of leading Japanese companies rode a similar hype-driven wave, reaching an all-time high of almost 39,000 and an untenable price-earnings ratio of 80. The peak of the Japanese stock market occurred at approximately the same time as the fall of the Berlin Wall, which would ultimately lead to the unification of East and West Germany. At the height of the Japanese stock bubble, the value of Nippon Telegraph and Telephone alone exceeded the combined value of all West German–based public companies. Over the next two and half years, the Nikkei index would, like the Nasdaq index a decade later, lose over 75% of its value. By the end of 2020, the Nikkei 225 Index was still approximately 30% short of its all-time high.
While the Nasdaq Composite Index was on its way to its eventual dot-com supernova, I was president of Franchise Finance Corporation of America (FFCA), a New York Stock Exchange–listed real estate investment trust. REITs have historically provided stable rates of return, generally offering far less volatility than might be found in growth stocks and certainly less volatility than in the heady Nasdaq-listed shares in the late 1990s. On an investor visit in New York, Mort Fleischer and I called on Tiger Funds, which was led by Julian Robertson. At the time, Tiger had realized outsized growth and performance, becoming the second largest hedge fund in the world. We were asked what kind of investor rates of return we believed we could deliver, and I responded that I thought we could offer returns in the area of 10% to 12% annually, with most of that being delivered in the form of dividends. The Tiger portfolio manager was unimpressed. “We are looking to make 10% a month,” he said. And then, considering FFCA a bit more, suggested that our stock was simply part of the “value clutter” to be found among less interesting companies.
It turned out that had you held FFCA from the time of our 1994 IPO until our eventual August 2001 sale to GE Capital, your compound annual rate of return would have been just north of 12%. By then, Julian Robertson had shut down the Tiger Funds following bad bets on currencies and against heady Nasdaq technology shares that had diminished his historically impressive performance. That last bet, had his funds stayed open, would have eventually proved to have been right.
Stock market and asset valuation bubbles are not unusual. They have occurred throughout history. In 2000, I had an opportunity to listen to legendary investor Warren Buffett speak. At the time, his company, Berkshire Hathaway, had avoided placing any bets on the stocks of companies having strategies centered on emerging internet technologies. When asked about the reason for his avoidance of such investments, Warren produced two slides highlighting companies that pioneered two other life-changing twentieth century technologies: automobiles and air travel. There were so many public airlines and automobile manufacturers, most lost to history, that the names of the companies were barely recognizable to the audience. (Ever hear of automobile companies named Doble, Stanley, Ross, or Stearns? No? They, and many more, manufactured practical, operational steam-powered automobiles at the turn of the century.) With that demonstration, Warren noted that, had you elected to invest money in all these emerging companies, you would not have generated any return. Selecting the ultimate winners would have been beyond the skills of most investors. More than this, the ultimate corporate winners from groundbreaking technologies were often not just pioneering manufacturers, but other industries. Oil companies and hospitality are just two of the industries whose growth was kick-started by innovations in transportation technology. Warren preferred instead to invest with a clear understanding of the corporate business models employed by the companies whose stocks he and his company owned.
Elon Musk and Tesla
Quite often, money simply chases stocks based on confidence in the potential of new technologies and the market disruptors who harness them. On June 10, 2010, Tesla became the first automotive manufacturer to go public in 50 years, proposing to be the leader in emerging electric automotive technology. The company was guided by charismatic leader Elon Musk, who had dropped out of a PhD program at Stanford after just two days to engage in a series of highly successful start-ups in software, online banking, and digital payments. The wealth he created from these ventures enabled him to be an early investor in Google. He also invested $30 million in Tesla, later assuming the role of chief executive officer. Over the 10-year period from 2010 to 2019, Tesla never once had a year in which it realized operating profitability, racking up over $5 billion in negative earnings before depreciation, amortization, and interest expense. The company would fund these collective losses, together with added business investment, through the issuance of approximately $6.5 billion in new equity and another $9.9 billion in borrowings.
During this money-losing stretch, Tesla's well-designed electric automobiles gained in popularity, helping to significantly drive up the company's share price. With the company reporting its first positive annual earnings results in 2020, its shares leapt in value, propelling the company's equity capitalization to more than $630 billion by the end of the year. At that price, Tesla's shares were worth about the same as the world's 10 largest auto makers combined. Collectively, those 10 companies produced over 50 million vehicles in 2019. Tesla's production goal for 2020 approximated just about 1% of this amount, or 500,000 cars. With an approximate 20% ownership of Tesla, Elon Musk vaulted into first place amongst the wealthiest Americans, ahead of Jeff Bezos, the founder and CEO of Amazon.
Meanwhile, the company's precise eventual business model remained subject to conjecture, given its history of losses and modest 2020 current equity returns. Clearly investors, as reflected in Tesla's elevated share price, bought into the dream. Yet while the company's share valuation relative to other quality automotive participants was suggestive of a bubble, the eventual proof lay in its developing business model.
Stock Exchange Differences
In the United States, there are two major stock exchanges that are the largest in the world. The oldest of these is the New York Stock Exchange, which traces its roots to 1792. An important element for listing a company on the New York Stock Exchange is the requirement that the business have been profitable for the previous three years. The three public companies I have helped lead and take public have all been listed in the New York Stock Exchange. In 1971, the Nasdaq stock market was founded as the world's first fully electronic stock exchange, with no listing requirement that a company ever had been profitable. This key listing criteria difference led Nasdaq to be the market of choice for unprofitable start-ups that are often technology-based, such as Tesla. Many such ambitious, but unprofitable companies, lay at the center of the dot-com bubble. There is always a risk with newly listed public companies that their business models and, hence, equity rates of return are evolving and not readily knowable. With unprofitable companies, this is especially so, adding a clear venture capital component to what had historically been a marketplace comprised of companies having more proven histories and business models.
What this means is that public and private companies often do not play by the same rules. With the vast majority of companies in the United States, the link between business models, equity returns, and equity value creation is more immediate. However, with publicly traded companies, this linkage can, for a while anyway, be obscured amidst rapidly changing financial data, compounded with elements of sentiment and hype (or animal spirits) that accompany the ease, simplicity, and liquidity of a readily tradable instrument.
How long is a while? It can be a long time. The story of an experienced investor like Julian Robertson can bear this out. His strategy was to simultaneously bet in favor of established “old world” companies, while betting against the overhyped valuations of scarcely profitable technology companies caught up in the dot-com wave. It took far longer than he anticipated for those once-lofty valuations to come down to earth.
Restaurant Case Studies
Throughout this book, I have relied on a simple case study of a restaurant company to lay out the framework of the Six Variables that drive business performance and equity valuation. There are more restaurant locations in the United States than any other consumer-facing business, and any number of restaurant chains have tried their hand at going public. More often than not, such ventures do not end well. Between 2000 and 2019, 41 restaurant chains sold shares to the public. Of these companies, about a third remained public with shares trading above their initial IPO price. About 10% of the companies would eventually be taken private at valuations above their initial share price. Slightly more than 40% of the companies were split between remaining public or being taken private at valuations lower than their IPO price. Finally, about 15% of the restaurant IPOs ultimately sought bankruptcy protection.
A big reason for this variability in performance lies in rapidly changing corporate business models. With little in the way of operating leverage, achieving earnings growth typically requires new restaurant expansion. To maintain the same level of earnings growth each year often requires near geometric expansion to offset same-store operating profitability declines as “honeymoon” revenues taper off at locations opened in recent years. Often, companies incur operational and financial stress associated with managing rapid growth as unimpressive business models become apparent.
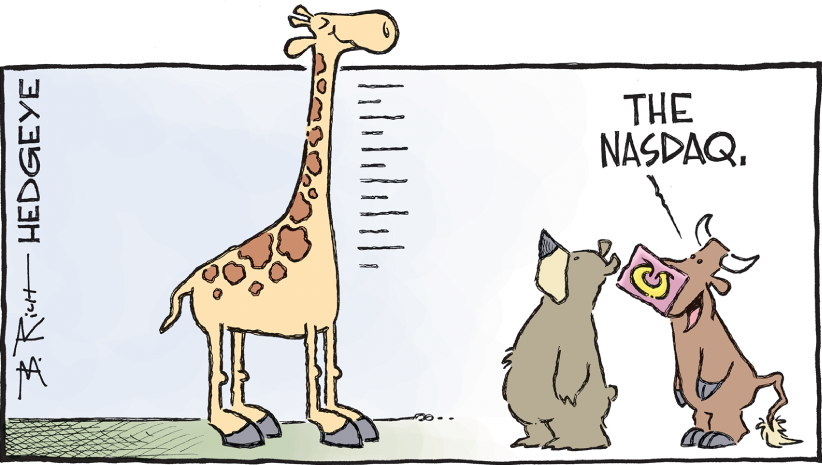
Lone Star Steakhouse & Saloon
In 1992, Lone Star Steakhouse & Saloon, based in Wichita, Kansas, went public. A year earlier, the company had just six restaurant locations. By the end of 1992, that number had grown to 32 locations. A year later: 68 locations. In 1993, 1994, and 1995, Lone Star was awarded the distinction of “Best small business in the country” by Forbes magazine, and in 1994 it ranked #6 in Fortune magazine's list of fastest-growing companies.2
A shuttered Lone Star Restaurant in Johnstown, Pennsylvania, 2016
In the course of this rapid growth, the company's business model was scarcely visible. By the end of 1995, the company had issued over $200 million in equity and was sitting on nearly $70 million in cash. The company's equity returns were hampered in part because of the elevated cash balances, which meant that their business investment was excessive. Another factor was that their use of OPM stood at just over 15%, a low percentage for an asset-heavy restaurant operator. However, one way to accelerate earnings growth is to use less OPM, since interest or real estate rent costs would otherwise lower corporate profitability and earnings growth. At the time, Lone Star was trading at a hefty price-earnings multiple of 25X. While net income is not exactly cash, if you invert a price-earnings multiple, you arrive at an income yield of around 4% (1 ÷ 25). At the time, this was materially less than the yields that lenders or landlords would demand on their capital. Hence, the company took advantage of its current cost of equity, issuing another $110 million in stock in 1996. By the end of the year, the company's equity valuation approached $1.4 billion, with more than $850 million of that amount being equity market value added.
The company ended 1996 with 207 locations and over $150 million in cash on its balance sheet. Then, with the weight of elevated competition, continued expansion demands, and the difficulty in maintaining same-store sales levels as their locations matured, the business model suffered and revealed itself. By the end of 1997, the company had grown to 265 locations, but the after-tax equity returns were a less impressive 13%, falling to under 7% in 1998, at which point the company's EMVA turned negative.
A year later, the company's after-tax current equity rate of return stood below 4%, with an equity capitalization valued nearly $380 million below its cost. Given that investors could buy the company shares below their cost to create, their market rate of return approximated 8%. Faced with equity rates of return on its own shares that exceeded the returns available from its corporate business model, Lone Star began to buy back stock, acquiring approximately $150 million worth of shares between 1998 and 2000.
Buying back shares of stock, just like paying dividends, has the impact of lowering company business investment, making the pie smaller. Only with stock buybacks, the selling shareholders get the cash as opposed to all shareholders ratably. The result is that the remaining shareholders will see comparatively higher earnings per share growth, but against the backdrop of a shrinking company. Mathematically, this often tends to have little impact on their expected rates of return. For Lone Star, the share repurchases did little to move the company's share price. By 2001, the company's poor performance caught the attention of an activist shareholder who, with holdings of just 1,100 shares, unseated Lone Star's founding CEO from the board of directors, where he served as chairman.
Ultimately, in August 2009, the company was taken private at a price just north of $27 a share. At the time, the company had reduced its restaurant count to 222 locations. That price turned out to be overly optimistic. Seven years later, the company would be in bankruptcy, with all its Lone Star locations shuttered, save a single independently owned outlet on the island of Guam.
Boston Chicken
About a year after Lone Star went public, a fledgling “fast casual” chain called Boston Chicken was listed on the Nasdaq exchange. Founded in 1985 in Newton, Massachusetts, the chain had expanded rapidly in the 1990s. Driven by the growth of its franchise community, most of whom were financed by the company, Boston Chicken was opening a location per day. To enable this growth, the company became a frequent equity issuer, while also accessing copious amounts of OPM. By early 1997, the company, now renamed Boston Market, had over 1,100 locations, with most of them franchised and collectively generating over $1 billion in revenues.3 By the end of the year, the company would report a loss of over $200 million on revenues of slightly over $460 million.4 Unsurprisingly, the company's share price plummeted by more than 82% over the course of 1997. A year later, the losses would accelerate, amounting to over $430 million for the first half of the year. With its liquidity effectively evaporated, the company would file for bankruptcy protection in October. Indeed, all the growth, together with a lack of transparency regarding restaurant location operating results, masked the company's faulty business model. In the end, Boston Market turned out to be mostly a lender having no loss reserves, providing capital to otherwise unfinanceable franchisees who collectively operated massively unprofitable locations that were plagued by excessive business investment demands given the sales amount each location was able to generate.
Less than a year following the Boston Chicken IPO, I was engaged in taking FFCA public. With our net lease portfolio exclusively devoted to restaurants and, given that Boston Chicken was the country's single hottest restaurant concept (often paying top dollar for real estate nationwide), we were frequently asked about our views on the chicken chain. Our comment was that we could not see our way to owning any locations because we did not understand the unit-level economics. The company and its franchisees would not share this data with us, but we suspected that Boston Chicken's business model was flawed. So did some of our shareholders, who tried in vain to bet against the shares as they rose to loftier levels before ultimately crashing to earth.
Value Investing
In 2013, Eugene Fama, a professor of economics at the University of Chicago, was awarded the Nobel Prize in economics for his work on efficient markets theories. In his influential 1970 review paper, Dr. Fama posited that stock prices reflect all available information. A corollary to the Efficient Markets Hypothesis (EMH) is that it is virtually impossible for the average investor to beat the market. This notion has been widely accepted and has given rise to a proliferation of passive stock market index funds. Memorably, in 2007, Warren Buffett bet $1 million that the S&P 500 would beat the 10-year performance of a basket of five hedge funds selected by a firm called Protégé Partners. By the end of 2017, the S&P 500 had gained over 85%, while the hedge fund basket had eked out a mere 22% gain.
Nobel Laureate Eugene Fama
Credit: © Nobel Media AB. Photo: A. Mahmoud
While this story again served as evidence that Dr. Fama was correct, it does not mean that all stocks are rightly valued based on their underlying business model fundamentals. “Animal spirits” can create valuation distortions that can last a while. Dr. Fama's observation simply meant that corporate share prices reflect their supply and demand based upon broadly held investor sentiment.
Business model fundamentals ultimately prevail. As a student of business models, I know these to be fundamental to wealth creation. In a famous 2008 letter to his shareholders, Warren Buffett paraphrased his former teacher, Benjamin Graham, saying, “Price is what you pay; value is what you get.” And, in being a value investor, Warren has a stated preference to buy “quality merchandise when it is marked down.” To my way of thinking, when it comes to stock purchases, this simply means investing in quality companies whose current market equity returns well exceed what might normally be expected by a rational investor.
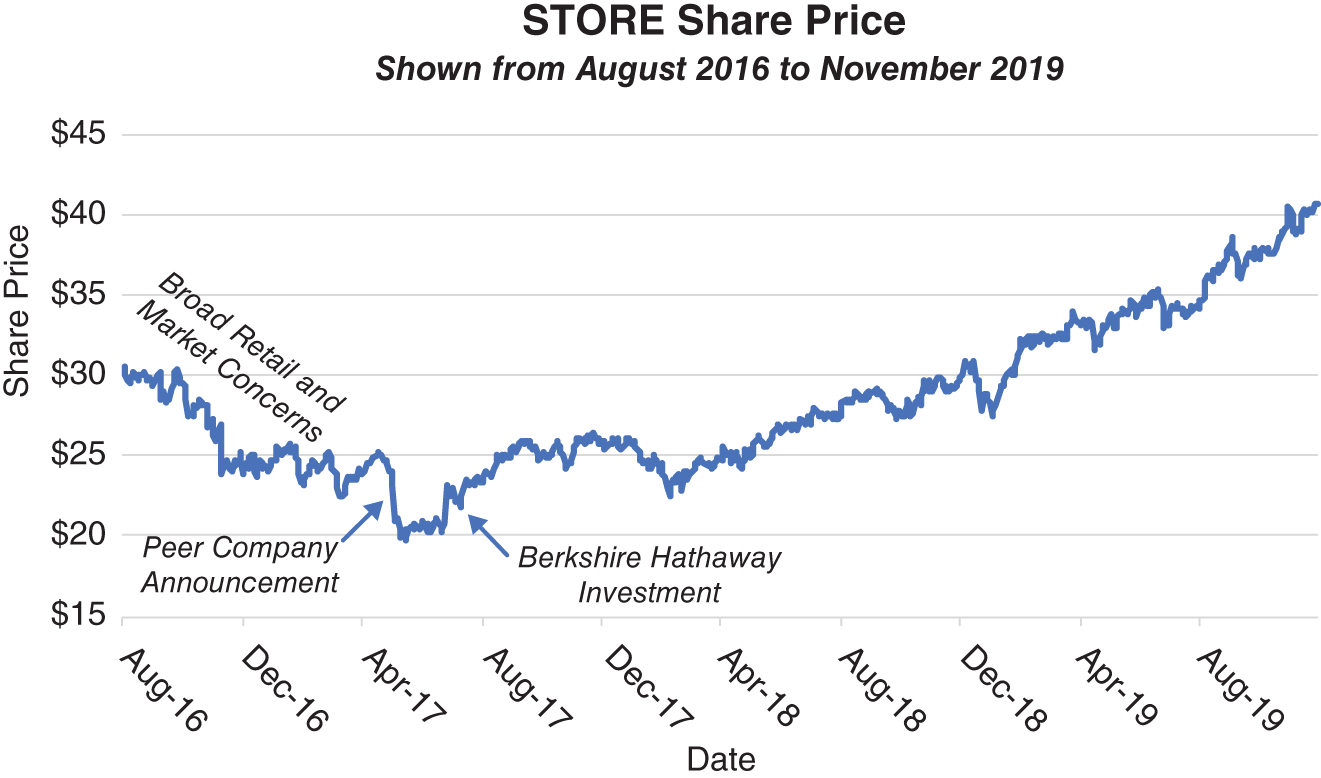
Like many business leaders, I have experienced the personal disappointment of being marked down. STORE Capital went public in October 2014 at a price of $18.50 a share. From there, the company successfully embarked on our planned path to deliver shareholders annual double-digit rates of return. But in the second half of 2016, investor sentiment turned. Interest rates started to rise along with economic growth expectations as investors began to rotate away from defensive dividend stocks, such as STORE. By the end of 2016, news outlets were rife with speculation regarding large estimates of future retail store closings resulting from potent online competition. While STORE was an acronym for Single Tenant Operational Real Estate, many investors unfamiliar with us simply assumed we had a lot of exposure to retail “stores” on the brink of closure. Given these multiple headwinds, our shares fell 20%, reaching a price of $24 by April 2017. Then, at the beginning of May, our shares declined another 19% to approximately $20 owing to a disappointing earnings call from a peer public company Mort Fleischer and I had co-founded in 2003. Investor sentiment assumed that their problems were also likely to be our problems. Meanwhile, with nearly all the share price gains from our IPO lost, our business model fundamentals remain unchanged. STORE was marked down and delivering a high level of current market equity returns.
Before we took STORE public, I approached Berkshire Hathaway, a renowned value investor led by Warren Buffett, with a business proposition, sending an email to the company's general mailbox. Berkshire declined my proposal but liked our business model and the talented team we had assembled. They continued to follow STORE, reading our press releases, earnings call transcripts, and investor presentations over the years. Benefiting from this research, they were prepared to invest when we were marked down. So, in June 2017, Berkshire approached us to buy 10% of STORE's equity, ultimately acquiring just shy of that a week later through a direct stock sale. Of course, we did not like the share price, but we also knew we could make accretive use of the proceeds from the approximately $375 million stock issuance. Bob Halliday's prescient advice regarding the importance of the availability of capital came to mind. More than this, in the face of an unwarranted selloff in our shares, we added to our roster a noted value investor. Basically, we got what amounted to an overnight “Good Housekeeping” seal of approval in an otherwise chaotic market. Our shares immediately rebounded more than 11% and continued up from there. By the end of 2017, our shareholders benefited from a double-digit rate of return for the year. By November 2019, with our shares approaching $40, the annual return to Berkshire Hathaway for their opportunistic value-driven decision was better than 30% annually.
Businesses are the driving force of EMVA creation, which is fundamental to our overall economic growth and the essential element that gives rise to the creation of the largest personal fortunes ever assembled. But every so often, companies can be mispriced, resulting in a decline in EMVA and a rise in current market equity returns. This is the fertile ground where value investors seek to play.
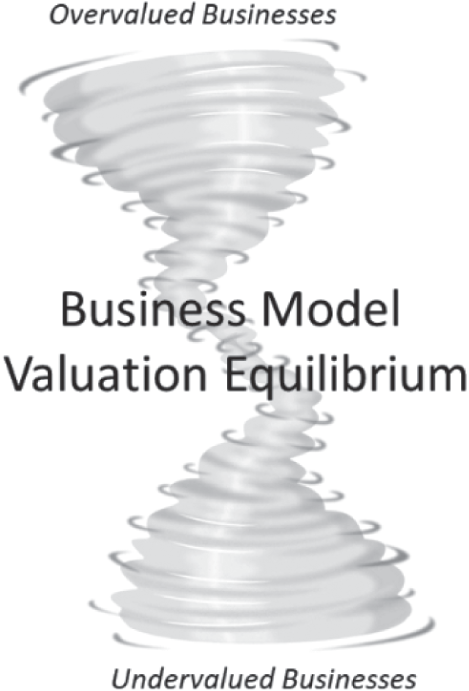
I believe business models lie at the vortex of value. Think of a whirlpool in which excessively valued businesses ultimately find their values sucked into the center. They may be able to defy gravity for a while, but business models eventually provide the ultimate valuation litmus test. Now also think of an inverted whirlpool, wherein poorly valued companies ultimately see their valuations get sucked upward. Value investors tend to hover within the inverted whirlpool, trying their best to avoid the animal spirits that often surround companies residing above the vortex of the whirlpool. Interestingly, this is also where private company business leaders tend to congregate. While private companies can be subject to valuation volatility and euphoria, such tends to be far less than with public companies. None of the companies I have been associated with have ever had the luxury of being able to raise capital without an articulated business model. None of our businesses have benefited from overhyped stock prices in a public market. Instead, like most businesspeople, we have had to demonstrate our ability to support OPM, deliver equity returns, and create EMVA.
Notes
- 1. Center of Research in Security Prices, LLC.
- 2. Most of the historical facts were obtained from Lone Star Steakhouse & Saloon, Inc., History, http://www.fundinguniverse.com/company-histories/lone-star-steakhouse-saloon-inc-history/.
- 3. Funding Universe, Boston Market Corporation History, http://www.fundinguniverse.com/company-histories/boston-market-corporation-history/.
- 4. Louise Lee, “Worst One-Year Performer Boston Chicken Gets Booby Prize,” The Wall Street Journal, February 25, 1998.