
11 The Ingredient Diagram
Ingredients of Your Headscratcher
If you were asked to bake a chocolate cake but weren't sure what the ingredients for this particular recipe were, how good a cake could you bake? It probably wouldn't be that great. Similarly, if you're going to solve a problem, but you're not clear on the variables affecting the problem, how good a solution do you think you can create?
The ingredient diagram is a tool that helps you transition between clarity and conclusions. At this point, you're still getting clear on the headscratcher. However, you are also now starting to get ideas about where to look for solutions. The ingredient diagram helps you understand the variables defining your headscratcher. Your solution will incorporate all, or many, of the variables.
Here's a very simple example: Your car has a full tank of gas. You're planning a long road trip during which you will need to stop for gas. There are many variables that affect how far you can go with a full tank of gas. You look at a map and ask yourself, “Where along the route should I stop?” One of the key ingredients of this headscratcher is your car's miles per gallon (MPG) rate. Without determining this ingredient (variable), your solution won't have much of a basis. Another variable is your speed. The rate at which you're driving will affect how often you'll need fuel for your car. Other ingredients might be how much traffic there is, how many passengers you are carrying, whether you are hauling a trailer, and your tires' air pressure. To a lesser extent, you might consider the wind speed and whether you're driving into or against the wind. If you knew all of these ingredients, you could calculate a very accurate solution for when you should stop for gas.
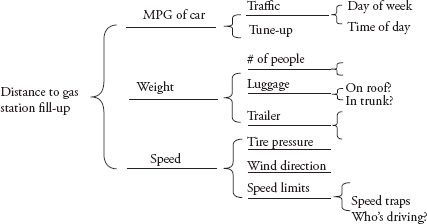
A headscratcher's ingredients are the variables that define it. It often helps to draw what's called a fishbone diagram (called this because the sideways tree branches look a little like a fish skeleton). For the preceding headscratcher, the distance you can travel before having to stop for gas, the diagram might look like Figure 11.1.
The distance you can travel before having to stop for gas is a function of the following high-level ingredients: the car's rated MPG, the weight of the carload, and the car's speed. If you traverse the branches for each of these, starting with MPG, you're looking at the ingredients that make up MPG. In addition to what your car manufacturer rated the vehicle, your individual MPG will also be a function of the traffic you encounter and whether your car is in tune or needs maintenance. Moving along the ingredient diagram, look at the ingredients for traffic. This might include the day of the week and the time of the day. Similarly, you would fill in the branches for weight and speed.
A few comments about the ingredient diagram: first, it can continue for pages. The preceding example was very simple, but if your headscratcher is how to improve productivity and you created an ingredient diagram for productivity, it has the potential to go on for many levels and pages. You know you're done with a branch when the terms on it repeat or are used on another branch or when there are no longer any additional ingredients to specify on that branch. For example, along the weight branch, because an average weight is a numeric value, there are no additional ingredients beyond that.
The solution for when to stop for gas has the ingredients shown in Figure 11.1. If you want just any solution, you might use the rated MPG of your car—and there's your answer. If you want a better solution, then you continue. The more variables of the ingredient diagram you take into account, the more accurate solution you will have.
Try this for yourself. Here's a headscratcher: How do I get my kid to clean up his room? This falls into a broader category of headscratchers about how you get someone to do something—with the operative word being get. You ask yourself: What are the variables to get someone to do something? If you want your kid to clean his room, you might have to give him an incentive (ingredient 1)—perhaps money or a privilege, such as permission to play outside. You might have to say something, such as “If you don't clean up your room, you can't watch TV.” This would be a consequence (ingredient 2). You might have to give the reason (ingredient 3): perhaps you're having relatives visit. Go ahead and draw an ingredient diagram for get. In the end, you might have to implement all the ingredients to get the results you're seeking.
Now for something more complicated: improving your productivity. Let's begin an ingredient diagram for productivity (Figure 11.2).
As you can see in Figure 11.2, the ingredients for productivity generally include the following elements: the amount of work you have, the time it takes to do it, and the quality of the work you produce. Moving along the branch of time, the ingredients here are your manager, because he or she can give other tasks (distractions), take things away, and change priorities. (You can fill in the diagram with more specific details.) Your time is also a function of the tools you use. Whether your computer is slow or fast or whether you have the right applications and know how to use them will all affect how much time something takes. Later in the tree, you see training under applications, because you need to be trained to use the applications; additionally, support is there because you need to get questions answered quickly. Your focus is also an ingredient of time. When you can focus with no interruptions and low noise levels, you get far more done. For an exercise, keep going with the productivity ingredient diagram.

Of course, if you want to improve your productivity, getting a faster computer might help somewhat. However, a much more comprehensive solution for improving productivity will include all—or at least many—of the variables that define productivity in the first place.
The next step in the ingredient diagram is to assign weights to each ingredient. In the sample when to stop for gas ingredient diagram, the car's MPG rating will be much more important than the wind direction or the number of passengers you're carrying. Assigning weights allows you to prioritize where to spend your time as you start to create solutions. Make sure your solutions incorporate the heavily weighted ingredients. In the productivity example, you should weight the applications you use more heavily than getting a slightly faster computer. The ingredients with greater weight will have a greater influence on solutions.
Getting Started with the Ingredient Diagram
Here are a few places you can use an ingredient diagram:
- When you don't know where to start: If you think you're clear about a situation but have no idea where to start to think about it, begin with an ingredient diagram to define your headscratcher's variables. Your starting point will become clearer.
- During brainstorming and in group participation: The ingredient diagram is a great place to discover new definitions and interpretations for getting clear on an issue with a group. In the case of “We need to improve our productivity,” you might have two diagrams—one for productivity and another for improve. Then you can begin to ask specific questions: What do we mean by improve? What would the variables (goals, metrics, monitoring, corrective action, etc.) be?
- When figuring out who to get involved: In getting clear on and subsequently solving a problem, it's necessary to involve the right people. Perhaps one of the ingredients in a headscratcher about improving productivity is incentives. An ingredient of incentives could be rewards, as well as the human resources (HR) department (because it would need to approve them). Therefore, creating an ingredient diagram on productivity helps you discover that HR needs to be involved. Getting HR's support early to help identify possible solutions would be far better than informing the department after the fact about something it can't approve. Your ingredient diagram may uncover the need to get various people or groups—colleagues, vendors, or even your customers—involved sooner in the process.
- When figuring out where to put your energy: When you fill in your ingredient diagram, you'll assign weights to the ingredients. Ingredient 1 might weigh very heavily in your headscratcher, whereas ingredient 2 might not. This will help you determine where to put your focus and energy as you look for solutions.
The Takeaway
The solution to a headscratcher will incorporate the variables (ingredients) that define the headscratcher. Use the ingredient diagram to uncover what those variables are.
Exercises for the Ingredient Diagram
- Create an ingredient diagram for learning to ride a bike. What are the ingredients involved in this process? (Hint: Bike, training wheels, parent, practice, support, and Band-Aids.)
- This is a tough one: create an ingredient diagram for communicate, in the context of how to communicate better with peers in another department. What are the ingredients here? (Hint: What do you want to communicate? What are some ways to communicate [e-mail, phone]? Is this communication one-way or two-way [listening]? What do relationships have to do with it?)
- Group exercise: With a few of your peers, create an ingredient diagram for “What should we do for lunch?” (Hint: Cost, number of people, time, distance, appetite, and cuisine.)
- Create an ingredient diagram for automate, in the context of what you can automate in your business that you do manually now.