
5. Accounting Dilemmas in Valuation Analysis
Market View
The Bristol-Myers Squibb Company was formed in 1989 after the merger of pharmaceutical companies Bristol-Myers Company and the Squibb Corporation. In 2004, the company agreed to pay $150 million to the U.S. Securities and Exchange Commission (SEC), the second-largest payout obtained by the SEC, in an accounting case against a public company. According to the SEC’s complaint, Bristol-Myers Squibb engaged in “channel stuffing” from January 2000 through December 2001 to report higher sales and profit on its income statement, presumably to meet Wall Street’s earnings expectations. Channel stuffing refers to the practice of shipping unordered goods to customers, usually with a guarantee for the customer to return any unsold merchandise. Bristol-Myers Squibb’s officials admitted that the company had overstated sales and profit over a three-year period by approximately $2.5 billion and $900 million, respectively. The SEC filed civil fraud charges against two former executives for orchestrating a fraudulent earnings management scheme in 2005, but these charges were not settled until 2012, more than a decade after the alleged channel stuffing.
Bristol-Myers Squibb apparently felt that it was important to report strong results on its income statement, even if it meant violating generally accepted accounting principles. Channel stuffing is difficult to spot, but there was one telltale sign that something was wrong with the company’s reported results. In the three years preceding the alleged channel stuffing, the inventory turnover ratio had been constant at 2.1 times. In 2000, it increased to 2.6 times, and in 2001, it increased again to a staggering 3.7 times. Any analyst used to looking for signs of potential earnings management would have viewed this significant increase in the inventory turnover ratio as a red flag. Because channel stuffing is a way of getting rid of excess inventory, it often affects working capital ratios such as the inventory turnover ratio and, potentially, the accounts receivable turnover ratio, particularly if the company is extending credit terms to convince its customers to take more goods than they need.
The Bristol-Myers Squibb case illustrates several points. First, even highly visible companies feel considerable pressure to “make the numbers.” Second, despite having competent outside auditors reviewing corporate numbers, accounting irregularities persist. Finally, and this is an important takeaway for analysts, the financial statements and disclosures usually contain sufficient information to perform comprehensive due diligence and identify any issues that would affect a company’s fundamental value.
The analytical techniques for assessing past and future company performance discussed in Chapter 2, “Financial Review and Pro Forma Analysis,” are only part of the valuation process. Any financial review and pro forma analysis would be incomplete without also considering the comparability and reliability of a company’s accounting data. Thus, this chapter deals with the various accounting measurement and reporting dilemmas that usually affect valuation analyses. Specifically, this chapter addresses the following four questions:
• Given the financial reporting differences that can exist between companies, and even within a company over time, is it necessary for an analyst to restate a target’s financial statements before undertaking a financial review and pro forma analysis?
• Which income statement transformations are necessary for an analyst to correctly estimate a target’s permanent earnings and, hence, free cash flows (FCFs)?
• Which balance sheet transformations are necessary for an analyst to correctly estimate the equity value of a target?
• Which cash flow statement transformations are necessary for an analyst to correctly estimate a target’s cash flow from operations and, hence, FCFs?
1 Assessing Economic Reality
To illustrate the kind of accounting dilemma that can arise when undertaking a financial review, consider the data in Exhibit 5.1. This exhibit shows the income statement and selected financial ratios for two economically identical companies. The two companies, First-in, First-out (FIFO) Company and Last-in, First-out (LIFO) Company, differ only with regard to the accounting method used to measure their cost of sales and ending inventories.
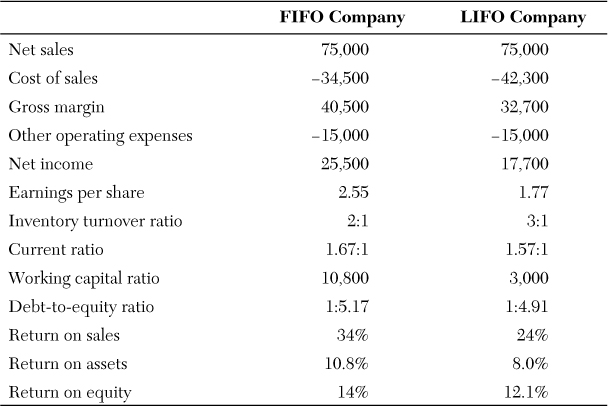
A review of this data tells the story: As inventory costs are rising, FIFO Company appears to be financially better off than LIFO Company. This is because the cost of sales is equal to beginning inventories plus purchases during the period minus ending inventories. Under FIFO, the oldest (and cheapest) units are sold first, leaving the newest (and more expensive) units in ending inventories. In contrast, under LIFO, the newest units are sold first and the oldest units are reflected in ending inventories. When unit costs are rising, ending inventories are higher under the FIFO method, resulting in a lower cost of sales. As a consequence, FIFO Company’s earnings are higher; the current ratio and the working capital ratio, two liquidity indicators, are higher; financial leverage, as measured by the debt-to-equity ratio, is lower; and the profitability indicators of return on sales, return on assets, and return on equity are all superior. Only the inventory turnover ratio appears better for LIFO Company.
Can the analyst assume that these accounting results depict economic reality? Holding the question of income taxes aside, the answer is an emphatic “No!” The two companies are economically equivalent, despite what the financial data might otherwise indicate. In essence, the different assumptions regarding the LIFO and FIFO inventory costing methods mask the real economic performance of the two companies.
If the analyst also considers the effect of income taxes and assumes that each company uses the same inventory costing method for both income tax and financial reporting purposes, the answer is quite surprising. LIFO Company is economically more valuable because it preserves greater cash flows as a consequence of its lower taxable earnings. Thus, contrary to the financial indicators reported in Exhibit 5.1, LIFO Company might be a superior acquisition target. The analyst must consider whether to undertake an accounting transformation for one or both companies to make the financial data more directly comparable.
At the heart of this and most other accounting dilemmas is the following question: Is the quality of the available accounting information sufficient for financial review and pro forma analysis without some form of data transformation? The following sections discuss key accounting dilemmas relating to the income statement, balance sheet, and statement of cash flows that are likely to be a source of bias in financial data. We also consider practical approaches for dealing with these dilemmas.
2 Income Statement Transformations: Forecasting Permanent Earnings and Free Cash Flows
Before undertaking a pro forma analysis, an analyst should ensure that all the income statement items are recurring and, if necessary, eliminate the nonrecurring items. The analyst should then determine the reliability of the target’s revenue and costs, and thus review the company’s revenue recognition policy and the two primary accounting choices affecting its costs: the inventory costing policy and the depreciation policy. These elements are discussed in turn.
2.1. Recurring and Nonrecurring Events
The financial community widely accepts that the purchase price to be paid for an asset should be the present value of the asset’s future cash flows. As Chapter 2 discusses, one of the key drivers of cash flows is earnings. Therefore, the price that a buyer should be willing to pay for a target is a function of its future earnings. Nonrecurring earnings, by their nature, are transitory and should not be considered part of the future value of the company. Thus, preparing pro forma financial statements involves forecasting the future permanent earnings of a target. Permanent earnings—that is, recurring operating earnings, excluding such one-time items as discontinued operations, extraordinary and unusual items, and one-time write-offs and charges—are the principal source of FCFs. One key to successfully forecasting permanent earnings is deciding which income statement accounts to project and which ones to ignore.
Fortunately, existing income statement disclosure practices make identifying the nonrecurring components of earnings relatively straightforward. The income statement typically highlights these single-period events, often labeling them “unusual,” “abnormal,” or “extraordinary.” International Financial Reporting Standards (IFRS), now widely used around the world, prohibit companies from labeling income statement components as “extraordinary.” However, it allows the separate reporting of material and/or exceptional items. Some countries, however, have no requirement for separately identifying recurring and nonrecurring items. As a consequence, the analyst must carefully review the components of the income statement to identify any single-period events that should be ignored for pro forma statement purposes.
Income statement transformation is necessary, for example, when a company undertakes a large asset write-off to remove nonproductive assets from the balance sheet, an event that is often described as “taking a bath.” This cleansing of the balance sheet usually produces an income statement loss that might appear among the recurring items on the income statement under IFRS. Because such a write-off is transitory in nature, it should be ignored for the purposes of forecasting the company’s permanent earnings.
We now turn our attention to the important area of revenue reporting. Revenue reporting practices often differ among companies in the same industry and can also change for a given company across time, as illustrated in the vignette at the beginning of this chapter. Because forecast revenues are so important to the process of valuing a company, a review of a target’s revenue recognition policy is an excellent place to begin an analysis of income statement data.
2.2. Revenue Recognition Policy
As Chapter 2 discusses, valuation analysis begins with a thorough historical financial review. Analyzing a company’s revenue recognition policy is central to this activity, and it provides evidence of the reliability of the data as a description of past performance and an indicator of future performance. Most pro forma analyses begin with a projection of revenues, and validating the reasonableness of a company’s reported revenue streams is crucial when constructing an effective pro forma statement.
When evaluating the revenue recognition policy of a potential acquisition target, the analyst must compare the policy in use with accepted industry practice. The use of an industry-accepted method is reassuring, but it does not guarantee that a company’s revenue stream will be risk free or even bias free. Aside from the lack of predictability of revenues, analysts are frequently concerned about companies that are overly aggressive in their revenue recognition. Overly aggressive revenue recognition is often referred to as front-end loading, and it occurs when a company records sales prematurely, perhaps before it receives a firm offer to buy. The channel stuffing practice Bristol-Myers Squibb used is a typical example of front-end loading. Front-end loading can also happen if goods are being produced under contract and revenues are booked before the company has attained sufficient completion levels.1
Front-end loading causes revenues; earnings before interest, taxes, depreciation, and amortization (EBITDA); and estimates of permanent earnings to be overstated. These overstatements can translate into overly optimistic forecasts of corporate profitability and can produce an inflated valuation of the target. Fortunately, a target’s cash flow from operations (CFFO) is less sensitive to the effects of aggressive revenue recognition because of the inclusion of such working capital accounts as trade receivables and deferred (or unearned) revenue. Thus, if an analyst compares a company’s current net income with its CFFO (the cash-basis equivalent of net income) over multiple periods, he or she can assess the reliability of the company’s revenue recognition policy to accurately portray its ability to generate cash flow.
Some analysts evaluate the strength of the relationship between a company’s revenue recognition policy and its ability to generate cash flows by calculating a ratio of cash sales to accrual sales. Cash sales, or cash collections from sales, is calculated by adjusting net sales from the income statement for any change in trade receivables and customer prepayments. When the value of this ratio is consistently low (less than 0.7), it often indicates aggressive revenue recognition, suggesting that current levels of reported revenues could be an inappropriate basis for forecasting future revenue levels.
When an analyst evaluates a target’s revenue-generating function, he or she is usually trying to identify factors that could cause a deceleration in or deterioration of a company’s revenue flows. In addition to identifying the various economy-wide and company-specific factors that can adversely affect revenues, the analyst must evaluate two other risk factors: (1) the risk that the revenues have been recorded too early and that a final sale might not be consummated (front-end loading risk) and (2) the risk that, once consummated, the sale might not yield the anticipated level of cash inflows (cash collection risk). A company can minimize its exposure to these risks through accounting policy choices. A company that adopts a conservative revenue recognition policy effectively minimizes front-end loading risk. A company that implements a well-conceived credit-granting policy and maintains a sufficient reserve for covering any future uncollectible amounts effectively minimizes its cash collection risk.2
For each type of revenue risk, accounting standards call for the creation of a reserve account to reflect the degree of riskiness associated with the cash flows generated by the revenue function. These reserve accounts—the allowance for sales returns and the allowance for bad debts (also called allowance for doubtful accounts or allowance for uncollectible accounts), respectively—are contra-asset accounts on the balance sheet and have parallel accounts on the income statement: sales returns, a contra-revenue account, and the bad debt account expense (also called the doubtful account expense or uncollectible account expense), respectively. The analyst should review these risk-related accounts with two questions in mind: (1) Does the reserve account indicate that a company’s cash flow from revenues is exposed to a significant degree of risk? and (2) does the size of the reserve account appear reasonable, given the analyst’s assessment of the company’s exposure?
The second question requires the analyst to assess how reasonable management’s estimate of a company’s risk exposure is. Some managers intentionally underestimate the reserve accounts as a means of improving their company’s reported profitability, hence artificially increasing the company’s value. To illustrate, consider the accounting for the allowance for doubtful accounts that Nortel Networks Corporation used in 2002 and 2003. Although the company’s gross accounts receivables at year end 2002 and 2003 was essentially unchanged, at $2.6 billion, Nortel reduced its allowance for doubtful accounts from $517 million in 2002 to just $256 million in 2003. In essence, the company’s allowance account as a percentage of gross accounts receivables declined from nearly 20 percent in 2002 to just 10 percent in 2003. This decline in Nortel’s allowance account was accompanied by an equivalent $261 million increase in pre-tax net income. Most analysts viewed the 50 percent decline in Nortel’s allowance account suspiciously, as did the SEC, which eventually investigated Nortel’s accounting choices. A decline of this magnitude in the allowance for doubtful accounts in just one year suggested that the financial fortunes of Nortel’s credit customers dramatically improved from 2002 to 2003, an unlikely scenario, given the shortness of the time period involved.
The Nortel example illustrates the difficulty an analyst often faces when analyzing a target’s revenues. Because it is clearly one of the most important areas of the valuation review, the analyst should, at a minimum, consider the following items:
• Develop an understanding of a company’s principal revenue-generating activity. Prepare a list of the potential macro-level factors (such as currency movements, expected inflation rate, and interest rate movements) and micro-level factors (such as barriers to entry, management track record and stability, new competitor products, and labor unrest) that can materially affect the company’s revenue flows.
• Review the discussion of revenues in the management discussion and analysis and the summary of significant accounting policies to identify how and when the company recognizes revenues. If the method in use is not the industry standard, explore any reasons why the company is using an alternative method.
• Compare the cash collections from sales with net sales reported on the income statement, in conjunction with the average receivable collection period. Although there is a naturally occurring lag between revenue recognition and cash collection, the lag period, as measured by the receivable collection period, should not exceed the normal cash collection cycle of an industry. An excessive or growing lag period usually indicates an aggressive revenue recognition policy, a substandard credit-granting policy, poor credit management, or a combination of these factors.
For most companies, the two largest deductions from revenues in the calculation of net income before taxes are cost of sales and depreciation expenses. Hence, in addition to reviewing the revenue recognition policy just described, the analyst should review the accounting policies associated with these major expense items before undertaking any pro forma work.
2.3. Inventory Costing Policy
With respect to cost of sales, the main accounting methods include the specific identification method, FIFO (first in, first out), LIFO (last in, first out), and the weighted average cost method. The specific identification method is used for uniquely identifiable products, for which the cost of sales reflects the exact cost of each product. Under FIFO, the oldest units are sold first and the newest ones remain in ending inventories; under LIFO, the newest units are sold first and the oldest ones remain in ending inventories. Under the weighted average cost method, the cost of sales reflects the average cost of the products available for sale (beginning inventories plus purchases during the period). Nowadays, LIFO is permitted only in the United States.3
This diversity in accounting standards for inventories makes it essential for the analyst to carefully evaluate a company’s chosen inventory method. The LIFO/FIFO illustration in Exhibit 5.1 demonstrates that the inventory costing policy can have a material effect on the company’s income statement and balance sheet. When prices are rising, LIFO provides a better match between revenue and cost of sales and, thus, limits the inflationary effect on earnings. However, ending inventories is understated. FIFO gives a better indication of the value of ending inventories, but cost of sales is understated, leading to higher earnings. The cost of sales and ending inventories values provided by the weighted average cost method usually fall between the LIFO and FIFO values.
Concerned that the value of ending inventories under LIFO can become materially understated relative to its fair value, the Financial Accounting Standards Board (FASB), the organization that develops Generally Accepted Accounting Principles (GAAP) in the United States, mandates the disclosure of certain information to help analysts correctly value a company’s ending inventories. Exhibit 5.2 provides selected financial data for Imperial Sugar Company in 2009 and 2010, and shows the type of information that can be found in the footnotes to a company’s financial statements.

Imperial Sugar’s disclosures reveal that the company uses LIFO to value some of its inventories. If it had used FIFO instead of LIFO, the ending inventories values reported on the balance sheet would have been $33.1 million and $4.0 million higher at the end of September 2010 and 2009, respectively. These amounts are referred to as the inventory reserve (or sometimes LIFO allowance), and they can be used not only for revaluing the ending inventories on the balance sheet, but also for estimating Imperial Sugar’s EBITDA as if the company had been using the FIFO method.
To illustrate this data transformation, observe that the inventory reserve is a measure of the difference between the current (or replacement) cost of ending inventories and its LIFO-calculated cost basis. By adding the inventory reserve to the balance sheet value of LIFO-costed ending inventories, the analyst can restate the inventory account to its current value. Thus, if Imperial Sugar had been using FIFO instead of LIFO, the company’s inventories at the end of September 2010 would have been approximately $94.8 million ($70.6 million + $24.2 million) instead of the $70.6 million actually reported. Imperial Sugar’s effective tax rate in 2010 was 35.8 percent, so the tax payments would have increased by $11.8 million ($33.1 million × 35.8%) and retained earnings would have been $21.3 million higher ($33.1 million × [1 − 35.8%]). The Imperial Sugar data show that the effect of this inventory method transformation can be quite material: Imperial Sugar’s inventories and shareholders’ equity are up by 29 percent!4
Whether the analyst should restate a target’s earnings for the use of LIFO or FIFO is debatable. Clearly, if the analyst is comparing one target with another, this restatement is desirable to provide an unbiased comparison of results. If the analyst’s task does not involve comparing acquisition alternatives, however, restatement from LIFO to FIFO might be not only unnecessary, but also undesirable. FIFO tends to produce the highest level of EBITDA, a widely used metric when using an earning multiple method, so a restatement to FIFO could cause an acquirer to pay top money for a potential acquisition. On the contrary, restatement from FIFO to LIFO might provide a more realistic valuation.
The question of whether to restate earnings also arises when a company has changed its method of accounting for inventories and cost of sales. To facilitate the comparison of a company’s financial results over time, companies are discouraged from making changes in accounting policy. Most accounting changes, other than those mandated by accounting standard setters, tend to result in a higher level of reported earnings. For example, in most circumstances, a change in accounting method from LIFO to FIFO results in a higher level of reported profits. Anecdotal evidence suggests that managers often undertake these policy changes to help disguise a company’s otherwise poor operating performance.
Exhibit 5.2 illustrates an additional type of event that occasionally affects the financial results of companies using the LIFO method: Earnings (and, hence, company valuation) could be artificially increased by a reduction in inventories levels. A liquidation of inventories levels can occur because of improved inventory management, because of the adoption of a just-in-time inventory system, or simply in response to a downturn in business. When this occurs, LIFO cost of sales consists of two components: (1) the cost of inventory acquired or manufactured during the current period and (2) the cost of inventory acquired or manufactured during earlier periods. Because of creeping inflation, prior-period costs might be much lower than current manufacturing costs, thus artificially increasing EBITDA. This type of artificial increase is a good example of what some analysts refer to as phantom profit, in that the additional profits associated with the inventory liquidation do not increase a company’s CFFO or FCF. In fact, an inventory liquidation can ultimately reduce these cash metrics because such phantom profits are subject to income taxes.
Exhibit 5.2 reveals that Imperial Sugar’s EBITDA artificially increased by $3.4 million, or about 1.6 percent, in 2010 because of LIFO inventory liquidations. As a consequence, the company’s income taxes also increased by approximately $1.2 million. In the eyes of most experienced analysts, LIFO-inventory liquidation profits are of questionable quality. However, the additional tax paid on the liquidation profit might be less detrimental to the company than the high cost of carrying excess quantities of inventories.
Following the cost of sales, the next-largest deduction against revenues is the charges associated with the use of a company’s long-term assets, namely the depreciation expense. Because of the magnitude of depreciation expenses and their effect on a company’s forecast earnings, we now turn our attention to depreciation policy.
2.4. Depreciation Policy
One of the most important accounting conventions is the matching principle, which requires that all expenses incurred for the purpose of generating revenues be reported on the income statement in the same period in which the related revenues are reported. Under this convention, companies are required to estimate the amount by which they use up their long-term productive assets—tangible assets such as their property, plant, and equipment—each period. For capital-intensive companies, the depreciation expense reported in the income statement can be large. However, these estimated expenses are merely allocations of previous cash outflows. Consequently, they are added back to earnings when a company’s CFFO and FCF are calculated. As a result of adding back these amounts, a company’s choice of depreciation method largely does not affect these cash flow-based metrics. However, this choice does affect valuations based on the price-to-earnings (P/E) ratio or the price-to-earnings before interest and taxes (P/EBIT) ratio.
Despite relative worldwide consistency in the set of accepted approaches to estimating depreciation, the analyst must be familiar with different practices when undertaking a comparative financial review. A first diverging practice relates to the choice of depreciation method for financial reporting purposes. In countries such as the U.K. and the U.S, where considerable differences exist in the calculation of reported versus tax income, the prevalent depreciation approach is the straight-line method. However, in countries such as Germany and Japan, where only deductions taken against reported income may be deducted against taxable income, the prevalent depreciation approach is the double-declining balance method. In these countries, the vast majority of companies choose the double-declining balance method to lower the amount of income subject to taxation. As a consequence, reported income tends to be systematically depressed, and unadjusted earnings-based valuation of companies from these countries is systematically downwardly biased.
Despite the presence of essentially identical assets, the economic life used in the calculation of depreciation can vary considerably among companies, even within the same industry, leading to a second important source of divergence in accounting for depreciation. For example, Lufthansa, the German airline, depreciates its fleet of aircraft over an average estimated life of 12 years, whereas British Airways, its U.K.-based competitor that is now part of the International Airline Group (AIG), depreciates its fleet over an estimated life of 18 to 25 years (an average of 22 years). Thus, the reported earnings of Lufthansa tend to be consistently lower than its competitors’, a pattern many German companies show. This systematic difference is likely to downwardly bias any unadjusted earnings-based (but not cash flow-based) valuation.
A third diverging practice, which is discussed in greater detail in a following section, is whether or not the periodic revaluation of noncurrent assets is permitted. U.S. GAAP, for example, does not allow the revaluation of noncurrent assets. In contrast, IFRS permits it, with the depreciation expense calculated not only on an asset’s historical cost, but also on any revalued amounts. In the many countries that have adopted IFRS, depreciation expenses can be overstated compared with depreciation expenses in a country such as the United States. Thus, valuation using an unadjusted earnings multiple method (such as the P/E ratio or P/EBIT ratio) can lead to a systematic understatement of company values, attributable to the higher depreciation charges resulting from noncurrent asset revaluation.
As the previous examples illustrate, considerable depreciation differentials may arise between companies holding essentially equivalent assets. Depreciation charges are merely allocations of prior-period cash outflows, so the analyst has two options when attempting to value a target: (1) Try to restate for the policy differences, particularly if using an unadjusted earnings-based valuation method, or (2) use a cash flow-based valuation method if restatement is impossible and the amounts associated with the policy differentials appear significant. Information contained in the footnotes to the company’s financial statements often enables the analyst to restate for the policy differences. For example, to place Lufthansa and British Airways on a common depreciation basis, Lufthansa’s depreciation charges could be reduced by an average of 45 percent (1 − [12/22]) to reflect Lufthansa’s shorter estimated lives and faster write-off schedule. However, restatement for differences in systematic depreciation method is usually quite speculative because information relating to the average remaining life of a company’s depreciable assets is rarely disclosed.5 The best way to account for depreciation policy differentials is to use a cash flow-based valuation method. In doing so, the calculation of FCF compensates for not only variance in depreciation methods, but also any variance in estimated useful lives.
The restatement dilemmas discussed thus far have largely concerned the income statement and the analyst’s desire to accurately forecast a company’s permanent earnings. We now consider potential balance sheet restatements. These restatements are usually driven by the analyst’s need to recalibrate a company’s total assets, debt, or net worth. Such recalibration can be desirable for estimating the equity value of a target in an unbiased manner.
3 Balance Sheet Transformations: Forecasting the Equity Value of a Company
In this section, we examine a number of balance sheet accounting dilemmas that include asset capitalization, asset revaluation, and off-balance-sheet debt. Data transformations for overcoming these dilemmas may be desirable to ensure an unbiased financial review and, in the case of off-balance sheet debt, to avoid an overestimation of a target’s equity value.
3.1. Asset Capitalization Policy
Asset capitalization policy refers to accounting decisions to record—or not to record—an asset on a company’s balance sheet. Capitalization of an expenditure is important from an earnings and cash flow perspective. An expenditure that is not capitalized is expensed when incurred, causing the cash outflow and a reduction in earnings to occur in the same accounting period. In contrast, an expenditure that is capitalized delays the matching process, causing the income effect to be recognized in a period subsequent to the actual cash outflow.
With the exception of companies in countries such as Germany and Japan, where tax considerations largely drive corporate financial reporting policies, the analyst should always investigate for the presence of rear-end loading. A company engaged in rear-end loading understates current-period expenses, causing current net income and total assets to be overstated. Regrettably, in an effort to improve current profitability, some companies postpone the recognition of certain expenses, thus violating the matching principle by inappropriately capitalizing these expenses to the balance sheet. Eventually, the inappropriately deferred expenses do pass through to the income statement in the form of amortization. When that occurs, future-period expenses are overstated, causing net income to be understated.
In general, the differences that arise between company asset capitalization policies can be segmented into two groups:
• Differences in accounting treatment at the time of asset acquisition
• Differences in accounting treatment subsequent to asset acquisition
The two major differences in accounting treatment are related to the capitalization of research and development (R&D) costs and interest costs on borrowings associated with the self-construction of an asset. We review them in turn.
3.1.1. Research and Development (R&D) Costs
The range of acceptable accounting treatments for R&D expenditures is quite broad: All R&D costs are capitalized in Brazil; some may be capitalized in Japan; and almost none are capitalized in the United States, where U.S. GAAP mandates that all R&D expenditures be expensed when incurred, with only a few exceptions. Under IFRS, however, all research costs must be expensed, but some developmental costs may be capitalized.
Reported accounting results also vary globally as a result of differences in the acceptable period of amortization for R&D expenditures that are capitalized. For example, the permissible period of amortization varies from five years in Japan and Sweden to a variable period of expected benefit in Brazil.
3.1.2. Interest Costs
Similar divergence exists globally regarding such high-profile expenditures as capitalized interest costs. U.S. GAAP, as well as accounting standards in countries such as Brazil, require that all costs incurred in the acquisition of an asset and the preparation for its intended use be capitalized into the balance sheet. A natural extension of this general philosophy is to require the capitalization of interest on funds borrowed during the period of an asset’s preparation or construction. Under this practice, the amount of interest to be capitalized is based on the interest charges actually incurred for a specific project. If the actual interest charges are unknown, a company is permitted to use its weighted average cost of debt and the average borrowings associated with the project to estimate the amount of interest to be capitalized. Although the capitalized interest charges are ultimately written off in the form of future depreciation charges, some analysts worry that current earnings will be overstated (as will valuations based on those earnings) because borrowing costs are being capitalized rather than expensed. Current earnings appear to be improved, but cash flows are actually reduced by the debt-service cash payments.
Many professionals view the capitalization of interest costs as an approved form of rear-end loading by accounting standard setters. They observe that because the cash outflow for interest charges occurs currently, it is inappropriate to defer the expense deduction until depreciation of the capitalized expenditures occurs at a later date. These professionals usually scan the footnotes to the company’s financial statements to assess the level of currently capitalized interest costs and then charge off those amounts against retained earnings, net of the related deferred income tax effect, under the assumption that the interest charges were almost certainly expensed for tax purposes.
Exhibit 5.3 presents interest capitalization data for a disguised real estate development company.
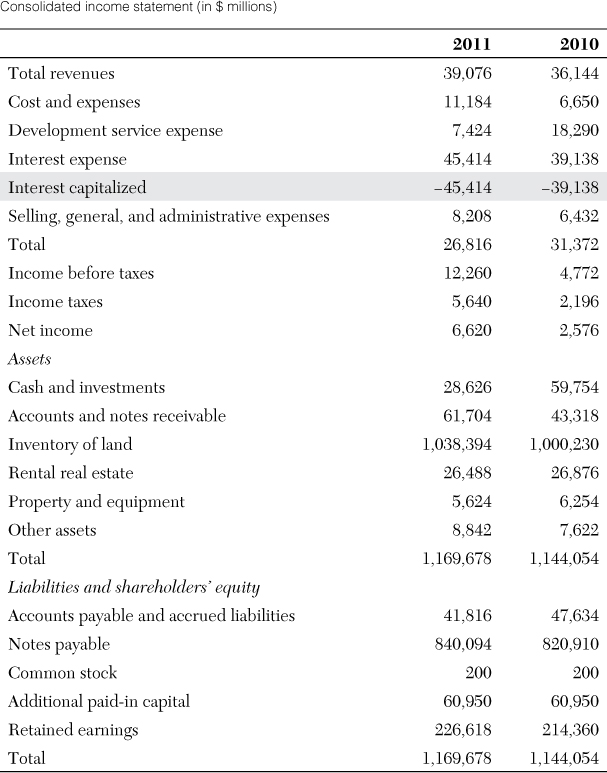
The shaded data tell the story: The company capitalized $45,414 million of interest. Without this interest capitalization, it would have reported losses before taxes of $33,154 million ($12,260 million − $45,414 million) in 2011 and $34,366 million in 2010 instead of reporting profits for both years. The restated net losses are much closer to the company’s CFFO, which was also negative because of the large cash outflows for borrowing costs.
3.2. Asset Revaluation Policy
In the previous section, we considered the accounting policy dilemma of whether to capitalize a cash expenditure. Now we address the related question of whether to revalue an asset to reflect changes in its fair value that are unrelated to the periodic depreciation or amortization of the asset.
It is well known that an asset’s fair value can increase in response to general or specific inflationary factors. An asset can also decrease in value as a company and/or its products fall out of favor with consumers. When the revenue-producing value of an asset declines (called an impairment), it is generally accepted that the value of the asset should be written down if the decline in value is considered to be permanent. An asset write-down is normally executed by a charge against earnings and an equivalent charge against the impaired asset. However, if an asset has been previously revalued upward using a revaluation reserve account, a component of shareholders’ equity, the write-down should first be charged against the revaluation reserve account. If the write-down exceeds the balance in the revaluation reserve, any excess should be charged against current earnings. Of concern to most analysts is the vagueness inherent in existing accounting standards that gives company executives considerable leeway in deciding when to take such impairment write-downs and in what amount.
To avoid paying for essentially worthless or otherwise overvalued assets carried on a target’s balance sheet, an acquirer should always undertake a rigorous due diligence review of all financial statement accounts before finalizing an acquisition price. This review is usually undertaken as part of the historical financial review that precedes the preparation of a target’s valuation. As the analyst reviews a company’s historical data in anticipation of developing pro forma statements, he or she should look for assets and other accounts that should be written down (or up) in value. The analyst’s dilemma is usually not determining that some revaluation will be necessary, but rather knowing the amount of the revaluation. Outside consultants can often provide valuation assistance for specific commodity-related assets such as real estate and nonquoted investments.
Under IFRS, it is generally accepted practice to periodically revalue assets whose values are affected by the inflationary effects of general and specific price-level movements. Thus, in countries that have adopted IFRS, much of the analyst’s task is already done. Nonetheless, the analyst will want to verify any upward valuation adjustments, to ensure that they are not overly optimistic. If a company’s assets have been revalued in accordance with IFRS and the analyst wants to compare the financial performance of the revalued company with that of a company without revaluation, the adjusted financial data must be restated. Because the revaluation reserve is usually reported as a component of shareholders’ equity, the easiest way to effect such a restatement is to write off the previous upward revaluation against the revalued assets.6
3.3. Off-Balance-Sheet Debt
Off-balance-sheet debt, or financial obligations that are not reported on the face of the balance sheet, plagues the financial reporting practice of every country in the world. In some countries, the incidence of off-balance-sheet debt is more prevalent than in others; however, no country escapes this accounting problem. Its presence places considerable responsibility on the analyst to identify all forms of existing company debt during the due diligence review.7 The three most common forms of off-balance-sheet debt are:
• Unconsolidated debt of a subsidiary or joint venture
• Contingent liabilities
• Executory contracts
3.3.1. Unconsolidated Debt
Accounting standards with respect to the consolidation of controlled subsidiaries vary greatly among countries. In the United States, the financial results of all majority-controlled subsidiaries (except those in bankruptcy or in the process of being sold) must be consolidated with the financial results of the parent company. In other countries, controlled subsidiaries may remain unconsolidated. This presents the challenging situation that debt obligations legally attributable to a parent company may remain unconsolidated.
Even in the United States, the debt position of a parent company may appear less highly leveraged than it really is. Some companies may have ongoing investments in joint ventures or R&D partnerships that are financed by a high level of debt. Others create special-purpose entities or vehicles (SPEs or SPVs) for specific projects or activities, and these SPEs may carry a high level of debt. Even if the debt of these associate companies is guaranteed by the parent, it may remain off the parent’s balance sheet; joint ventures, R&D partnerships, and SPEs are usually not consolidated, but are accounted for by the equity method. As mentioned in Chapter 3, under the equity method, the assets and liabilities of the associate companies are not reflected individually in the parent’s balance sheet. Instead, the parent reports its equity investments in these associate companies as an asset, which reflects the net asset values (total assets minus total liabilities) of all the associate companies. Consequently, the debt associated with many joint ventures, R&D partnerships, or SPEs is not identified as such, and the parent looks less highly leveraged than it truly is. To overcome this disclosure deficiency, it is a simple matter for the analyst to increase both the assets and the liabilities of the parent to reflect the quantity of debt carried on the books of the unconsolidated associate companies that can accrue to the parent through legal guarantees. This restatement permits an analyst to obtain a clearer picture of a parent’s potential outstanding debt.
To illustrate the extent to which unconsolidated debt can affect a parent’s solvency, consider the case of General Motors and its wholly owned financing subsidiary, General Motors Acceptance Corporation (GMAC). Before the FASB adoption of an accounting standard requiring the consolidation of majority-controlled subsidiaries, GM accounted for GMAC on an unconsolidated basis using the equity method. Following the adoption of the FASB standard, GM consolidated the operations of GMAC. The effect of this accounting change is illustrated by comparing the total debt-to-equity ratio for GM both with and without the operations of GMAC:

These figures illustrate the dramatic effect that can result when a parent fails to include the debt of an unconsolidated associated company: GM’s debt-to-equity ratio increased by 61 percent when GMAC’s obligations were added to those of the parent company.
3.3.2. Contingent Liabilities
Contingent liabilities represent a category of potential liabilities. Whether a contingent liability is reported in a company’s financial statements depends largely on management’s assessment of the probability of the liability’s expected occurrence. Under both IFRS and U.S. GAAP, if a contingent loss is probable and can be reasonably estimated, a liability should be formally accrued on the balance sheet, along with a loss on the income statement. If, in contrast, a loss is only reasonably possible, or if it is probable but the amount of the loss cannot be reasonably estimated, only footnote disclosure is required.
Unfortunately, the threshold of probable loss for the purposes of accounting for contingent liabilities is not explicit in the authoritative literature. This threshold is generally considered to be well above a 50 percent probability—somewhere between the probabilities of 70 and 90 percent. But the conditions that indicate a probable liability versus a reasonably possible liability vary among managers—and often among auditors. More often than not, probable liabilities end up being reported only in the footnotes or, unfortunately, not at all.
Assessing the fair value of contingent liabilities is often problematic, which can make data transformations challenging. Consider, for example, the case of Tronox Inc., a chemical company that Kerr-McGee spun off via an initial public offering (IPO) in November 2005 before being itself acquired by Anadarko Petroleum Company. Tronox filed for bankruptcy in January 2009, and four months later, it launched a $25 billion lawsuit against Anadarko, the owner of its former parent. Tronox claimed that Kerr-McGee underestimated the fair value of Tronox’s environmental contingent liabilities and thus misled investors at the time of the IPO. In November 2005, Tronox had $1.76 billion in total assets and $1.27 billion in total liabilities, leaving $490 million in equity on its balance sheet. Its reserve for environmental contingent liabilities, which was not reported in the balance sheet but was disclosed in the footnotes, was $224 million. However, based on a comparison of the amount of money comparable companies spent on environmental cleanup every year, Tronox argued that the fair value of the environmental contingent liabilities should have been $1.4 billion, or 6.25 times higher. Had Kerr-McGee correctly valued these environmental contingent liabilities, it would have been clear that Tronox’s financial health was not as strong as thought, and investors probably would not have valued the company’s equity at $556 million, a 14 percent premium.
At the time of this writing, the lawsuit has not been settled, but independently of the outcome, this case illustrates the difficulty in valuing contingent liabilities. All too frequently, managers are reluctant to recognize a loss and the related liability associated with contingent future events. The desire to avoid unpleasant news is quite natural, but analysts might need to take an aggressive stance regarding the restatement of published financial statements with respect to these contingent liabilities.8
3.3.3. Executory Contracts
A final category of off-balance-sheet debt involves a group of contractual agreements called executory contracts. These contractual commitments are accounted for off the balance sheet because the event triggering the commitment has not yet occurred. Consequently, executory contracts are principally disclosed through the footnotes, much like a contingent liability. Examples include operating leases, purchase and supply agreements, take-or-pay contracts, and working capital maintenance agreements.
To illustrate the accounting dilemma these contracts create, consider the following contractual arrangements:
• A company borrows $1 million from a bank and agrees to repay the borrowed amount, plus interest of $150,000, over 12 months.
• A company signs a noncancelable, nontransferable lease on retail space, agreeing to pay $1.15 million in rent over the next 12 months.
In both cases, the company has incurred an economic liability of $1.15 million over the coming year, ignoring the small difference associated with the time value of money. However, only in the first contract is the company obligated to record an accounting liability for future payments. The second contract depicts a typical operating lease, and many countries do not require recognizing the future lease payments on the balance sheet. Instead, the lease payments are recognized only on the income statement, as a lease expense when paid.
It is often difficult for cash flow-minded analysts to understand why the accounting profession differentiates operating leases and similar executory contracts from other accounting liabilities. Perhaps the best explanation comes from examining the similarities and differences in the two preceding contractual arrangements. Although both contracts involve approximately equivalent cash outflows, they differ in the amount of consideration received at contract signing. With the bank loan, consideration of $1 million was immediately received, and thus a liability for the repayment of that amount had to be recorded. With the operating lease, however, only a promise of future consideration—the opportunity to use the retail space—was received. For valuation purposes, this distinction is irrelevant. What matters is that the company has a noncancelable obligation to make future cash payments. Given this viewpoint, it is a simple matter for an analyst to restate a company’s statements for these unreported obligations if adequate information exists. For companies that provide adequate footnote disclosure, restating financial statements to depict uncapitalized leases and other off-balance-sheet debt items on the balance sheet is relatively straightforward.
To illustrate this restatement, consider the example of a company that leases substantial quantities of retail space via operating leases. Assume that the company’s incremental cost of borrowing is 10 percent and that the present value of the minimum future lease payments is $350 million, with $50 million due within 12 months and the rest due thereafter. Using this figure, the analyst can increase the company’s assets by $350 million and its liabilities by an equivalent amount.9
In 2011, the FASB and the IASB agreed on a joint lease accounting proposal that would affect all entities with leasing activities. The proposal is based on the concept of “right to use” and would effectively require companies to report all leases over one year on their balance sheet. In essence, all leases except the short-term ones would be accounted for as capital leases, in which the fair value of the leased asset and lease liability would be capitalized on the balance sheet.
4 Cash Flow Statement Transformations: Forecasting CFFO and Free Cash Flow
A key component of any financial review must involve a consideration of the amount, composition, sources, and sustainability of cash flow. Because of the importance of cash flow data to users of financial statements, most countries now require a statement of cash flows. The information typically appears in a relatively consistent format, segmented into three broad categories:
• Cash flow from operations (CFFO)
• Cash flow from investing (CFFI)
• Cash flow from financing (CFFF)
Because the cash flows of a company are an explicitly measurable quantity, the decisions regarding the selection of alternative accounting methods and the estimation of the expected useful lives of fixed and intangible assets do not affect cash flow metrics, holding aside the question of income taxes. Of concern, however, are management’s decisions on the classification of CFFO, CFFI, and CFFF. These decisions can affect company valuation.
To illustrate this concern, consider the case of Loews Corporation, a diversified holding company. In March 2006, Loews had to restate its cash flows for 2003, 2004, and the first three quarters of 2005 for the third time in less than a year because of “classification errors” associated with CNA Financial Corporation, an insurance affiliate. A first classification error was related to cash flows from equity investments, such as net purchases and sales of trading securities, changes in net receivables and payables from unsettled investment purchases, and sales related to trading securities as CFFI. Due to its activities, CNA should distinguish between return on investments, which should be reported as CFFO, and return of investments, which should be reported as CFFI. Instead, CNA classified all cash flows from equity investments as CFFI. Thus, it had to reclassify some cash flow items from CFFI to CFFO. A second classification error was related to the deposits and withdrawals associated with investment contracts, which were initially classified as CFFO and had to be reclassified as CFFF. As a consequence of the reclassifications, Loews’s CFFO for 2003 and 2004 increased by $782 million, whereas CFFI and CFFF decreased by $436 million and $371 million, respectively.
If an analyst had used CFFO as the starting point to forecast Loews’s FCF, he or she would have underestimated the company’s value. More importantly, the analyst would have had a biased understanding of the drivers of value at CNA and Loews. Valuation is not just about calculating the company’s value. It is also about determining how value is created and identifying the factors that can affect the value-creation process. Hence, it is paramount for an analyst to have access to high-quality accounting data.
Summary
In this chapter, we considered a number of important accounting measurement and reporting dilemmas that an analyst is likely to encounter. Although an analyst probably will not confront all the dilemmas in any one valuation project, some data transformation is almost always required, ranging from rearranging and combining income statement, balance sheet, or statement of cash flow items, to modifying the accounting measurement methods themselves. In some instances, the analyst will have sufficient information to transform the financial data from its original presentation to some preferred form of presentation; in other cases, when little information is available, the analyst merely notes the presence of a dilemma and subjectively incorporates its likely effect on financial ratios and other measures of risk and return. In any case, the analyst must identify and resolve such dilemmas before the financial review and development of the pro forma statements.
Many people in the financial community were optimistic that the United States would formally adopt IFRS in 2012, thereby eliminating many of the analytical dilemmas discussed in this chapter. That event did not occur, largely because of political and tax issues. Nonetheless, the work of the FASB and the IASB over the past three decades to converge the respective accounting standards dramatically improved the comparability of financial data prepared using U.S. GAAP and IFRS.
Because ambiguity of whether to transform financial data remains, what specific advice can we offer analysts? Recall that differences in accounting policy will likely have a far greater effect on unadjusted earnings-based valuation methods (such as multiples based on EBIT or net income) than on cash flow- or adjusted earnings-based valuation methods (such as multiples based on EBITDA). This is because cash flow-based and adjusted earnings-based models are less sensitive to accounting policy than unadjusted earnings-based models. Hence, when concerns about data restatement are high, analysts should consider using a cash flow- or adjusted earnings-based valuation method. However, because even these methods are accounting based, to some extent, their use might not overcome all data concerns (such as revenue recognition policies, the estimation of such revenue offsets as sales returns and bad debts, and inventory policy). In such cases, the analyst should undertake as many transformations as can be easily and readily executed in conjunction with a cash flow- or adjusted earnings-based valuation method.
Endnotes
1. Nelson, Elliott, and Tarpley (2003) report that earnings management most frequently occurs (in order of frequency) in reserves, revenue recognition, business combinations, intangibles, fixed assets, investments, leases, and compensation, among others.
2. In some countries, such as China and Switzerland, companies are not required to estimate future uncollectible amounts. Instead, they can write off receivables only after an account has been proven to be uncollectible, which can take years to confirm. One consequence of this direct write-off approach to accounting for bad debts is that earnings might be substantially overstated.
3. A uniquely U.S. tax rule requires that if a company uses LIFO for tax purposes, it must also use LIFO for financial reporting purposes. Given the very favorable tax consequences associated with the use of LIFO, it is not surprising that the vast majority of publicly held companies in the United States use LIFO for both tax and accounting purposes.
4. Assuming that an analyst wants to evaluate a target as if a company used FIFO for both tax and financial reporting purposes, the transformation would be accomplished by the following adjusting entry (using Imperial Sugar’s 2010 figures and assuming an effective tax rate of 35.8 percent):

5. An approach some analysts use to estimate the average expected remaining life of a company’s depreciable assets involves calculating the ratio of accumulated depreciation to the gross carrying value of depreciable assets. By comparing this ratio over time, an analyst can arrive at an estimate of the average expected useful life of a bundle of depreciable assets.
6. The necessary adjusting entry to achieve the restatement follows:
7. Failure to identify all forms of existing debt can lead to an overestimation of forecast equity value. Recall from Chapter 3 that the equity value of a company is equal to its entity value minus the market value of debt, noncontrolling interest, equity-related securities other than common stock, and contingency claims.
8. The procedure necessary for capitalizing off-balance-sheet debt is straightforward. First, calculate the present value of the expected future cash outflows necessary to satisfy the obligation. Second, determine whether the obligation is associated with the acquisition of an asset or the occurrence of a loss. Finally, capitalize the liability to the balance sheet, with a corresponding entry to an asset or a loss account. For example, an analyst who is valuing Anadarko and wants to reflect the potential cost of the lawsuit can do so as follows:
9. More specifically, the accounting entry would appear as follows:
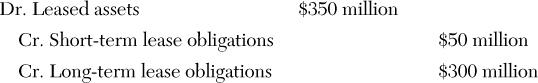
The analyst should note that restating the balance sheet with this entry also requires considering the effect of the restatement on the income statement. With capitalization, the lease expense needs to be replaced by depreciation expense on the newly capitalized asset and interest expense on the lease liability. Hence, capitalization requires that the analyst make certain assumptions about such items as depreciation method, salvage value, and expected life of the newly capitalized asset.