In this recipe, you will set up a simple CloudWatch dashboard, and you will learn about the different kinds of widgets that can be added to a dashboard:
- Log in to your AWS account and navigate to CloudWatch:

CloudWatch
- Go to the Dashboards section of the console via the link on the left-hand menu and click the Create dashboard button:
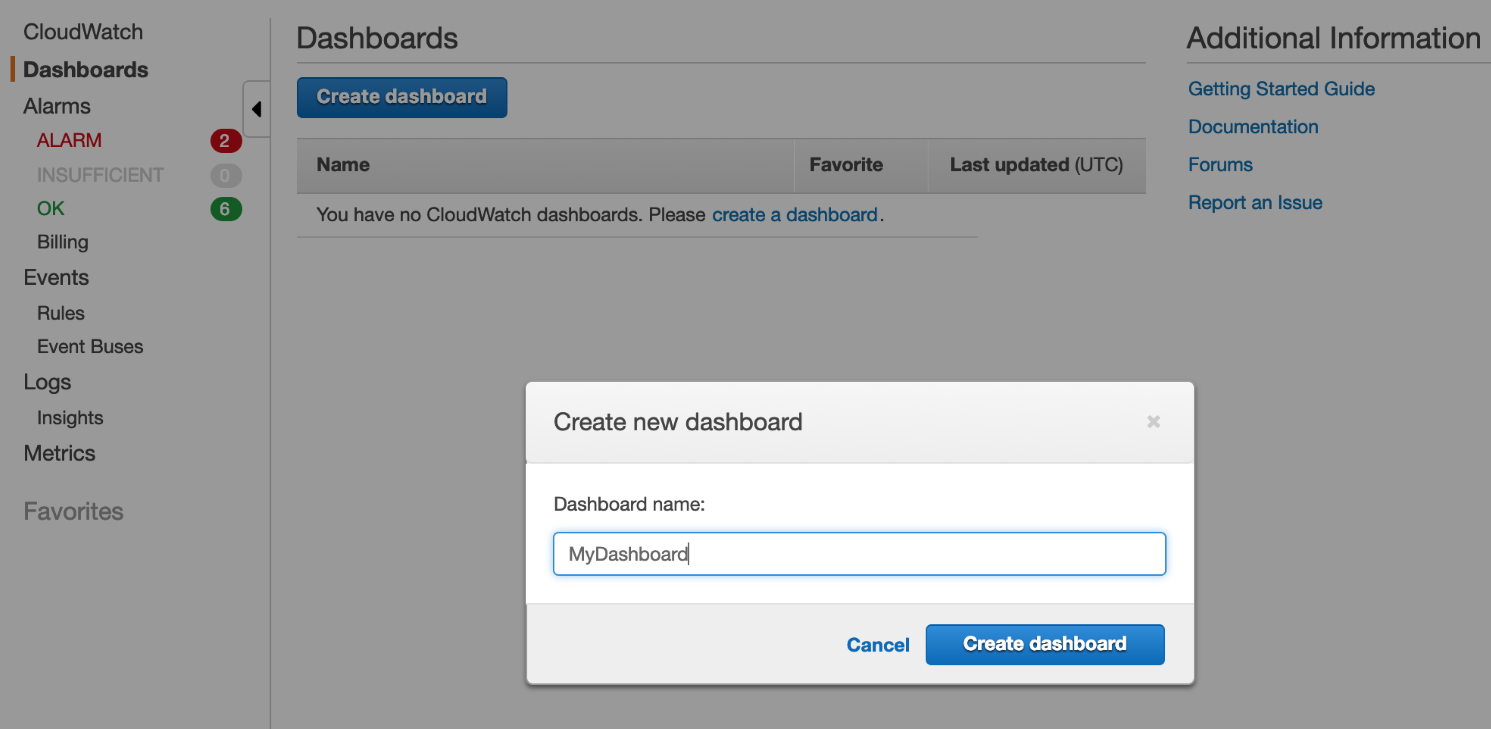
Creating a dashboard
- Choose the type of widget that you want to use to display your metric. In this example, we will choose the most versatile, Line. Navigate to the All metrics tab to find the metric(s) you want to include, selecting it by clicking the tick box on the left of the metric details. You will see a preview of the metric(s) if there is any data to display:

Add metric graph screen
- Once selected, you can modify how the metric is displayed via the settings on the Graphed metrics tab. In this case, we have given the widget a name and changed the Period setting for our metric to 1 Minute to reflect the additional granularity that is available:

Edit graph screen
- Once you click Create widget, you will see your widget on the dashboard. Once you click Save dashboard, it will appear under the Dashboards heading on the left-hand menu:

Save dashboard screen
- At the dashboard level, you can turn on Auto refresh and the Refresh interval. You can resize and rearrange your widgets by dragging them. Just remember to click Save dashboard to persist any changes. As you can see here, I have added widgets for DiskReadBytes and CPUCreditBalance to my dashboard:

Adding widgets