
This chapter provides an overview of the report design process and environment. The chapter also includes step-by-step procedures for building your first report.
A BIRT report is a structured document that displays data from an external information system, such as a database or application. Data in the report is organized and formatted so that it is meaningful and useful to the person who reads the report. A BIRT report is not a document that you type, like an essay or research paper, although you could use BIRT Report Designer to create such documents.
Using BIRT Report Designer, you can create operational reports, such as a bill of materials, a purchase order, or an invoice. You can also create reports that provide real-time information about business performance, such as the number of calls handled by your customer service organization, the number of problems handled, categorized by levels of complexity, and the number of repeat calls made by the same customer. You can use BIRT to create client-facing reports, such as account statements and transaction details. Any time that you need to gather, analyze, summarize, and present data from an information system, a report is the solution.
Designing a report involves the following tasks. You do not have to perform all the tasks in the order in which they are presented here, but if you are new to BIRT Report Designer or learning how to design reports, you can use this task list as a starting point.
Plan the report.
Start a new report design.
Specify the data to use.
Lay out the report.
Format the report.
Design a master page.
Preview and test the report.
For those who do not have report development expertise, it is important to understand that the process of creating a report is iterative rather than linear. You typically perform each task multiple times and in different orders. You might specify the data to use, lay out data, preview the report, then modify the data set, change the layout, preview the report again, and so on, until you are satisfied with the report’s contents and appearance.
Before you create a report, you should identify the information that you want the report to provide and decide how to present that information. It is important to think through these details, then draw a mock-up on paper, which you use to get feedback from your report users. Most people cannot visualize what a report could be without a paper and pencil sketch. Planning saves time in the long run, because you do not waste time creating a polished report that contains the wrong information or layout. More frequently, you discover in this review process that the customer wants much more and can now articulate those requirements more successfully.
If you are using BIRT Report Designer, start Eclipse, and create a new project, if you have not already done so. Eclipse requires that all files are organized in a project. No project is required if you are using BIRT Rich Client Platform (RCP) Report Designer. After you create the project, create a new report using one of the following techniques:
Start with a report template.
Start with a blank report.
A report can access data from a wide variety of sources, including databases, text files, and XML documents. To set up the report to access data, complete the following tasks in this order:
There are many ways to present information in a report. Different users have different expectations about how to visualize the data, and different types of layouts work better for different types of data. A report can display information in a tabular list, a series of paragraphs, a pie chart, a bar chart, a hierarchical list, or a series of subreports. These different layouts can be combined and customized. Laying out a report entails placing data on the page and organizing it in a way that helps the report user to grasp and analyze the information.
After you lay out data in a report, you format the report to give it a professional and polished appearance. Typical formatting tasks include highlighting certain data, applying styles to data, adjusting the spacing between rows of data, and conditionally hiding sections. You can also apply conditional formatting to data. One basic example is to display numbers in different colors depending on their values. Highlighting data makes the report more accessible to users. Key information stands out in the report, and users can absorb the information in layers.
When you create a new report, BIRT Report Designer uses a default master page. The master page specifies default values for page size, orientation, and margins. It also defines a default page header and footer, where you can display page numbers or the date. You can modify the master page to design a custom page layout.
You should preview and test the report as you design it. The most important item to test is your data set. Verify that the data that is retrieved from the data source is what you expect before you start laying out the report. As you lay out and format the report, check the report output throughout the design process. If you add code, test and debug it as you go.
BIRT Report Designer provides a flexible environment that meets the needs of both beginning report developers and experienced report developers who want the power of programming. It provides:
This section introduces the report design environment. If you are using BIRT Report Designer for the first time, reviewing the topics in this section can help you learn how to use BIRT Report Designer more effectively.
Procedures in this book apply to both BIRT Report Designer and BIRT RCP Report Designer unless the instructions explicitly state which platform to use. Both platforms provide the same reporting functionality. BIRT Report Designer appears within the Eclipse Workbench and therefore requires the installation of Eclipse. BIRT RCP Report Designer does not require all the Eclipse-specific tools because it is designed for report developers who want only the reporting functionality.
The steps you take to start BIRT Report Designer depend on whether you are using BIRT Report Designer or BIRT RCP Report Designer. To start the designer, follow the instructions that are appropriate to the designer that you use.
How to start BIRT Report Designer on the Eclipse platform
Start Eclipse by navigating to the Eclipse directory and performing one of the following tasks:
If you are using a Microsoft Windows system, run eclipse.exe.
If you are using a UNIX or Linux system, run eclipse.
On Workspace Launcher, shown in Figure 4-1, specify a workspace in which to store your report projects:
From the main menu of Eclipse Workbench, choose Window→Open Perspective→Report Design to start BIRT Report Designer. The application window displays the Report Design perspective, as shown in Figure 4-2.
The Report Design perspective shows all the tools, which Eclipse calls views, for creating and managing reports. A perspective is an Eclipse mechanism for organizing the initial set and layout of views in the application window.
If you are new to the Eclipse environment, read the Eclipse online documentation at http://www.eclipse.org/documentation/main.html for information about perspectives, views, and other Eclipse user interface topics.
How to start BIRT RCP Report Designer
Start the Report Designer by navigating to the BIRT RCP Report Designer directory then running BIRT.exe.
BIRT RCP Report Designer appears, as shown in Figure 4-3. As the figure shows, this application is similar to BIRT Report Designer. BIRT RCP Report Designer, however, does not show the Navigator view and does not include menu items that provide access to Eclipse-specific tools.
The BIRT Report Designer views provide tools that you use to build and customize a BIRT report design, preview the report, and debug the report. Figure 4-4 shows the BIRT Report Designer views.
Each view is a window you can close, resize, minimize, or maximize. You can also move each view to a different location, either inside or outside the application window. Change or rearrange the set of views to fit the way you work or the available screen space.
If you are using BIRT Report Designer, you can save each application window configuration as a named perspective. Then, as you work with different reports, you can choose a perspective from the list of saved perspectives. This technique is useful if the reports that you create require different sets of views or a different application window layout. For example, if some reports require access to the Library Explorer, but some do not, you can set up and save two perspectives, one with Library Explorer open, another with it closed. Similarly, if you create some reports in landscape orientation and some in portrait, you can save different perspectives with the report editor set to different sizes. Read the Eclipse online documentation for more information about working with perspectives.
This window is where you design and preview your report. You can open multiple reports in the report editor. The report editor has five pages, which you access by choosing the tabs at the bottom of the report editor. The pages are:
Layout editor, where you create and edit your report design. Figure 4-4 shows the layout editor.
Master Page, which shows the master page layout.
Script editor, where you add JavaScript code to your report. You can create many reports without programming. Typically, you write code only if you want to change the way in which BIRT generates a report.
XML Source, which shows the XML content that BIRT Report Designer generates when you create a report.
Previewer, which runs your report and displays the output.
The palette shows all the elements that you can use in a report to organize and display data. To lay out a report, you can drag elements from the palette and drop them in the report page in the layout editor.
Data Explorer shows the data sources, data sets, and report parameters that your report uses. You use Data Explorer to create, edit, or delete these items. You can also use Data Explorer to add data set fields to your report.
Library Explorer shows the libraries that the report uses. A library is a shared resource that contains report elements that can be used by more than one report. Use Library Explorer to insert report elements from a library in a report.
Property Editor displays the properties of the report element currently selected in the layout editor. It organizes properties by functional categories. Use it to apply style or format settings to the contents of your report.
Navigator shows all your projects and the reports within each project. Use it to manage your report files. Each project is a directory in the file system. Using Navigator, you can open files, delete files, rename files, or move files from one project to another. If you add files to a project directory through the file system, for example, through Windows Explorer, you need to refresh the project in Navigator to update the list of reports.
BIRT RCP Report Designer does not organize report files in projects. Therefore, it does not include a Navigator view.
Outline shows the structure of your report as a tree view. It shows the hierarchy of elements in a format that is similar to the outline view of a Microsoft Word or PowerPoint document. You expand or collapse parts of the report by choosing the plus (+) or minus (–) signs. Outline also shows all the resources that are used by or defined in a report, including data sources, data sets, libraries, and styles. You can select items in Outline to edit, delete, rename, or copy them.
BIRT Report Designer uses a simple document model. When you create and save a report design, BIRT Report Designer creates just one file with the .rptdesign file-name extension. This file contains all the information that is necessary for generating a report.
Unlike many report design tools that generate files in proprietary formats, BIRT design files are written in XML. XML is a widely used markup language specification that was designed especially for web documents. Because BIRT uses XML to define the structure and contents of a report design, developers can leverage their knowledge of XML to get a deeper understanding of how BIRT constructs a report design. BIRT’s suite of report-specific XML elements and properties is called Report Object Model (ROM).
You open a report design (.rptdesign) file with the report editor, which, by default, displays the report design in the layout editor. The layout editor provides a graphical view of the report design. If you wish, you can view the report design in the XML editor. This editor displays the XML that BIRT Report Designer generates when you create a report.
View the report design in the XML editor to see its XML code or to locate, by line number, an error that was reported in the Problems view. To understand the XML code, you can consult the ROM specification at http://www.eclipse.org/birt/phoenix/ref/.
How to open a report design
If using BIRT Report Designer, use one of the following methods:
In Navigator, double-click the .rptdesign file.
Choose File→Open File, then select the .rptdesign file from the file system.
If someone sends you a .rptdesign file, first save the file in a project folder, then, in Navigator, right-click the project, and choose Refresh. This action updates the project folder to include the file, which you then open using one of these two methods.
If using BIRT RCP Report Designer, Choose File→Open File, then select the .rptdesign file from the file system.
Eclipse saves your environment settings when you exit. If you keep a file open when you exit Eclipse, this file opens automatically when you next start Eclipse.
How to view a report design in the XML editor
Open the report design file, using one of the procedures that is described in the previous section.
The layout editor displays the graphical view of the report, as shown in Figure 4-5.
Choose the XML Source tab at the bottom of the report editor.
The XML editor displays the XML that defines the report design, as shown in Figure 4-6.
You can generate reports in two formats: HTML and PDF. The HTML report appears on a single page or on multiple pages, depending on how you specify pagination. The PDF report appears on multiple pages of the size that you specify and is suitable for printing.
As you work on the design of a report, you typically want to see the report as it would appear to the report user. With BIRT, you can easily preview a report in HTML or PDF format. You can also view the report in the BIRT report viewer. The report viewer, shown in Figure 4-7, is an interactive viewer that provides report users with the capability to jump to specific pages or to specific sections of a report, to run a report to get the latest data, and to export report data to a comma-separated values (CSV) file.
The following list describes the ways to preview a report:
To preview a report in the interactive report viewer, choose File→View Report in Web Viewer.
To preview a report in BIRT Report Designer, choose the Preview tab at the bottom of the layout editor. The previewer displays the report in HTML format.
To preview a report in HTML format in a separate window, choose File→View Report as HTML.
To preview a report in PDF format, choose File→View Report as PDF.
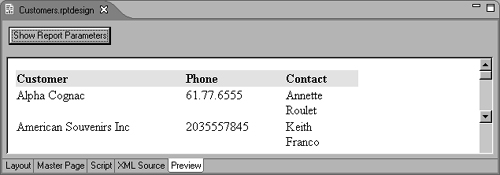
This section provides step-by-step instructions for building a report that lists customer names, phone numbers, and contact names. The report uses data from the sample database that is supplied with BIRT Report Designer, Classic Models. Figure 4-8 shows a portion of the finished report.
In this tutorial, you perform the following tasks:
Create a new project. If you are using BIRT RCP Report Designer, you do not complete this step.
Create a new report.
Build a data source.
Build a data set.
Lay out the report to display each row of the data set.
Sort the data.
Format the report to enhance its appearance.
Create a report title.
Eclipse organizes files by projects. You can create one project to organize all your reports or create multiple projects to organize your reports by categories. For each project that you create, Eclipse creates a directory in your file system.
If you are using BIRT RCP Report Designer, this task does not apply to you.
Choose File→New→Project. New Project, which appears in Figure 4-9, displays the types of projects that you can create.
Expand Business Intelligence and Reporting Tools, select Report Project, then choose Next.
On New Report Project, in Project name, type the following text, as shown in Figure 4-10:
My Reports
To add the project, choose Finish. You can now see the project in the Navigator view, as shown in Figure 4-11.
You can create a report in the following ways:
Start with a blank report design.
Use a predefined report template.
For each template, BIRT Report Designer provides a cheat sheet, which contains step-by-step instructions, to help you create the report.
For this tutorial, you start with a blank report design.
Choose File→New→Report. New Report appears. Figure 4-12 shows the window that appears in BIRT Report Designer. New Report is slightly different in BIRT RCP Report Designer.
In BIRT Report Designer, under Enter or select the parent folder, select the project that you created. This step applies only to BIRT Report Designer users.
Type the following text as the file name:
Customers.rptdesign
Choose Next. New Report provides options for starting with a blank report and several report templates, as shown in Figure 4-13.
Select Blank Report, then choose Finish. Your new report appears in the main window. This window displays the layout editor, as shown in Figure 4-14. The layout editor shows an empty report page.
The remainder of this tutorial provides the detailed steps for creating the customer report.
Before you begin designing your report in the layout editor, you build a BIRT data source to connect your report to a database or other types of data sources. When you build a data source, you specify the driver class, data source name, and other connection information that is specific to the type of data source. For this tutorial, you use the sample database, Classic Models, that is already configured for use with BIRT Report Designer. You do not need to specify the connection information for this sample database.
Choose Data Explorer. If you use the default report design perspective, Data Explorer is on the left of the layout editor, next to Palette, as shown in Figure 4-15. If it is not open, choose Window→Show View→Data Explorer.
Right-click Data Sources, then choose New Data Source from the context menu. New Data Source displays the types of data sources you can create, as shown in Figure 4-16.
Select Classic Models Inc. Sample Database from the list of data source types. Use the default data source name, then choose Next. Connection information about the new data source appears.
Choose Finish. BIRT Report Designer creates a new data source that connects to the sample database. It appears within Data Sources in Data Explorer, shown in Figure 4-17.
Now, you are ready to build your data set. A data set identifies the data to retrieve from the data source. If your report connects to a JDBC data source, you use a SQL SELECT statement to identify the data to retrieve.
In Data Explorer, right-click Data Sets, and choose New Data Set from the context menu.
On New Data Set, in Data Set Name, type the following text, as shown in Figure 4-18:
Customers
Use the default values for the other fields:
Data Source shows the name of the data source that you created earlier.
Data Set Type indicates that the data set uses a SQL SELECT query.
Choose Next.
Query displays the information to help you create a SQL query. Available Items lists all the tables in the Classic Models database. You can click the plus (+) sign next to a table to display the columns in the table. The text area on the right side of Edit Data Set shows the required keywords of a SQL SELECT statement:
   select
   from
In the text area, type the following SQL SELECT statement to specify the data to retrieve:
   select customerName,
   contactLastName,
   contactFirstName,
   phone
   from Customers
Although the data set editor shows table and column names in uppercase letters, you can type these names how you prefer, because SQL is not case-sensitive. If you do not want to type the query, you can drag columns and tables from Available Items to the text area.
The SELECT statement that you created, which is shown in Figure 4-19, gets values from the CUSTOMERNAME, CONTACTLASTNAME, CONTACTFIRSTNAME, and PHONE columns in the CUSTOMERS table.
Choose Finish to save the data set. Edit Data Set displays the columns you specified in the query, and provides options for editing the data set.
Choose Preview Results to make sure the query is valid and that it returns the correct data. If you typed the SELECT statement correctly, you should see the results that are shown in Figure 4-20. These are the data rows that the query returns.
Choose OK.
In this procedure, you insert elements in the report page to display the data from the data set that you created previously. You start by inserting a table element, then you insert data elements in the table. It is important to understand the functionality that the table provides:
The table iterates through all the data rows that a data set returns.
It enables you to lay out data easily in a row and column format.
Choose Palette. The palette displays all the elements that you can place in a report.
Drag a table element from the palette, and drop it in the report in the layout editor. Insert Table prompts you to specify the number of columns and detail rows to create for the table.
Specify 3 columns and 1 detail row, then choose OK. A table with three columns and one detail row appears in the layout editor. Now, you are ready to insert data in the table.
Choose Data Explorer.
In Data Explorer, expand Data Sets, then expand Customers. The columns that you specified in the query appear below Customers.
Drag CUSTOMERNAME from Data Explorer, and drop it in the first cell in the table’s detail row, as shown in Figure 4-21. The detail row displays the main data in the report. In the finished report, the detail row repeats to display all the data rows from the data set.
BIRT Report Designer creates a named column, which is bound to the data set field. Select Data Binding, which is shown in Figure 4-22, displays this data binding. The data binding mechanism exists to give a name to the data set field. The report design element uses this name to access the field.
Choose OK to accept the default data-binding definition.
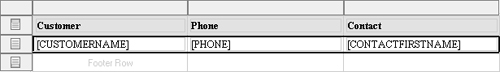
In the layout editor, the table cell in which you dropped the CUSTOMERNAME field contains a data element that displays [CUSTOMERNAME]. Above this data element is a label element that the layout editor automatically added to the header row. This label displays the field name as static text. It serves as the column heading. Figure 4-23 shows the data and label elements.
Drag PHONE from Data Explorer, and drop it in the second cell in the detail row. Choose OK to accept the default data binding.
Drag CONTACTFIRSTNAME, and drop it in the third cell in the detail row. Choose OK to accept the default data binding.
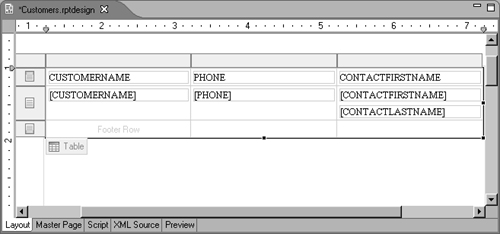
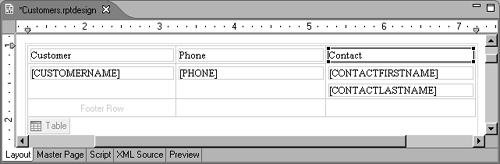
Drag CONTACTLASTNAME, and drop it in the third cell in the detail row, below CONTACTFIRSTNAME. Choose OK to accept the default data binding. The report page should look like the one shown in Figure 4-24.
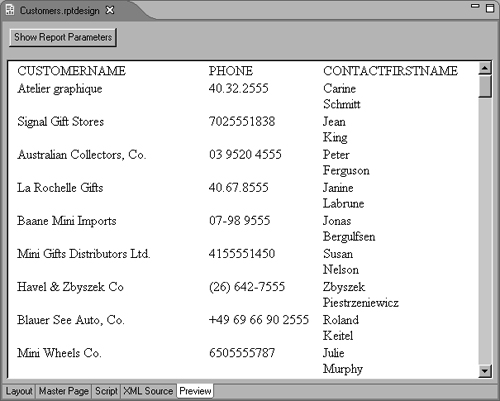
Choose Preview, the tab at the bottom of the layout editor. BIRT Report Designer generates and displays the report in HTML format, as shown in Figure 4-25. Scroll down to see the entire report. You can also preview a report in PDF. You do so by choosing File→View Report as PDF from the main menu.
As Figure 4-25 shows, the data is correct, but it appears in random order. It makes more sense to sort the data alphabetically by customer name. The report’s appearance also needs improvement.
When you first create and preview a report, the report displays the data rows in the order in which the query returns them. The order can vary, depending on many factors, such as how data was supplied in the data source. In most cases, you will want to change the order in which data appears in the report.
Choose Layout to return to the layout editor.
Open Property Editor, if necessary. If you use the default report design perspective, Property Editor appears below the layout editor. If it is not open, choose Window→Show View→Property Editor.
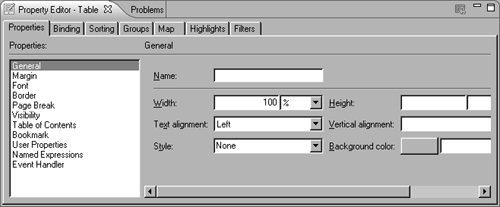
In the layout editor, select the table by selecting the Table tab in the lower left corner. This tab appears when you hover the mouse pointer over this area. Property Editor displays the properties for the table, as shown in Figure 4-26.
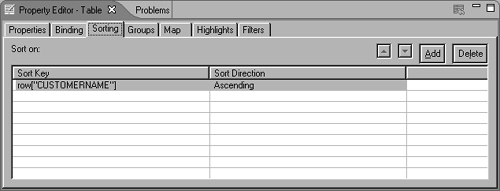
Choose the Sorting tab.
Choose Add to create a sort expression. A row appears under Sort Key.
Click in the row under Sort Key, then select the arrow button that appears, and select CUSTOMERNAME from the drop-down list.
Use the default Ascending value for Sort Direction, as shown in Figure 4-27.
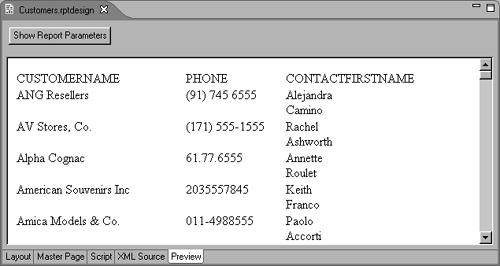
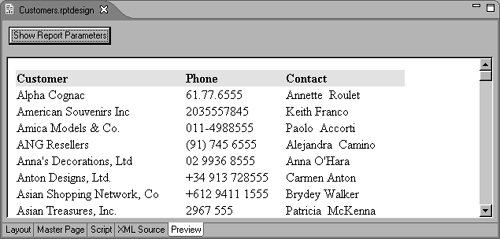
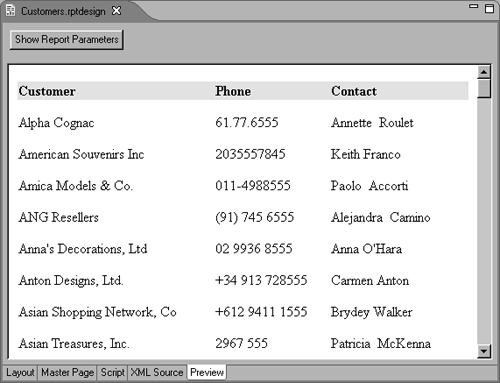
Preview the report. The sorted data appears in ascending order by customer name, as shown in Figure 4-28.
Notice that names with uppercase letters appear at the top of the list. BIRT sorts string data by UCS2 code point values. In ASCII-based character sets, uppercase letters have lower code point values than lowercase letters. Therefore, uppercase letters appear before lowercase letters.
To sort the customer names case-insensitively so that ANG Resellers appears after American Souvenirs Inc., rather than before, change the Sort Key expression in the Sorting page to the following expression:
row["CUSTOMERNAME"].toUpperCase( )
This expression uses the JavaScript toUpperCase( ) function to convert all the customer name values to uppercase before sorting. JavaScript function names are case-sensitive, so you must type toUpperCase( ) exactly as shown. References to column names are also case-sensitive. In this expression, row[“CUSTOMERNAME”] is the correct name to use. If you type row[“customername”], for example, BIRT Report Designer displays an error when you run the report. You can verify the capitalization of a column name by looking at the name that is displayed in Data Explorer.
Preview the report. The customer names appear in a different order. Names with uppercase letters do not appear at the top of the list.
Now that you verified that the report displays the correct data in the correct order, you can turn your attention to improving the report’s appearance. You perform the following tasks in this section:
Choose Layout to return to the layout editor.
Double-click the first column heading, CUSTOMERNAME. The column heading is in the first row—the header row—of the table.
To replace all the highlighted text, start typing, then press Enter when you finish. To edit the text, click once to deselect the text, then position the cursor where you want to add or delete characters.
Replace CUSTOMERNAME with the following text:
Customer
Repeat steps 2 and 3 to change the second and third column headings to the following text:
   Phone
   Contact
The report design should look like the one shown in Figure 4-29.
To format a report element, you set its properties. You can accomplish this task in two ways:
Set an element’s properties through Property Editor.
Define a style that contains the desired properties, and apply the style to an element. Use this method to define format properties once and apply them to more than one element.
In this procedure, you use the first method to set the column headings to bold, and the second method to add color to the header row.
To set the column headings to bold using Property Editor:
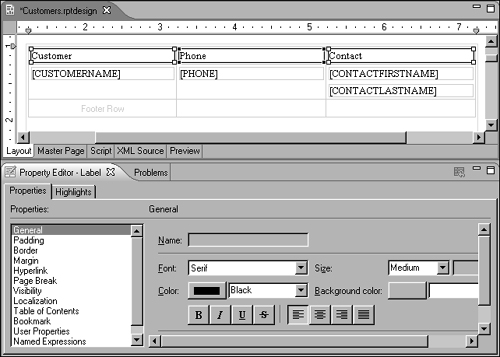
Select all the column headings. To select multiple elements, press the Shift key as you click each element. Property Editor displays the properties for the selected elements, as shown in Figure 4-30.
 Choose B to format the column headings as bold text.
To deselect the column headings, click the white space outside the table.
To add a background color to the header row, using a style:
From the main menu, choose Element→New Style.
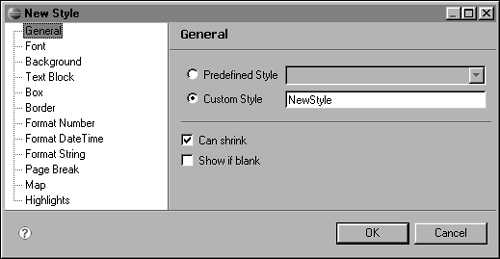
New Style appears, as shown in Figure 4-31. The left side displays the property categories. The right side displays the properties for the category that you select.
For Custom Style, specify the following name for the style:
table_header_row
Choose Background from the list of property categories. New Style displays the background properties that you can set.
Specify a color for the Background Color property, using one of the following methods:
Select the button next to the property, then select a color from the color palette that appears.
Select a color from the drop-down list.
Choose OK.
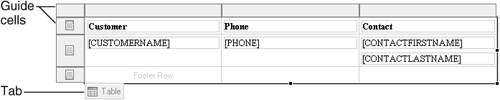
In the layout editor, select the table by selecting the Table tab in the lower left corner. This tab appears when you hover the mouse pointer over this area. Clicking the table causes guide cells to appear at the top and left side of the table, as shown in Figure 4-32.
Select the guide cell next to the header row. Property Editor displays the properties for the selected row.
Choose Properties then General to display the general properties for the row.
Apply the style that you just created by selecting table_header_row from the drop-down list next to Style. BIRT Report Designer applies the style to the header row and it appears in color.
Preview the report. The report should look like the one shown in Figure 4-33.
So far, the main improvement is that the headings are clearly visible and defined.
When you place multiple elements in a single cell, BIRT Report Designer creates block-level elements. If you are familiar with HTML, you know that each block element starts on a new line. To display multiple elements on the same line, you need to set them as inline elements. Alternatively, you can concatenate the first and last name values to display in a single data element, as described in this procedure.
Choose Layout to return to the layout editor.
Delete the data element that displays the contact’s last name.
Double-click the data element that displays the contact’s first name.
Select Data Binding displays all the data bindings used in the report. A check mark next to CONTACTFIRSTNAME indicates the data binding used by the data element you selected.
 Click in the cell that displays the dataSetRow[“CONTACTFIRSTNAME”] expression, then choose the ellipsis (...) button.
Expression Builder displays the following expression in the text area at the top of the window:
dataSetRow["CONTACTFIRSTNAME"]
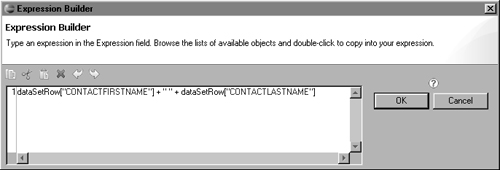
To concatenate the first and last names, type the following expression:
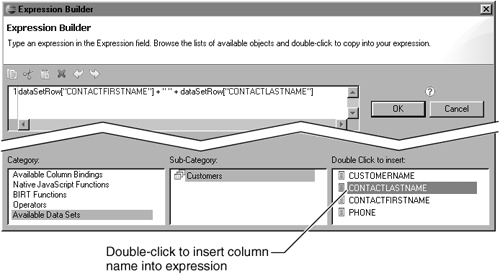
   dataSetRow["CONTACTFIRSTNAME"]+"  "+
      dataSetRow["CONTACTLASTNAME"]
Figure 4-34 shows this expression in Expression Builder. The empty quotation marks (" ") add a space between the first name and last name. You can type the expression in the text area, as shown in Figure 4-34, or double-click an item in the lower right of the window to insert it in the expression. Figure 4-35 shows a column name that you can double-click to insert into the expression.
Choose OK to close Expression Builder, then choose OK in Select Data Binding to save the modified expression.
Preview the report. The report should look like the one shown in Figure 4-36.
The default layout adds a minimum space between table rows. Typically, you will want to adjust the spacing between rows.
Choose Layout to return to the layout editor.
Select all the cells in the detail row, the middle row. To select multiple cells, use Shift-click. Be careful to select the cells, not the data elements in the cells or the whole row. A box appears around the selected cells, as shown in Figure 4-37.
Property Editor displays the properties for the cells. The title that appears in Property Editor shows the type of element that you select, so you should see Property Editor - Cell.
Choose Padding. Property Editor displays the padding properties. These properties enable you to specify the amount of space to add to the top, bottom, left, or right of the element.
Set Padding—Top to 12 points.
At this point, you might wonder why you did not just select the row to adjust the row spacing instead of selecting the individual cells in the row. BIRT Report Designer does not support row padding, because some browsers do not support this feature.
Preview the report. The report should look like the one shown in Figure 4-38. There is more space between the rows of data.
All your report needs now is a title. To display a title, you can use either a label element, a text element, or a data element:
In this procedure, you use a text element and HTML tags to format the text. Note that you are not required to use HTML to create formatted text. If, however, you are well-versed in HTML or web design, you might prefer using HTML to create a block of formatted text.
Choose Layout to return to the layout editor.
Choose Palette.
Drag the text element from the palette, and drop it above the table.
On Edit Text Item, select HTML/Dynamic Text from the drop-down list that displays Plain Text.
When you select HTML or dynamic text, you can embed HTML tags or CSS properties in the text. You can type the tags or you can insert the commonly used HTML tags that the text editor provides.
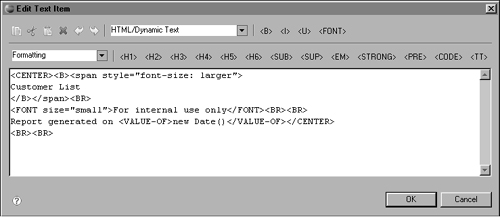
Specify the following text in the text area, shown in Figure 4-39:
   <CENTER><B><span style="font-size: larger">
   Customer List
   </B></span><BR>
   <FONT size="small">For internal use only</FONT><BR><BR>
   Report generated on <VALUE-OF>new Date()</VALUE-OF>
   </CENTER><BR><BR>
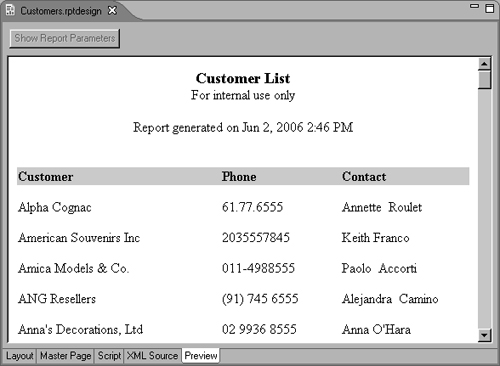
Choose OK, then preview the report. The report should look like the one shown in Figure 4-40.
As you can see, using the text element with embedded HTML enables you to
Use different formatting for each line in a multi-line text block.
Insert dynamic values, such as the current date.
Alternatively, you can use
Two label elements to display the first and second lines of static text
A data element to display the third line that contains the dynamic value
You just built your first report and worked with some of the basic tools and features of BIRT Report Designer. There are many more tasks that you can accomplish to build more sophisticated reports. Some of these tasks, described in other chapters of this book, include:
Connecting to your own data source
Creating charts
Creating report parameters for user input
Building reports that contain subreports
Formatting report elements based on conditions
Hiding reports based on conditions
Adding hyperlinks to link your report to web locations or to link one report section to another