Formatting is what you do to make a report visually appealing and effective. You format a report, for example, to highlight certain data, change the display of dates, numbers, or currency values, adjust the spacing between report elements, or display data based on a specified condition.
BIRT Report Designer provides many options for customizing the appearance of report elements that you place in a report. Using various formatting properties, you can change the alignment, color, font, size, and other properties of these report elements. You also can add background colors, draw borders around elements, and so on.
If you are familiar with CSS, you can apply your knowledge of CSS properties, because BIRT follows the CSS specification as closely as possible. Many of the formatting properties that you see in BIRT Report Designer are the same as CSS formatting properties.
The formatting options are available through the following views:
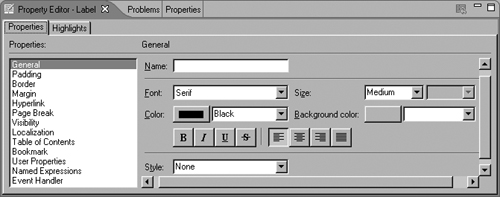
Property Editor. This view organizes commonly used properties by functional categories. The properties that appear vary depending on which report element you are formatting. Figure 11-1 shows some of the categories of properties that are available through the property editor
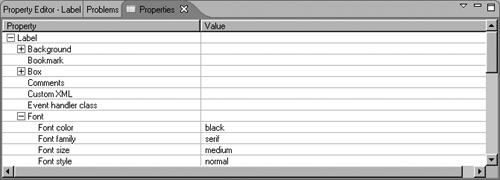
Properties. This view shows a list of the properties that you can set for an element, as shown in Figure 11-2. This view also shows more complex properties that are not available in the property editor. The default application window layout does not display the Properties view. To display it, choose Window→Show View→Properties.
You format the data in a report element by selecting the element then setting property values using the property editor or the Properties view. If you apply a format using the property editor, your format choices appear in the Properties view. Similarly, if you update a format using the Properties view, the change is reflected in the property editor.
You can customize how data appears by modifying the following settings:
Formats of numbers, text, dates, and times
BIRT Report Designer provides common format styles in which to display numbers, currency, or date values. If you do not choose a format, BIRT Report Designer displays the data as it appears in the data source. If you want to use some combination of formatting that these styles do not provide, you can create a custom format.
Font typeface, point size, and color
When choosing fonts, remember that for the report user to view the report with the fonts that you choose, the fonts must be installed on the user’s system. If your report will be distributed widely, select default fonts that are installed on all systems. You specify font attributes by setting the font properties in the General category of the property editor.
Text style as bold, italic, underline, or strike through
These settings are available under the General category of the property editor.
Text justification as left, center, right, or justified
These settings are available under the General category of the property editor.
You can apply number formats only to decimal-, float-, or integer-type data. You can, for example, display integer-type numbers with decimal values, in scientific notation, or with a currency symbol.
Number formats have no effect on numbers that are string type. For example, a Customer_ID field can be defined as string type and display number values, such as 325. Number formats have no effect on these values.
You can display numeric data using either a text element or a data element, depending on what you want to accomplish. When you drag a data set field from Data Explorer and drop it on the report page in the layout editor, BIRT Report Designer automatically creates a data element to display the values of the data set field. The procedure for formatting data differs for a text element and a data element, as described in the following sections.
You specify the format of numeric data in a data element by setting the data element’s Format Number property, as shown in Figure 11-3.
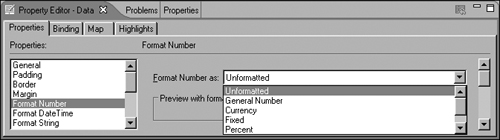
Table 11-1 lists the types of number formats that you can choose and provides examples of how the formatted data appears.
You can also define your own formats. You can, for example, specify the number of digits after the decimal or add literal characters to the numbers. To define a custom format, you use special symbols to construct a format pattern. BIRT Report Designer supports the Java numeric formatting that is defined by the DecimalFormat class. For details about the supported formatting symbols, see the Javadoc for DecimalFormat.
Table 11-2 shows examples of custom format patterns and their effects on numeric data.
When you insert dynamic data in a text element, you use the VALUE-OF tag. To format the dynamic data, include, within the VALUE-OF tag, a format attribute that specifies which format you want, as shown in the following examples. You must enclose the format value in double quotation marks (" ").
<VALUE-OF format="$#,###.00">row["orderTotal"]</VALUE-OF>
<VALUE-OF format="#.000">row["unitTotal"]</VALUE-OF>
You can use any format pattern that the Format Number property supports, as described in the preceding section.
You can display date-and-time data in different formats. You can display dates and times in short, medium, or long formats. If the report runs on a machine that supports a different locale, the date data appears in the locale-appropriate format.
You can display date-and-time data using either a text element or a data element, depending on what you want to accomplish. When you drag a data set field from Data Explorer and drop it on the report page in the layout editor, BIRT Report Designer automatically creates a data element to display the values of the data set field. The procedure for formatting data differs for a text element and a data element, and is described in the following sections.
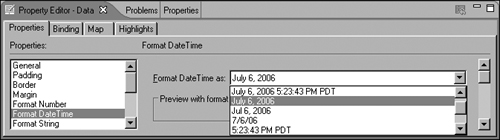
You specify the format for date-and-time data in a data element by setting the element’s Format DateTime property. As Figure 11-4 shows, BIRT Report Designer provides many common date-and-time formats from which to choose.
You can also define your own date-and-time formats. You can, for example, specify two-digit months, use two digits for the year, or add the day of the week. To define a custom format, you use special symbols to construct a format pattern. BIRT Report Designer supports the Java formatting that is defined by the SimpleDateFormat class. For details about the supported formatting symbols, see the Javadoc for SimpleDateFormat.
Table 11-3 shows examples of custom format patterns and their effects on a date that is stored as 4/15/2005 in the data source.
Specify custom formats if your report will be viewed in only one locale, because custom formats always display date or time data in the specified format. For example, if you use the format MM-dd-yy, the date January 10, 2006, always appears as 01-10-06, regardless of the locale in which the report is viewed. For locales in which dates are displayed in date-month-year format, a 01-10-06 date is interpreted as October 1, 2006.
When you insert dynamic data in a text element, you use the VALUE-OF tag. To format the dynamic data, include, within the VALUE-OF tag, a format attribute that specifies the format that you want, as shown in the following examples:
<VALUE-OF format="MM-dd-yyyy">row["orderDate"]</VALUE-OF>
<VALUE-OF format="M/d/yy hh:mm:ss">new Date()</VALUE-OF>
You can use any format pattern that the Format DateTime property supports, as described in the preceding section.
Typically, you format string data to fix inconsistent or poorly formatted data that is retrieved from the data source. The data source, for example, can store names with inconsistent capitalization or phone numbers in 1234567890 format. To fix these problems, specify the desired string format.
You can display string data using either a text element or a data element, depending on what you want to accomplish. When you drag a data set field from Data Explorer and drop it on the report page in the layout editor, BIRT Report Designer automatically creates a data element to display the values of the data set field. The procedure for formatting data differs for a text element and a data element, and is described in the following sections.
You specify a text format by setting the data element’s Format String property, as shown in Figure 11-5.

Table 11-4 lists the types of string formats that you can choose and provides examples of how the formatted data appears.
You can also define custom string formats using special symbols. Table 11-5 describes these symbols.
Table 11-5. Symbols for defining custom string formats
Symbol | Description |
|---|---|
@ | Character placeholder. Each @ character displays a character in the string. If the string has fewer characters than the number of @ symbols that appear in the format pattern, spaces appear. Placeholders are filled from right to left, unless you specify an exclamation point (!) at the beginning of the format pattern. See Table 11-6 for examples. |
& | Same as @, except that if the string has fewer characters, spaces do not appear. See Table 11-6 for examples. |
! | Specifies that placeholders are to be filled from left to right. See Table 11-6 for examples. |
> | Converts string characters to uppercase. |
< | Converts string characters to lowercase. |
Table 11-6 shows examples of custom format patterns and their effects on text data.
Table 11-6. Results of custom string format patterns
Data in the data source | Results of formatting | |
|---|---|---|
(@@@) @@@-@@@@ | 6175551007 | (617) 555-1007 |
5551007 | ( ) 555-1007 | |
(&&&) &&&-&&&& | 6175551007 | (617) 555-1007 |
5551007 | () 555-1007 | |
!(@@@) @@@-@@@@ | 6175551007 | (617) 555-1007 |
5551007 | (555) 100-7 | |
!(&&&) &&&-&&&& | 6175551007 | (617) 555-1007 |
5551007 | (555) 100-7 | |
!(@@@) @@@-@@@@ + ext 9 | 5551007 | (555) 100-7 + ext 9 |
!(&&&) &&&-&&&& + ext 9 | 5551007 | (555) 100-7 + ext 9 |
>&&&-&&&&&-&& | D1234567xy | D12-34567-XY |
<&&&-&&&&&-&& | D1234567xy | d12-34567-xy |
When you insert dynamic data in a text element, you use the VALUE-OF tag. To format the dynamic data, include, within the VALUE-OF tag, a format attribute that specifies the format that you want, as shown in the following examples:
<VALUE-OF format="(@@@) @@@-@@@@">row["phone"]</VALUE-OF>
<VALUE-OF format=">">row["custName"]</VALUE-OF>
You can use any format pattern that the Format String property supports, as described in the preceding section.
You can customize the appearance of each report element by setting its visual properties using the property editor. Depending on the number of elements that you want to format, this task can take a while, especially if you often change the appearance of elements. BIRT Report Designer solves this problem by providing a style mechanism that is similar to HTML CSS and Microsoft Word styles.
A style is a named set of formatting characteristics that you can apply to a report element to quickly change its appearance. When you apply a style, you apply an entire group of formats—font size, color, alignment, borders, and so on—in one step. For example, you want to format all the column headings in your report as Arial, small, blue, and center-aligned. Instead of formatting the column heading in four separate steps, you can achieve the same result in one step by applying a style.
Create a consistent appearance for similar report elements.
Update the appearance of a set of report elements by changing a single style.
When you first create a report, it does not contain any styles. The report displays elements with default formatting values. To use styles to format report elements, you must first create them. If you have designed web pages and you use a CSS file that defines styles, you can import those styles into your report design.
BIRT Report Designer styles are a hybrid of CSS and Microsoft Word styles. You can
Create a named style, and apply it to a report element. For example, you can create a style called ColumnHeading, then apply the style to all column headings in your report. This approach is like Microsoft styles in that you create a Body Text style then apply this style to selected paragraphs.
Apply style properties to predefined style names, or selectors. These predefined style names correspond to the different types of report elements. For example, you can apply style properties to a style called table-header, and all table headers in your report will be formatted accordingly. This technique is like CSS in that you associate styles with HTML elements, such as <H1> or <P>.
You will find it useful to create styles using both techniques. The first technique is useful for creating specialized styles for different types of text content, such as important notes, offer notices, or copyrights. The second technique provides a powerful way to define style properties once for a container element and have those properties cascade to the container’s contents. For example, if you want to apply a default format, such as the Arial typeface, to all elements in a report, you can apply the format to the predefined style name, report. After doing so, all text in the report appears in Arial.
Table 11-7 lists the predefined style names for which you can set style properties.
Table 11-7. Predefined style names
Predefined style name | Applies style properties to... |
|---|---|
chart | Charts |
grid | Grids, including elements within them. For example, if you specify a background color, the entire grid displays the specified color. If you specify a font style, all textual elements in the grid display in the specified font style. |
label | Label elements |
list | Lists, including elements in them |
list-detail | Detail area of lists, including elements in that area |
list-footer | Footer area of lists, including elements in that area |
list-header | Header area of lists, including elements in that area |
report | All elements in the report |
table | Tables, including elements in them |
table-detail | Detail rows of tables, including elements in the rows |
table-footer | Footer rows of tables, including elements in the rows |
table-header | Header rows of tables, including elements in the rows |
text | Text elements |
If you create styles using the cascading model, it is best to design a set of styles from the top-level container down. At the top level, define style properties that you want to apply to all elements, then add style properties at each successive level. For example, you can:
Use the report style to specify a default font family and font size for the entire report.
Use the table style to specify a default font size and text alignment for all data in the table.
Use the table-header style to specify bold font and a background color for table headers.
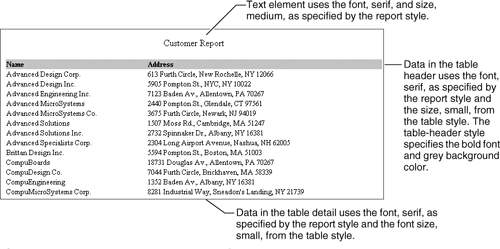
Any element that you insert in a table header inherits the style properties from the report, table, and table-header styles. Any element that you insert in a table detail inherits style properties from the report and table styles. Figure 11-6 shows the results of applying the cascading concept to styles.
Not all style properties cascade. For example, the background color, margins, borders, and padding properties do not cascade from a container to the elements within it. In these cases, cascading the style does not make good design sense. For example, it does not make sense to cascade border values, because designs typically use different border values for different elements. A design might use a border around a table without using borders around rows, columns, cells, or elements in cells.
For details about each property, including the cascading rule, see the ROM Style specification document, which is available at the following URL:
How to create a style
In the layout editor, select the report element to which you want to apply a style. If you want to create a style but not apply it to any elements, click in an empty area on the report page.
Choose Element→New Style. New Style appears, as shown in Figure 11-7. The left side displays the property categories. The right side displays the properties for the category that you select.
Specify one of the following settings:
To apply style properties to a specific type of report element, select Predefined Style, and select a style from the drop-down list.
To create a user-named style, specify a unique descriptive name for Custom Style. Ensure that the name is not the same as any of the predefined style names. If you specify a name that is the same as a predefined style, your custom style takes precedence, and you will no longer be able to use the predefined style to apply cascading styles.
Set the desired style properties by selecting a property category on the left and specifying property values.
When you finish setting style properties, choose OK to save the style. If you selected an element before you created the style, BIRT Report Designer applies the style to that element.

Most organizations maintain web sites, and most of the web pages on these sites use CSS to define their look and feel. As a report designer, you can reuse the styles from the CSS file by importing them into your reports. The benefits of doing so are obvious—you save time by not having to reinvent the styles, and your reports reflect the standard style.
You can import any number of styles from a CSS file. If you import a style whose name matches the name of an existing style in the report, BIRT Report Designer appends a number to the name of the imported style. For example, if your report contains a style named TopLevelHeading, and you import a style with the same name, the imported style’s name changes to TopLevelHeading1.
When you import styles, BIRT Report Designer copies them to your report. It does not link the CSS file to the report. Therefore, any changes that you make to the styles in the CSS file do not affect the styles in the report.
Imported styles appear in the list of available styles with all the styles that were created with BIRT Report Designer. You apply an imported style to a report element, edit the style’s properties, or delete it in the same way that you do with a style that was created with BIRT Report Designer.
BIRT Report Designer supports the CSS2 specification. Not all CSS2 properties, however, are supported. For a list of unsupported properties, see the Style and CSS specification document, which is available at the following URL:
Styles that use unsupported properties are imported. The unsupported properties, however, do not have an effect when applied to a report element.
How to import styles
Select the layout editor.
Choose Element→Import CSS Styles.
On Import CSS Styles, in File Name, specify the name of the CSS file whose styles you want to import. You can choose Browse to find the file. Import CSS Styles displays all the styles that are defined in the CSS file. Figure 11-8 shows an example of the styles in a CSS file named base.css.
Select the styles that you want to import. To import all the styles, choose Select All.
When you finish making your selections, choose Finish. BIRT Report Designer copies the styles to the report. Figure 11-9 shows an example of a list of styles in the Outline view.


After you create or import styles for your report, you can apply them to specific report elements by right-clicking the report element, choosing Style→ Apply Style, then selecting one of the styles in the list. The list displays all the styles that you created and imported. Choose None to remove the style that is currently applied to the report element.
If you applied style properties to predefined style names, such as table-header or table-footer, BIRT Report Designer automatically applies the style properties to all those types of report elements. You cannot selectively apply predefined styles to only some elements of that type.
One of the most powerful features of styles is the ease with which you can change the look of your report. If you decide to change fonts or font sizes in the entire report, all you do is modify the style that controls the font properties. To modify a style, choose Element→ Edit Style, then choose the style that you want to modify. All report elements that use that style are automatically updated to use the new formatting.
You can delete any style at any time. You should, however, delete only styles that you no longer need. If you delete a style that is applied to a report element or elements, the affected elements lose the formats that the style applied. Before you delete a style that is in use, BIRT Report Designer displays the names of the elements that are affected and prompts you to cancel or confirm the deletion.
To delete a style, choose the Outline view. Under Styles, right-click the style that you want to delete, then choose Delete.
When you format a report element, the format applies to all instances of the element in the generated report. For example, if you specify that an item price appears in the Arial typeface and blue, all item prices in the generated report appear in Arial and blue. This type of formatting is called absolute formatting. The appearance of the element is set when you design the report.
You can, however, change the format of an element according to its value or the value of another element. For example, you can specify that item prices appear in green if the value exceeds $1,000.00 and in a default color if the value is equal to or less than $1,000.00. This type of formatting is called conditional formatting. With conditional formatting, the appearance of the element is set when the report runs.
The following examples are some common uses of conditional formatting:
Show numbers in a different color if they are negative.
Highlight delinquent accounts by using a different typeface or font style.
Highlight the top ten customers by displaying their names in a colored box.
BIRT Report Designer provides an easy way to apply conditional formatting to report elements. You use the Highlights page of the property editor, where you create a formatting rule that defines when and how to change the appearance of an element. When you create a formatting rule, you specify the following information:
The condition to meet in order to apply a format, for example, row["OrderTotal"] Greater than 50000
The format to apply, for example, font color = blue
Figure 11-10 shows an example of a formatting rule.

How to create a formatting rule
In the layout editor, select the report element that you want to conditionally format.
Choose the Highlights tab in the property editor. The Highlights page appears, as shown in Figure 11-11. It is empty if you have not yet specified any formatting rules for the selected element.
Choose Add to add a new formatting rule.
On New Highlight, create the rule for applying a particular format to the report element by completing the following steps:
Think of the rule in plain English first. For example:
     If the order total is greater than $50,000.00, then set
     the font color to blue and the font style to bold.
There are two parts to the rule: If and Then.
The New Highlight dialog helps you specify the If and Then parts of the rule by breaking them down to more specific parts.
Specify the If part of the rule by completing the following steps:
In the first field, specify the first part of the If expression. Using the example rule, this part is order total:
If the order total values come directly from the selected element, from the drop-down list, choose Value of this data item.
If the order total values come from another data element, specify the expression that refers to the relevant column binding, which refers to the data set value or calculated value you want. The following expression is an example:
row["OrderTotal"]
 If you want help constructing the expression, use Expression Builder by choosing the ellipsis (...) button.
In the second field, specify the second part of the If expression by selecting an option from the list. Using our example rule, this part is Greater than.
In the third field, specify the third part of the If expression. Using our example rule, this part is a value of 50000, as shown in Figure 11-12.
You have now completed the If part of the rule, which specifies:
If row["OrderTotal"] is greater than 50000
Specify the Then part of your rule, which is “then set the font color to blue and the font style to bold,” by completing the following steps:
 Choose Color, then select a color from the color picker.
Choose B to select the Bold format, as shown in Figure 11-13 .
Choose OK.
The formatting rule that you created appears in Highlight List, as shown in Figure 11-14. The rule takes effect the next time that you run the report.
Preview the report to test your formatting rule.


To modify a formatting rule, you use the same highlight tool that you use to create the rule. Select the element for which you want to modify the formatting rule, choose the Highlights tab in the property editor, then double-click the rule to modify. You can change any part of the rule, such as the condition that triggers the formatting or the format properties to apply. The modified rule takes effect the next time that you run the report.
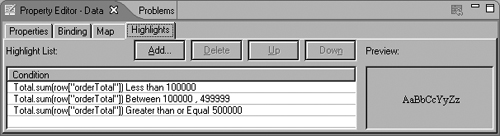
You can create multiple formatting rules for an element. You can, for example, create three rules to set the values of an order total data element to one of three colors, depending on the dollar amount. Figure 11-15 shows an example.
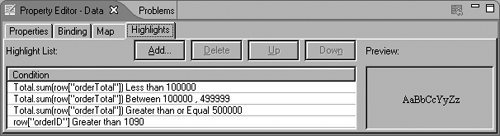
You can create any number of rules, and you can base conditions on the value of the selected element or on the value of other elements. Using the previous example, you can also change the color of the order total value based on the value of another data element, such as order ID. Figure 11-16 shows this example.
For each row of data, BIRT Report Designer evaluates the rules in the order in which they appear in the list of rules. As it evaluates each rule, BIRT Report Designer applies the specified format properties if the condition is met. If multiple rules with different conditions use the same format property, the later rule can override the format that the earlier rules specify.
Consider this example:
The first rule sets order total values to red if they are less than 100000.
The fourth rule sets order total values to blue if the order ID is larger than 1090.
If an order total value is 50000 and the order ID is 2000 (the conditions in both rules are true), the order total value appears in blue, not red, because the fourth rule supersedes all rules before it. If, however, the fourth rule sets order total values to italics rather than to blue, the value appears in red and italics.
When you create multiple rules for an element, plan the rules carefully. Consider the effect of individual rules and how the order of the rules changes the results. Test thoroughly to verify that the report displays the results that you expect. If necessary, you can change the order of the rules by selecting a rule and moving it up or down the list using the up or down arrow buttons on the Highlights page.
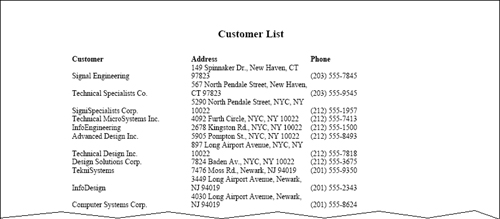
If a table displays many rows, it can be hard to read the data. A common solution is to set the rows to alternating colors, as shown in Figure 11-17.

To create this effect, use the conditional formatting feature, as described in the preceding section. The general condition that you specify is this: If the row number is even, set it to color A. If the row number is odd, set it to color B.
How to alternate row colors
Select the detail row in the table, as shown in Figure 11-18.
In General properties in the property editor, choose a color for Background Color. This color is the default color for the detail rows.
Choose the Highlights tab in the property editor to create a formatting rule to apply a different color to alternate rows. The property editor displays the Highlights page.
Choose Add to create a formatting rule.
On New Highlight, in the first field, type the following expression:
Total.runningCount() % 2
Total.runningCount( ) returns the current row number. The modulus (%) operator returns the remainder of a division. 2 specifies the number by which to divide. With this expression, even-numbered rows return 0, and odd-numbered rows return a non-zero value.
In the second field, choose either Equal or Not Equal.
Choose Equal to apply the formatting rule to even-numbered rows.
Choose Not Equal to apply the formatting rule to odd-numbered rows.
In the third field, type 0.
0 specifies the value to compare to the result of the expression, Total.runningCount( ) % 2.
You just completed the If part of the formatting rule:
If Total.runningCount() % 2 Equal (or Not Equal) 0
Specify the color to assign to the even- or odd-numbered rows by choosing a color for Background Color. Figure 11-19 shows an example of a completed format rule. The rule sets the background color of even-numbered rows to silver.
Choose OK.
Preview the report. The detail rows should appear in alternating colors.


You can use Total.runningCount( ) and the % operator with different values to alternate colors for a different number of rows. For example, the following highlight expressions change the row color for every three and every five rows, respectively:
Total.runningCount() % 6 Larger than or Equal 3
Total.runningCount() % 10 Larger than or Equal 5
Content in a table or grid aligns horizontally and vertically. When you place elements in the cells of a table or grid, BIRT Report Designer, by default, aligns content as follows:
Aligns text horizontally to the left
Aligns content vertically to the cell’s baseline
You can change the horizontal alignment of text by setting the text-alignment property to one of the following values: left, right, center, or justify. This property is equivalent to the CSS text-align property.
You can align content by applying the text-alignment property to individual data elements, to cells, to an entire row, or to the entire table or grid. To align all text in a table in the same way, set the text-alignment property at the table level. To align all text in a particular row, set the property at the row level.
Figure 11-20 shows the results of using the different property values.
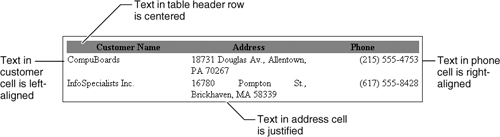
You can change the vertical alignment of content by setting the vertical-alignment property to one of the following values: baseline, subscript, superscript, top, text top, middle, bottom, or text bottom. This property is equivalent to the CSS vertical-align property.
You can align content vertically by applying the vertical-alignment property to a content element or individual cells. Some of the property values make sense only if applied to inline elements, some only if applied at the cell level. For example:
The vertical-alignment property of each table or grid cell determines its vertical position within the row, and only the baseline, top, middle, and bottom values make sense. Figure 11-21 shows the results of using a different vertical-alignment value for each grid cell.
The vertical-alignment property of inline report elements determines the vertical position of an inline element, relative to its container or to the element’s line. An inline element is one that has no line break before or after it. Two inline elements in a cell or section appear side by side on a single line. You typically use the superscript, subscript, top, and bottom values to adjust the alignment of two elements. Figure 11-22 shows the results of using a different vertical alignment value for the second element in each cell.


The default layout adds a minimum amount of space between elements in a report. After you lay out elements in your report, preview the report in HTML or PDF to see if you need to adjust the spacing between contents. Reports render differently in HTML and PDF.
For an HTML report, the contents adjust automatically to the size of the window unless you specify a specific value for the table width. In PDF, the contents of table cells appear on one or multiple lines, depending on the sizes of the columns. The entire table occupies as much space horizontally as is available unless you specify a specific value for the table width. The available, or printable, area is determined by the page size and margin sizes of the master page.
Figure 11-23 shows the default spacing for report elements in a report design. As the figure shows, a table contains columns of equal width unless you specify explicit column widths.

Figure 11-24 shows the report output in HTML. The default layout displays rows of content with very little space between them. You can resize a row to increase the space between rows and resize a column to adjust its width.

When the size of the browser window decreases, text in the table cells wraps, as shown in Figure 11-25. You can specify a fixed width for the table if you do not want the contents in the table to adjust to the browser window.

Figure 11-26 shows the same report in PDF format. The data fits in three columns of equal size, which results in white space on the right. There is also very little space between the rows and columns.
To adjust the spacing of content in a report, use one of the following techniques:
Resize the rows or columns of a table or grid to adjust spacing of content in a table or grid.
Insert an empty row or column in a table or grid, and specify a specific size for the row or column.
Resize the margins, borders, and padding of elements.
The first two techniques provide more predictable results. The padding and margin properties can yield varying results in different web browsers, depending on how the browser interprets these properties.
The quickest way to change the size of a row or column is to drag the row or column boundary to the desired height or width. You can also resize a row or column by setting a specific row height or column width. You will find that setting a specific row height or column width is often preferable to dragging a row or column boundary, because what you see in the layout editor is not what you get in the output. In the layout editor, the sizes of data, text, and label elements adjust to fit up to 20 characters of their content or expression.
The row height that you specify is the row’s minimum height. It is not a fixed height. If it were, long content would be truncated. The column width that you specify, on the other hand, is a fixed width. Long blocks of content wrap to multiple lines.
By default, table and grid rows and columns do not appear in the output if they are empty. For example, if a grid has three rows, but only one row contains content, the output does not display blank space. If, however, you specify a size for the empty rows, the rows appear.
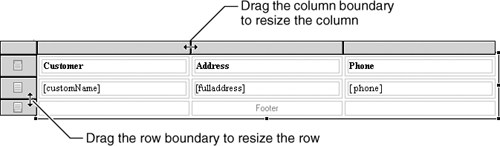
How to resize a column or row by dragging its boundary
Select the tab at the bottom left corner of the grid or table. Guide cells appear at the top and left sides of the grid or table.
In the guide cell area, select a row or column boundary, and drag it until the row or column is the size that you want, as shown in Figure 11-27.
How to specify a row height
Select the tab at the bottom left corner of the grid or table. Guide cells appear at the top and left sides of the grid or table.
Select the guide cell of the row that you want to resize. The property editor displays the row properties, as shown in Figure 11-28.
In the General category, specify a value for Height. This value sets the minimum height for the row. You can specify different units of measurements, including inches, centimeters, millimeters, and points.

How to specify a column width
Select the tab on the bottom left corner of the grid or table. Guide cells appear at the top and left sides of the grid or table.
Select the guide cell of the column that you want to resize. The property editor displays the column properties that you can set.
In the General category, specify a value for Width. This value sets a fixed width for the column. You can specify different units of measurements, including inches, centimeters, millimeters, and a percentage of the total grid width.
As in CSS, BIRT Report Designer provides three properties to define the horizontal and vertical space between elements:
Border is a visible or invisible line around the element.
Padding is the space between the content of an element and the border.
Margin is the space between the border and other elements.
Figure 11-29 shows how margins, borders, and padding work together.

You can use the padding and margin properties of an element to adjust the horizontal and vertical spacing of content in a report. Figure 11-30 shows how to set a label element’s Padding Bottom property to increase the space between the report title and the table below it.
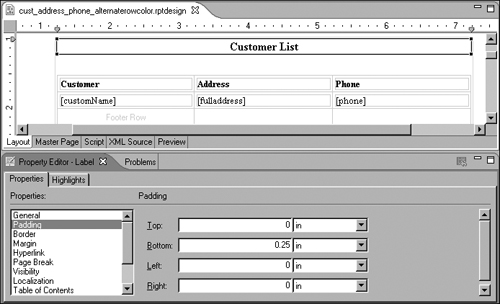
Figure 11-31 shows the report output. You can get the same result by increasing the table’s Margin Top property.
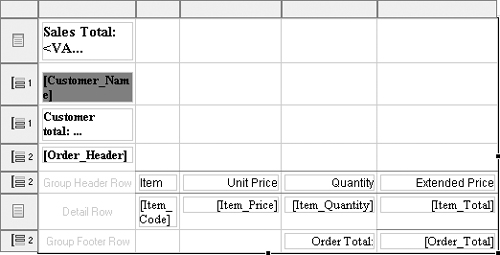
Grid and table columns enable you to align report elements easily and neatly. Often, however, you need to display text or data across multiple columns to enhance the report’s appearance. For example, compare the layout of the reports in Figure 11-32.
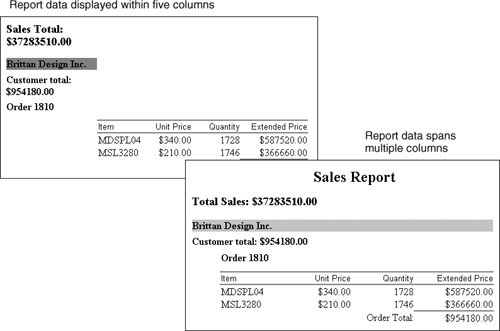
In the first report, data appears in a five-column table. The first column of the table contains the sales total, customer name, customer total, and order number. The order details occupy the rest of the columns. To fit five columns, each column is fairly narrow. Some of the content in the first column wraps onto two lines. If you increase the width of the first column, the second column moves too far to the right. Figure 11-33 shows the design for the first report.
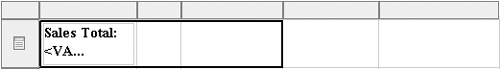
In the second report, the sales total, customer name, and customer total spans multiple columns, so that the text appears on one line. The second column starts farther to the left, eliminating extra space on the left of the detailed content.
Figure 11-34 shows the design for the second report.

To display table or grid content across multiple columns, you merge the cells.
How to merge table or grid cells
Select the cells that you want to merge by using Shift-click. A border appears around the cells that you select, as shown in Figure 11-35.
Right-click within the border, then choose Merge from the context menu. The cells merge into one, as shown in Figure 11-36.
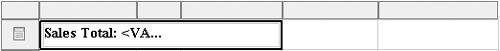
Data in a data source can sometimes be cryptic or appear in abbreviated form. For example, gender values may be M or F rather than male or female. Credit rankings may be 1 to 5 rather than excellent, good, average, fair, or poor.
BIRT Report Designer enables you to specify alternate values to display if you do not want to use the original values in your report. You use a data element’s map property to create rules for mapping data values. You create one map rule for each data value that you want to replace. For example, to map M and F to Male and Female, respectively, you create two map rules.
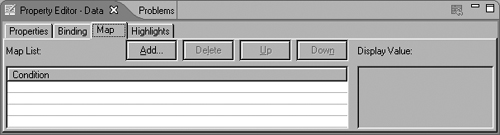
How to map data values to different display values
Select the data element for which you want to replace values. The property editor displays the properties for the data element.
Choose the Map tab at the bottom of the property editor. Map List appears, as shown in Figure 11-37.
Choose Add to create a map rule.
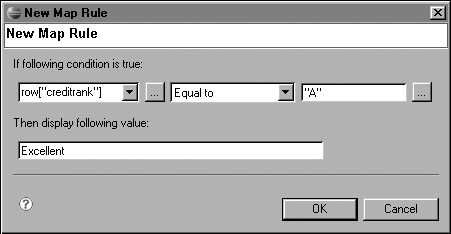
On New Map Rule, in the first field, specify the expression that refers to the data set field for which you want to replace values. If you need help specifying the expression, choose the ellipsis (...) button to use Expression Builder. The following is an example of an expression:
row["creditrank"]
In the second field, select an operator from the list. For example:
Equal
In the third field, specify the value to replace. For example:
"A"
You must enclose string values in quotation marks (" ").
In the last field, specify the value that you want to display. For example:
Excellent
Figure 11-38 shows an example of a completed map rule.
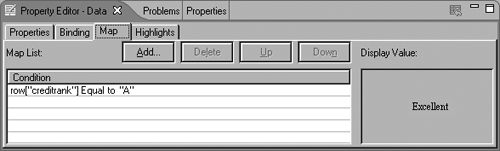
Choose OK. The rule that you created appears in Map List. When you select the rule, the display value appears in the box at the right, as shown in Figure 11-39.
Repeat steps 3 through 4 to create additional rules, one for each data value that you want to replace. Figure 11-40 shows an example of three map rules that were created for the selected data element.
Preview the report to check the results of your map rules.

In most cases, you add an element to a report because you want to display the contents of the element. There are many good reasons, however, for hiding report elements conditionally. With creative use of an element’s visibility property, you can customize the data that your report displays, depending on conditions that you specify. You specify a condition by writing a Boolean expression that evaluates to either true or false. The following are some examples of conditionally hiding an element, and the corresponding Boolean expressions to apply to the visibility property:
Display a text message only for certain records. You want your report to display a message when an account balance falls below a certain amount, such as $1,000.00. First, create a text element that displays something like “Your account balance is below the minimum balance required to waive the service fee.” Then, you conditionally hide the text element by setting its visibility property to the following expression:
row["accountbalance"] > 1000
When the expression returns true, the text element is hidden. Notice that you have to think the opposite when specifying the expression. You have to think about when you do not want the text to appear, rather than when you do. In this example, you want to display a message when the balance is less than $1,000.00. Therefore, you hide the text element when the balance is greater than $1,000.00.
Display a text message if a report returns no data. If your report uses parameters to prompt users to specify the data that they want to view, and it is possible for the report to return nothing, you can display a message, such as “No records found.” To accomplish this task, you create a text or label element that displays the message, then you conditionally hide the element by setting its visibility property to the following expression:
Total.count( ) != 0
Total.count( ) returns the number of data rows in a table. When Total.count( ) returns zero, the message appears. Because this function is an aggregate function that processes all data rows in a table, you must place the text or label element in the header or footer row of the table.
Display different pictures, depending on the values of a field. To add visual interest to your report, you want to display two stars next to an order total that equals or exceeds $10,000.00, one star for totals between $5,000.00 and $10,000.00, and nothing for totals less than $5,000.00. Create two pictures— one with two stars and the other with one star—and insert them next to the element that displays the order number. Conditionally hide the two-star picture with the following expression:
row["ordertotal"] <= 10000
This expression hides the two-star picture when the order total is less than $10,000.00.
Conditionally hide the one-star picture with the following expression:
row["ordertotal"] < 5000 || row["ordertotal"] > 10000
This expression hides the one-star picture if the order total is less than $5,000.00 or more than $10,000.00.
Display different report sections, depending on the values of a field. For example, you want to display W2 information for full-time employees and 1099 information for contractors. Create two report sections, one with W2 information and another with 1099 information. Conditionally hide the report with W2 information using the following expression:
row["classification"] == "contractor"
This expression hides the full-time employee W2 information when the employee is classified as a contractor. Conditionally hide the report with 1099 information using the following expression:
row["classification"] == "fulltime"
This expression hides the contractor 1099 information when the employee is classified as full-time.
The visibility property also provides you with the option of:
Hiding an element, depending on the output format. For example, you can hide an element for HTML output and display it for PDF output.
Specifying different visibility conditions for PDF and HTML output. For example, you can hide an element in HTML if its value is x and hide an element in PDF if its value is y.
How to conditionally hide an element
Select the element to hide conditionally.
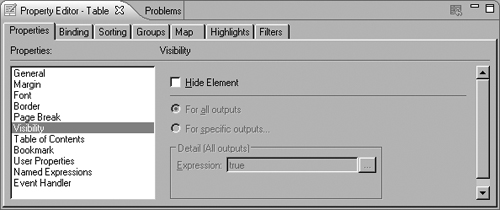
In Property Editor, choose Visibility. The Hide Element option appears, as shown in Figure 11-41.
Select Hide Element to specify that this element be hidden. If you want the element to always be hidden, this is all you need to do. If you want to conditionally hide the element, specify the condition.
Select the report format to which you want to apply the hide condition:
To apply the hide condition for all report formats, select For all outputs.
To apply the hide condition for certain report formats, select For specific outputs. Also select this option if you want to apply different conditions, depending on the report format.
Specify the hide condition:
 Choose Expression Builder.
On Expression Builder, create an expression that specifies the hide condition. Remember, you have to think about when you want to hide the element, not when you want it to appear.
For example, to display the text message, Jumbo, when a loan amount exceeds $363,000.00, conditionally hide the text element using the following expression:
row["ordertotal"] < 363000
This expression hides the text message when loan amounts are less than $363,000.00.
Choose OK.
Preview your report to test the conditional visibility.