
You can present information in a report in many ways. You can display information in a tabular list, a nested list, a chart, a series of text blocks, or a series of subreports. More complex report layouts can use a variety of these different presentations in a single report. Laying out a report entails placing data on the page and organizing the information in a way that helps a user to read and understand the information in the report.
Because there are infinite ways to lay out a report, it helps to work from a paper design. If you try to design and create the report layout at the same time, you can lose track of the data that you want to place in the report, or you can finish laying out one part of the report before you realize that you can better present the data using another layout.
Before you begin to lay out your report, verify in Data Explorer that your data set or data sets return the data that you want to use in your report. In many cases, the layout of a report is driven by the data.
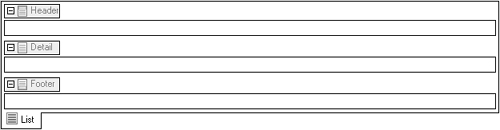
Like most documents, reports tend to be very structured. A report typically consists of distinct sections or a series of content blocks, as shown in Figure 9-1. BIRT Report Designer provides an intuitive way to lay out a report. A visual layout editor displays a page to which you add content, such as data fields, charts, pictures, or text blocks, in each section of the report.
A section can consist of one or multiple elements. The first section of a report, for example, is typically the report title. This section might contain just one text element. Another section, which displays a list of customer records, might contain four data fields and four column headings. More complex sections can contain multiple subsections to display items such as multiple lists that appear side by side or a combination of lists, charts, and text blocks. A key concept to understand about sections is that each section is a horizontal block of content.
You lay out the contents of each section of a report in the same way that you read a report—you start from the top of the report and go from left to right until the end of the report. By dividing a report into sections, you can manipulate each section independently. For example:
Use a different set of data for each section.
Size and format each section independently.
Specify page breaks before or after each section.
Conditionally show or hide each section.
BIRT Report Designer provides a variety of elements for building a report. To lay out a report, you drag report elements from the palette and drop them on the page in the layout editor. Report elements fall into two general categories:
Elements that display information
Elements that organize multiple elements in a section
Table 9-1 provides a summary of the report elements that you can use to lay out your report. Details about using these report elements appear later in this chapter or elsewhere in this book.
Table 9-1. Report layout elements
Report element | Description |
|---|---|
Label | Displays a piece of static text. |
Text | Displays text that can contain HTML formatting and dynamic values. |
Dynamic text | Displays memo or CLOB (Character Large Object) data from a data set field. The data typically consists of large amounts of text. |
Data | Displays a computed value or a value from a data set field. |
Image | Displays any image that a web browser supports. |
Chart | Displays data from a data set in a variety of chart types, including pie charts, bar charts, and line charts. |
Grid | Organizes multiple report elements in a static table. |
Table | Organizes data from a data set in a dynamic table. |
List | Organizes data from a data set in a variety of layouts. By contrast, a table element organizes elements in a row-and-column format only. |
To lay out a report, follow these general steps:
Identify the sections in your report.
For each section, insert either:
A single report element, such as a text element
A container element to organize multiple report elements in a section
For sections that contain multiple elements, insert report elements in each container. You can insert containers within a container to create nested sections.
Preview each section as you complete it. If you wait until you finish laying out the report before you verify the output, and there are errors, it can be difficult to determine which part of the report causes the problems.
Most sections in a report contain multiple elements. BIRT Report Designer provides three types of containers for organizing elements in a section:
Grid
Table
List
The following sections describe each container element.
Use a grid to arrange static elements, such as text and pictures, in a section. The grid is similar to the HTML table in a web page. It is ideal for creating report title sections and page headers and footers, as shown in Figure 9-2 and Figure 9-3.
When you place a grid on the page, the layout editor displays a row-and-column structure, such as the one shown in Figure 9-4. By default, all the columns have the same width. All the rows have the same height.
The grid layout automates the task of aligning blocks of content. When you place report elements in the cells, the report elements are automatically aligned horizontally and vertically. If you have used other reporting tools that provide a free-form layout editor that lack this capability, you will appreciate the automatic alignment feature that the grid provides. Placing report elements and then aligning them manually is time-consuming.
Using BIRT Report Designer, you can add, delete, and resize rows and columns in the grid, as needed. Figure 9-5 shows a report title section that consists of a picture and two text elements, arranged in a grid with one row and two columns of different sizes.
You can also format individual rows, columns, and cells to customize their size, color, borders, and text alignment. Chapter 11, “Formatting Report Content,” describes these tasks.
When you insert a grid, you specify the number of rows and columns that you want to start with. Depending on the number of report elements that you place in the grid, you might need to add rows or columns later.
How to add a row or column
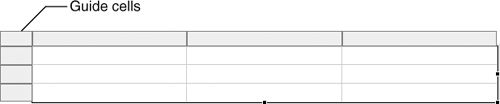
In the layout editor, hover the mouse pointer over the bottom left corner of the grid until you see the Grid tab, then choose the tab. Guide cells appear at the top and left side of the grid, as shown in Figure 9-6.
Right-click the guide cell next to where you want to add a row or column.
Choose one of the following items from the context menu to add a row or column in the desired location:
When you insert a grid, you specify the number of rows and columns that you want. If you do not place report elements in all the rows or columns, you can delete the empty rows and columns, so the grid takes less space in the layout editor. By default, empty rows and columns do not appear as blank space in the generated report. If you want an empty row or column to appear as blank space, set the row or column to a specific size.
How to delete a row or column
In the layout editor, hover the mouse pointer over the bottom left corner of the grid until you see the Grid tab, then choose the tab. Guide cells appear at the top and left side of the grid.
Right-click the guide cell of the row or column that you want to delete. If the row or column contains elements, the elements are also deleted.
Choose Delete from the context menu.
Use a table to display dynamic data in a row-and-column format. Dynamic data is data from a data source, such as a database or XML document. The data is dynamic, because the values are not fixed in the report design. Instead, when the report runs, the report connects to the data source, retrieves the specified data, and displays the current data. Figure 9-7 shows an example table that displays customer names and phone numbers from a data source.

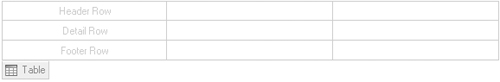
When you place a table on the page, the layout editor displays a row-and-column structure, such as the one shown in Figure 9-8.
Like the grid, the table layout automates the task of aligning report elements. Unlike the grid, the table iterates through all the data rows that a data set returns to display the dynamic list of data.
Note that a table can display data from one data set only. When you create a data set, ensure that it returns all the data that you want to display in a table. If the data that you need is stored in two database tables, write a query that joins the two tables. Alternatively, you can create two data sets and use two tables, one table for each data set.
The table contains three types of rows in which you place report elements. Table 9-2 describes the types of information that you typically place in each row.
Table 9-2. Table row descriptions
Table row | Description |
|---|---|
Header | Elements that you place in the header row appear at the beginning of the section. If the data in the table appears on multiple pages, the contents of the header display at the top of every page. You can display the header contents only once, at the beginning of the section, by turning off the table’s Repeat Header option. Place elements in the header to:
|
Detail | Elements that you place in the detail row represent the dynamic data in the section. The detail row displays each row from the data set. For example, display the main data, such as customer names, addresses, and phone numbers, in a customer list. |
Footer | Elements that you place in the footer row appear once, at the end of the section. For example, display summary information, such as totals. |
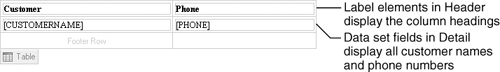
Figure 9-9 shows a table layout for displaying a list of customer names and their phone numbers. The finished report displays the list that appears in Figure 9-7.
When you place a data set field in a table, BIRT Report Designer:
Binds, or associates, the data set with the table. By binding these items, the table has the information that it needs to iterate through the data rows that the data set returns.
Creates a column binding, which binds the data set field with a named column.
Creates a data element that uses the column binding to display data from the data set field.
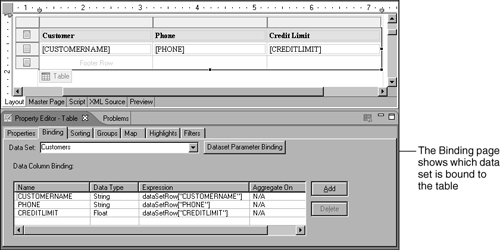
You can view this binding information on the table’s binding properties page. To do so, select the table, then choose the Binding tab at the bottom of Property Editor. Figure 9-10 shows the binding properties page.
You can also manually bind a table to a data set through this page. The easiest approach, however, is to place a data set field in the table and let BIRT Report Designer do the binding. If you are not placing data set fields in the table, but are inserting other types of elements, such as dynamic text elements or image elements that need to access data set data, then you need to manually bind the data set with the table before you insert those elements in the table.
A table can be bound to only one data set. BIRT Report Designer prevents you from inserting a field from a different data set. If you manually change the data set that is bound to a table after you place fields in the list, you need to delete the fields, because the table no longer has information about them.
If, however, you do not change the data set binding, and you delete all the fields from a table, the table maintains its binding to the data set. To insert fields from a different data set into a table, you need to change the table’s data set binding first. Deleting all the fields from the previous data set does not remove the original binding.
How to bind a data set to a table
In the layout editor, hover the mouse pointer over the bottom left corner until you see the Table tab, then choose the tab.
Choose the Binding tab at the top of Property Editor. The Data Set field shows either the name of the data set that is currently bound to the table or None if no data set is bound to the table.
From the Data Set drop-down list, select a data set. BIRT Report Designer binds the data set to the table. It also creates a column binding for each data set field. Now elements placed in the table can access all the fields in the data set.
You can add, delete, and resize rows and columns in the table, as necessary. You add and delete table rows and columns in the same way that you add and delete grid rows and columns. These tasks are described earlier in this chapter.
A table can contain any number of header, detail, and footer rows. For example, you can add two header rows, one to display summary information and the other to display column headings.
Use a list element to display dynamic data in any format other than a table. For example, use the list element to create form letters, one for each customer in a data set. Figure 9-11 shows an example PDF report that displays a series of form letters. Each letter is the same except for the recipient’s name, which is dynamically derived from a customer name field.

When you place a list on the page, the layout editor displays the structure that appears in Figure 9-12.
Like the table, the list iterates through all the data rows that a data set returns to display data. Table 9-3 describes the three areas in a list.
Table 9-3. List area descriptions
List area | Description |
|---|---|
Header | Elements that you place in Header appear once, at the beginning of the section. For example, display introductory information, such as a description of the report. |
Detail | Elements that you place in Detail display dynamic data. The amount of data that appears is determined by the number of data rows that your data set returns. For example, print a letter for each customer in the data set. |
Footer | Elements that you place in Footer appear once, at the end of the section. For example, display summary information, such as the number of records in the report. |
Figure 9-13 shows a list layout that displays a form letter for each customer. The form letter is created using a text element that contains HTML formatting. The generated report displays the form letters that appear in Figure 9-11.

Figure 9-13 shows the most basic use of the list element. Typically, you use the list element to present data in more complex layouts. For example, you need a report that consists of many subreports. Each subreport goes to a single customer and consists of a cover letter, a summary account statement, and a detailed statement. To create this type of report, you define data sets that return each customer and the required account information, use grids and tables to create each section of the subreport, and place all the sections in a list element. For an example that shows the use of a list to organize subreports, see Chapter 17, “Building a Report That Contains Subreports.”
You can place report elements in a page using one of the following techniques:
Drag an element from the palette and drop it in the page.
Use the Insert menu to place an element after a selected element. If none of the elements on the page are selected, the new element is added at the end.
Drag a data set field from Data Explorer and drop it in a table, grid, or list.
When you drag an element from the palette, two cursors appear in the layout editor. The arrow cursor tracks your mouse movement. The straight cursor, shown in Figure 9-14, moves to the left or bottom of an existing report element when you move the mouse pointer around on the page. Watch the straight cursor. It shows you where the element will be placed when you release the mouse button.
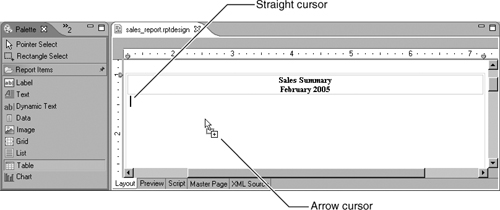
If you drop the element when the straight cursor is below an element, the new element appears on the next line, after the existing report element. Figure 9-15 shows the new element in the design.

The layout editor does not allow you to place report elements side by side directly on the page. For example, you cannot place two text elements, two tables, or a picture and a text element next to one another. The layout editor inserts the second element below the first one. To place multiple elements horizontally across the page, place them in a container element, such as a grid or table.
Most of the information in a report is derived from data set fields. The report displays this data as it is stored in the data source. For example, in a customer orders report, you place customer name, order number, item, quantity, and price fields in the report.
To insert all the fields in a data set, choose Data Explorer, expand Data Sets, then drag the data set, and drop it in the page. BIRT Report Designer creates a table and the required column bindings, and places all the fields in the detail row of the table. The fields appear in the order in which they appear in the data set.
Often, however, you do not want to insert all the fields, or you want to insert them in a particular order. To place individual data fields, first insert a container element, typically a table, in which to place the fields. Although you can place data fields in a grid or directly on the page, you typically place fields in the detail row of a table or a list. If you place a field in a grid or in the page, only one value appears in the generated report. Unlike a table or list, the grid and page do not go through all the data rows in a data set.
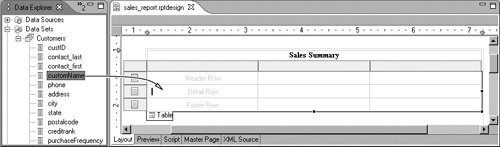
To access and insert data set fields, choose Data Explorer, expand Data Sets, then select the data set. You can then drag data set fields from Data Explorer and drop them in the container, as shown in Figure 9-16.
A computed field displays the result of an expression rather than stored data. For example, a database stores the prices of order items and the quantities that were ordered. To display the extended prices, you specify the following expression to calculate the values:
row["pricequote"] * row["quantity"]
Table 9-4 lists other examples of when to use computed fields and the types of expressions that you can specify.
Table 9-4. Examples of expressions in computed fields
Uses for computed fields | Examples of expressions |
|---|---|
Display data that concatenates values from multiple fields | The following expression displays a customer’s first and last names, which the data source stores in two fields: row["firstname"] + " " +
row["lastname"]The following expression displays a full address by concatenating values from four fields in the data source: row["address"] +", " + row["city"] +
", " + row["state"] + " " +
row["postalcode"] |
Display data that is calculated from multiple fields | The following expression calculates a customer’s available credit: row["creditlimit"] - row["balance"] |
Display data using a JavaScript or BIRT function | The following expression uses the JavaScript Date object to return the current date: new Date( ) The following expression uses the BIRT Total.Sum( ) function to return the sum of all extended prices: Total.sum(row["pricequote"] *
row["quantity"]) |
JavaScript is a case-sensitive language. You must type keywords, function names, and any other identifiers with the correct capitalization. You must, for example, type the Date( ) function as Date( ), not date( ) or DATE( ). If you need help constructing expressions with the correct syntax, choose objects, functions, and operators from the lower part of Expression Builder.For more information about writing expressions or using Expression Builder, see Chapter 14, “Writing Expressions.”
You can create a computed field using either of the following techniques:
Define the computed field in the data set.
Define the computed field in the report layout.
The first technique is preferable, because:
You can test the results of the calculation by choosing Preview Results in the data set editor.
The computed field is available to any table, list, or chart that uses the data set. It appears in the list of fields for that data set.
BIRT Report Designer processes the computed values once, rather than multiple times, if the same computed field is used in multiple places in the report.
To create a computed field in the report layout, drag a data element from the palette, and drop it in the desired location, then in Select Data Binding create a column binding that defines the expression that returns the computed values. If you insert the data element directly on the page or in a grid, and you want to write an expression that refers to a data set field, you must first bind the data element to the appropriate data set. On the hand, if you insert the data element in a table or a list, the data element has access to the data set bound to the table or list.
Images add visual appeal to reports. You can add a company logo and pictures of merchandise, and you can use icons instead of text labels. These images can originate from a file system, a web server, or a data source. Images are often used as decoration, but you can also use them as data. A product database, for example, might contain images of each item. If you create a report with product information, you can add product images to the report.
BIRT supports the following types of image files: BMP, JPG, JPEG, JPE, JFIF, GIF, PNG, TIF, TIFF, and ICO. To display an image, insert the image element in your report. You have four choices when you insert an image. You can:
Link the image from any location to the report.
Link the image from the BIRT resource folder to the report. The resource folder is a central location for external files used by reports. Rather than link in images from various locations, you may find it more convenient to store all image files in the resource folder, because packaging files for deployment will be much easier.
Embed the image in the report.
Refer to the data set field that contains the images.
Use one of the first three methods to display a specific, or static, image. Typically, you display a static image once, so you insert the image directly on the report page, in a grid cell, or in the header row of a table. Use the fourth method to display a set of images returned by a data set. In this case, you typically want to display all the images in the data set field, so you insert the image element in the detail row of a table.
When displaying a static image, you need to decide whether to link or embed the image. Visually, there is no difference between a linked image and an embedded image. The difference is how changes to the image file affect what your report displays. If you link the image, any change you make to the original image file is reflected in the report. If you embed the image, changes to the original image file have no effect on the image that appears in the report. Use the guidelines in Table 9-5 to determine whether to link or embed an image in a report.
Table 9-5. Guidelines for linking and embedding images
When to link | When to embed |
|---|---|
You expect to modify the original image, and you want the report to reflect future changes. | You expect to modify the original image, but you do not want the report to reflect future changes. |
You do not expect to move or delete the original image file. Moving or deleting the image file breaks the link. | The original image file might be moved or deleted without your knowledge. |
How to insert a linked image
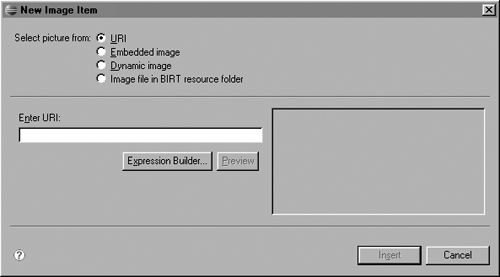
Drag the image element from the palette, and drop it in the desired location on the page. New Image Item appears, as shown in Figure 9-17.
To link to an image stored in the resource folder:
To link to an image stored in any other location:
In Select picture from, select URI.
Under Enter URI, specify the location of the image file. Enclose the URI in double quotation marks (" ").
The following expression is an example of a URL for a file in a remote location:
The following expression is an example of a URI for a file that is on the local file system:
"file:///c:/myprojects/images/companylogo.jpg"
You would specify a local file system location only for testing in the early stages of report development. A deployed report cannot access resources on a local machine.
Choose Insert to insert the image in the report. If you want to view the image before inserting it, choose Preview.
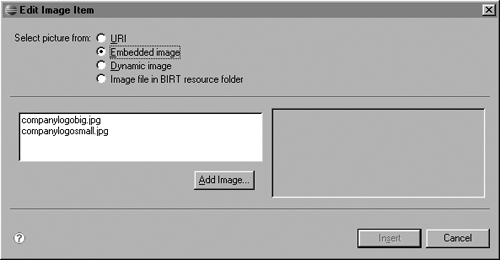
How to insert an embedded image
Drag the image element from the palette, and drop it in the desired location on the page.
On New Image Item, in Select picture from, select Embedded image. If you previously inserted images, New Image Item displays the names of those images, as shown in Figure 9-18.
To embed a new image, choose Add Image.
On Open Image File, find and select the image to embed, then choose Open. New Image Item displays the image.
Choose Insert. The image appears on the page.
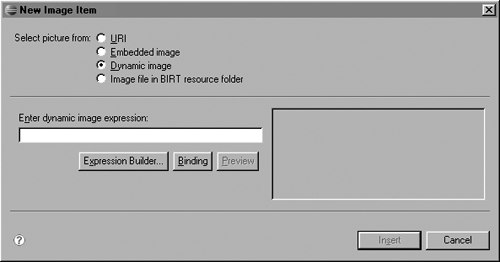
How to insert images that are stored in a data source
In Data Explorer, create a data set that includes the image field.
Bind the table to the data set:
Drag the image element from the palette, and drop it in the detail row of the table.
On New Image Item, select Dynamic image. New Image Item displays Enter dynamic image expression and buttons to help you create the required expression to associate the image element with the images in the data set, as shown in Figure 9-19.
In Enter dynamic image expression, type an expression to use the column binding that refers to the image data set field. For example, if the name of the column binding is IMAGE, this is the expression you type:
row["IMAGE"]
You can also use Expression Builder to construct the expression if you are not sure what syntax to use. In Expression Builder, choose Available Column Bindings, then choose the appropriate column binding.
 Choose Insert. The image element appears on the page in the layout editor. It shows an X. The actual images appear only when you preview the report.