
Most reports display and print on multiple pages. When you design a report, consider how a multipage report displays and prints. You can, for example, design a report so that page breaks occur at logical places. For a report that contains a series of subreports, you can specify page breaks to start each subreport on a new page.
You can also design a page layout that enhances the report’s appearance and usability. A page layout specifies the style of the pages on which report data appears. You can specify, for example, that all pages display the report title in the top-left corner, the company logo in the top-right corner, a page number in the bottom-right corner, and a report-generation date in the bottom-left corner. You can also design special effects, such as a watermark that appears in the background. To design a page layout, you customize the report’s master page.
Before you design a page layout, preview the report in the desired output format, and decide what changes, if any, to make to the default page layout. Consider the following design issues:
Decide whether you are designing a page layout for a PDF or HTML report or a page layout that is suitable for both. A report design renders differently in PDF and in HTML.
For an HTML report, an important decision is whether the report appears on a single scrollable page or on multiple pages. A single page is typical for online viewing, but, if the report is very long, displaying the report on multiple pages might be more suitable. If you choose to display an HTML report on a single page, decide if a master page is necessary. It does not make sense, for instance, to display a page number for a one-page report.
For a PDF report, decide the page dimensions, including paper size, margin sizes, header size, footer size, and page orientation. The default master page uses US letter size (8.5” by 11”). If you are developing a report for a locale that typically uses A4 paper, change the page size.
Decide the design of the master page. The default page layout displays the report-generation date in the bottom-left corner of every page. Report designers typically customize the master page to reflect a corporate style or to provide additional information, such as page numbers or confidentiality statements. You can design a different master page for PDF and HTML output by displaying elements for one output and hiding them for the other. You can also design and use different master pages in a single report.
By default, an HTML report displays on a single scrollable page and a PDF report appears on multiple pages as necessary. A PDF report also displays as much data as can fit on each page. This behavior can result in key sections that appear in the middle or at the bottom of a page. For most reports, you will want to start certain sections at the top of a new page or avoid breaking a section across two pages.
Note that an HTML report appears on multiple pages only when viewed in the report viewer (File→View Report in Web Viewer). When you preview a report in the layout editor or as HTML (File→View Report as HTML), the entire report appears in a scrollable window.
Reports that consist of a series of documents or distinct sections typically look more organized if each document or section appears on a separate page. For example, if a report consists of a cover letter, disclaimer information, and a summary report that is followed by a detailed report, you can insert page breaks to display each type of information on a separate page. Similarly, if a report groups sales data by state, then by customer, you can start the data for each state on a new page.
You can specify page breaks for these elements:
Top-level elements
These are elements that are not placed in another element.
These are elements that are placed in a top-level list, table, or grid. For example, if table A contains table B, and table B contains table C, you can specify a page break for table A and table B, but not for table C.
Groups
You can specify page breaks for data groups defined in top-level and second-level tables or lists.
You specify page breaks using the Page Break Before and Page Break After properties. Table 21-1 describes the values you can select for these properties.
Table 21-1. Values for Page Break Before and After properties
Page Break Before, Page Break After value | Description |
|---|---|
Always | Always insert a page break before or after the selected element. |
Auto | Insert a page break before or after the element as necessary. Auto is the default value. |
Avoid | Avoid inserting a page break before or after the selected element. |
Always Excluding First | Applies only to groups and Page Break Before. Always insert a page break before each instance of the selected group, but not before the first instance. |
Always Excluding Last | Applies only to groups and Page Break After. Always insert a page break after each instance of the selected group, but not after the last instance. |
The rest of this section provides examples of inserting page breaks for various elements.
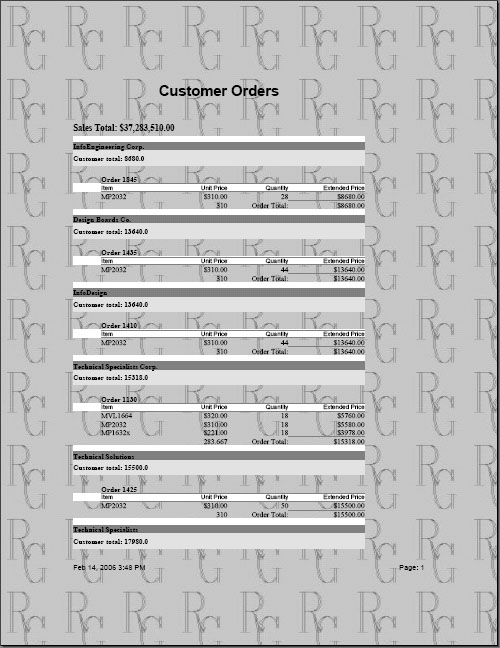
Figure 21-1 shows a PDF report with default page breaks. In this report, the page break properties are set to Auto. Figure 21-2 shows the same report with page breaks after the Top Products and Top States reports and after each state group in the Sales By State and Product report. Notice in Figure 21-2 that the title, Sales By State and Product, repeats at the top of every page of that report. The Repeat Header option is set by default. If you want the report header to appear only once, at the beginning of the report, deselect the Repeat Header option.
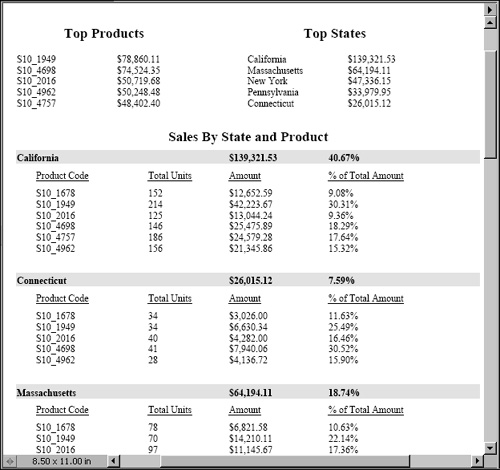

Figure 21-3 shows the output when the same report is displayed in the previewer in the layout editor or in the window when you choose File→View Report as HTML. You can see from the page numbers that page breaks are inserted. All the pages, however, appear on one screen. If you choose File→View Report in Web Viewer, the BIRT report viewer displays each page on a separate screen.
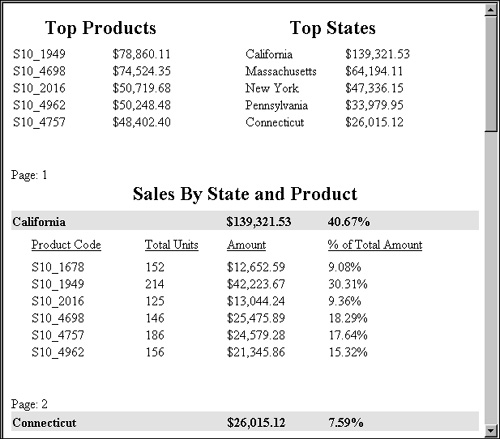
Figure 21-4 shows the report design and indicates where and how page breaks are set. In this report design:
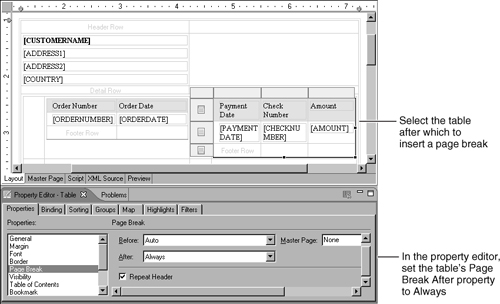
The Page Break After property of the grid at the top of the report is set to Always, which inserts a page break after the grid. Alternatively, selecting the top-level table element that appears after the grid and setting its Page Break Before property to Always achieves the same result.
The Page Break After property of the state group is set to Always Excluding Last. This setting inserts a page break after each state group, except for the last group. If the Page Break After property is set to Always, the report displays a blank page after the last group. Alternatively, you can set the state group’s Page Break Before property to Always Excluding First. This setting inserts a page break before each state group, except for the first group, and prevents a blank page from appearing before the first group.
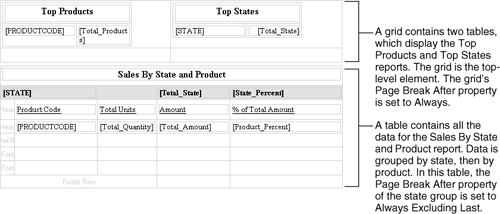
Figure 21-5 shows a partial view of the group editor where you set the state group’s Page Break After property.

In the next example, a report displays data with a master-detail relationship. An outer, top-level table contains two inner tables. The top-level table displays customer information. For each customer, the inner tables display order information and payment information, respectively. Figure 21-6 shows the PDF report with page breaks inserted so that each customer starts on a new page.
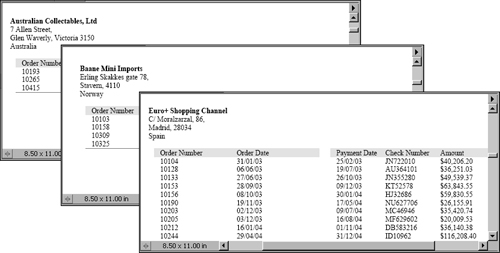
Figure 21-7 shows the report design and indicates where and how the page break is set. The Page Break After property of the second-level table is set to Always.
Specifying page breaks before or after selected sections or groups in a report is the typical way to control pagination. For some reports, however, you might want to insert a page break after a specified number of data rows. In a simple listing report that does not contain groups or multiple sections, you could, for example, display twenty rows on each page. To do so, group data rows by the desired number of rows, and insert a page break after each group.
How to specify the number of rows to display per page
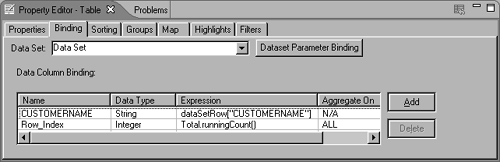
Select the table that contains the data, and on Property Editor, choose Binding to create a new column binding. Specify Total.runningCount( ) as the expression. This aggregate function returns the current row number as BIRT processes each data row. Figure 21-8 shows an example of a column binding that uses Total.runningCount( ).
Select Groups to create a group.
Instead of grouping on a data set field, which is typical, group on the column binding you just created.
Group by interval, and indicate the number of rows by which to group.
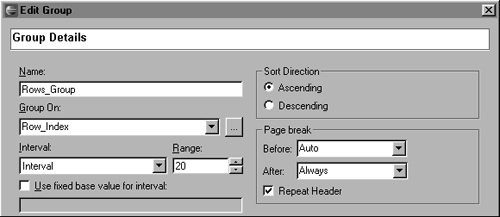
Set the group’s Page Break After property to Always Excluding Last. Figure 21-9 shows an example of a group definition in which each group is set to an interval of 20 rows.
In the layout editor, delete the data element that BIRT automatically adds to the group header. If you do not, the report displays the row number at the beginning of every group.
The master page specifies the dimensions and style of the pages on which report data appears. You can specify, for example, that the page size is 7” x 9”, the printable area is 6” x 8”, the company logo always appears in the top-right corner, and the page number appears in the bottom-right corner.
The page size and margin settings apply only to PDF reports, where these dimensions matter because PDF documents are page-oriented. For HTML reports, data appears directly in the BIRT report viewer or web browser, and the layout of data adjusts to the size of the viewer or browser window.
When you create or open a report design, the layout editor always shows the report layout. To view the master page, use one of the following options:
Choose Page→Master Page→Simple Master Page.
Choose the Master Page tab at the bottom of the layout editor.
You can view either the report layout or the master page but not both at the same time. Figure 21-10 shows the default master page.
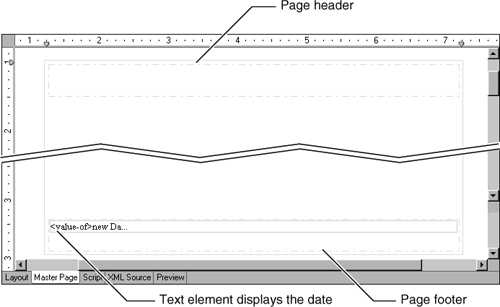
The default master page includes a text element that displays the current date in the page footer. If you preview your report, you see that the current date appears on the bottom left of every report page. You can delete or edit this text element. You can add other elements to the master page by dragging them from the palette and dropping them in the page footer or header.
Observe the following rules:
You can place elements in the header and footer only. You do not place elements in the report content area, because the contents of those elements would overlap report data.
You cannot place more than one element directly in the header or footer. To place multiple elements, insert a grid, then insert the elements in the grid.
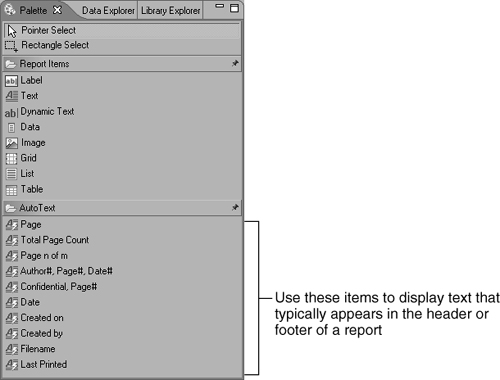
Common header and footer information includes the page number, report-generation date, company name, author name, copyright information, and confidentiality statements.
As Figure 21-11 shows, BIRT Report Designer provides predefined text elements for displaying some of these common items, including the current date, page number, author name, and file name. These items are available on the palette when the master page is displayed.
For example, the date element is a text element that contains the following dynamic value:
<value-of>new Date()</value-of>
After you insert a predefined text element in the page header or footer, you can edit the text to display different information. For example, you can edit the date element to display the date in a different format. By default, the report displays the date according to the locale that is set on the machine on which the report is generated. You can use the format tag to display the date in a custom format, as shown in the following expression:
<value-of format="MM-dd-yy">new Date()</value-of>
To display other text in the header or footer, you can use the other predefined text elements in the palette and edit the text content or insert a regular text or label element and type the text from scratch.
Remember, to display more than one element in the header or footer, you must first insert a grid, then insert the elements in the grid. The predefined Author#, Page#, Date# element creates a grid and three text elements, so you might find it convenient to insert this element, then edit the individual text elements.
As with any text element, you can also customize the appearance of the predefined elements, for example, to display text in a different style or color, or to align text in the center or right of the page.
How to display text in the header and footer
In the layout editor, choose the Master Page tab. The layout editor displays the master page. The palette displays additional elements under AutoText, specifically for use in the master page.
To display a single text element in the header or footer, drag the desired element from the palette, and drop it in the header or footer. For example, to display the page number, insert either the Page element or the Page n of m element.
To display multiple text elements in the header or footer:
Insert the grid element in the header or footer. Delete the date element from the default footer first.
On Insert Grid, specify the number of columns and rows for the grid. If, for example, you want to display two elements on the same line, specify 2 columns and 1 row.
Insert each text element in a grid cell.
You can insert static and dynamic images in a master page. You insert an image in a master page the same way you insert an image in the report layout. The difference is that you cannot insert an image inside a table in the master page. Therefore, when you insert a dynamic image directly on the master page, the same image—the image in the first data row—appears on every page.
The size of the header in the generated report can be different when rendered in PDF and in HTML. For an HTML report, the header dynamically resizes to accommodate its contents, and the header always appears directly above the report content. In an HTML report, the header height property is ignored.
For a PDF report, the header also dynamically resizes to accommodate its contents. Unlike the HTML report, you can specify a fixed size for the header. If you specify a header size of one inch, and you insert an image that is half an inch in height, the report displays half an inch of space between the image and the report data. If the header size you specify, however, is not sufficient to display a large image, the report overrides the specified header size and resizes the header to display the image in its entirety.
Increasing the header size is one way to increase the space between the header content and the report content. However, because header size applies only to PDF output, this technique is not recommended if you want to create a master page that serves both PDF and HTML output equally well.
The preferred technique to add space between the header content and report content is to increase the padding at the bottom of the text or label element placed in the header. Alternatively, if you use a grid to organize multiple elements, you can add a row at the bottom of the grid and set the row size. Using either of these techniques, the extra space appears in both PDF and HTML output.
Like the header, the size of the footer in the generated report can be different for PDF and HTML reports. In both types of reports, the footer dynamically resizes to fit its content. If you specify a footer size, the PDF report displays a footer section of the specified size, except when the contents exceed the specified size. The HTML report ignores the specified footer size.
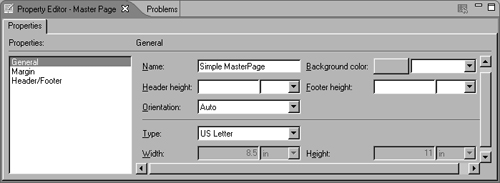
How to specify a header or footer size
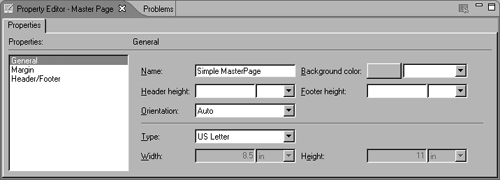
In the layout editor, choose the Master Page tab. The layout editor displays the master page.
In the property editor, choose General properties. The property editor displays the master page’s general properties, as shown in Figure 21-12.
Specify a size for the header height, the footer height, or both.
It is common practice to display header content on every page except the first. For example, a report displays a title in bold and large font on the first page, but in a smaller font at the top of the other pages, as shown in Figure 21-13.

When you insert an element in the page header, it appears, by default, on every page in the report. You control this behavior by turning off the property that controls whether headers appear on all pages or all except the first, as described in the following procedure.
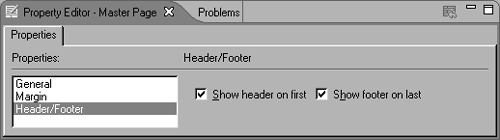
How to exclude header content from the first page
In the layout editor, choose Master Page. The layout editor displays the master page.
In the property editor, choose Header/Footer. The property editor displays the header and footer properties, as shown in Figure 21-14.
Deselect Show header on first.
Choose Preview to verify the report output. If the report contains more than one page, the header content appears on all pages except the first.
A page can contain an image that appears behind the report data. This effect is called a watermark. For example, a document in draft form can display the word Draft across the page. A government document can display a department seal in the background. Figure 21-15 shows examples of reports with watermarks.
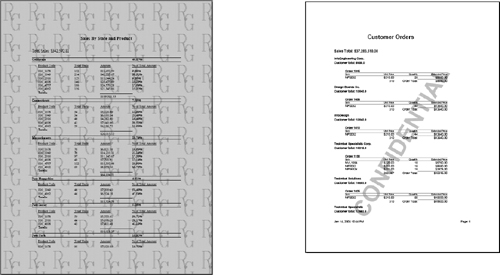
Make sure the image recedes into the background and does not interfere with the readability of the report.
You can use a small image and repeat it so that it fills the entire page. In Figure 21-15, the report on the left shows this effect. Use this technique judiciously. As the example report shows, filling the page with colored images can reduce the readability of the report.
You can use a large image that fills the page. In Figure 21-15, the report on the right shows this effect.
Bear in mind that if any report elements in the report layout have background color, this color appears on top of the background image. Figure 21-16 shows this effect. If you want to display a watermark, limit the use of color in the report layout; otherwise the report could look cluttered.
To use an image as a watermark, select the master page. In the properties view, which is shown in Figure 21-17, expand Simple Master Page, then expand Background. Set the background image to the URL of the image file, such as:
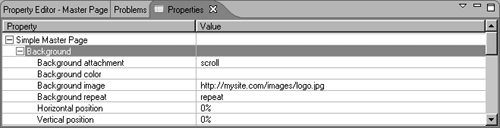
You can specify a local file-system location, such as c:/images/logo.jpg. You should, however, use a local path for testing purposes only. When you deploy the report, the report will not be able to find the image on the local machine.
By default, a background image repeats to fill the page. You can change this behavior by setting the value of the background repeat property:
Specify no-repeat to display the image once.
Specify repeat-x to repeat the image across the page horizontally.
Specify repeat-y to repeat the image across the page vertically.
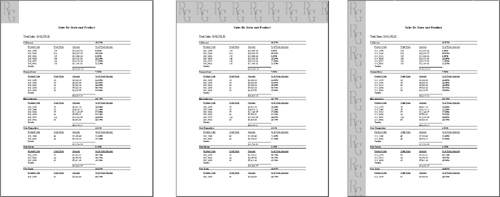
Figure 21-18 shows the results of setting the property to different values.
If you set the Background repeat property to no-repeat, repeat-x, or repeat-y, you can reposition the image to display it on a different part of the page by using the Horizontal position and Vertical position properties. For Horizontal position, you can select the center, left, or right values. For Vertical position, you can select the bottom, center, or top values.
Figure 21-19 shows the results of setting the background repeat, Horizontal position, and Vertical position properties to different values. For both properties, you can also specify a precise position or a percentage. For example, setting Horizontal position to 3 in displays the image three inches from the left of the page. Setting Vertical position to 25% displays the image at the top 25% of the page.

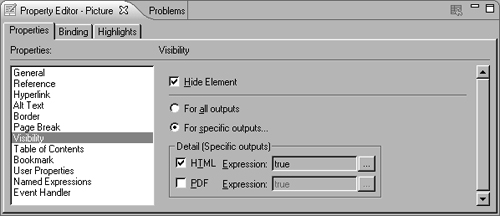
You can design a master page that differs for PDF and HTML. Simply select the element or elements on the master page that you want to display in one output format only, then set the element’s visibility property accordingly. Figure 21-20 shows a picture element’s visibility property set to hide the picture for HTML output.
You also have the option of applying the master page to PDF output only. If, for example, you choose to display a report on a single HTML page, you might not want the report to display any header or footer information. To disable the master page for HTML reports, choose Window→Preferences, then choose BIRT—Preview, and deselect Enable master page content. Note that this option takes effect at the application level, not at the report level.
As explained earlier, these page settings apply to PDF reports only. An HTML report displays directly in the BIRT viewer and its size adjusts to the size of the viewer window.
The default master page uses the following settings:
US letter size, 8.5” x 11”
Portrait orientation
Top and bottom margins of 1”
Left and right margins of 1.25”
You can change these page settings in the property editor, as shown in Figure 21-21.
If you are designing a report for PDF, specify the page settings before you begin laying out report data. If, for example, you set the page width to a smaller size after you lay out the report data, you most probably have to adjust the report contents to fit in the new page size.
You can use multiple master pages in a single report. A report can use different master pages to display, for example, one section of a report in portrait mode, and another section in landscape mode. Using multiple master pages, you can also specify different background color, or different header and footer content for different sections of a report. Figure 21-22 shows a report that uses two master pages. The first page uses a master page that has portrait mode and a watermark. The second page uses a master page that has landscape mode and text in the footer.

To use multiple master pages in a report:
Create the master pages. You can create as many master pages as you wish through the Outline view. Right-click MasterPages and choose Insert to add a new master page to the report design.
Specify a page break for each report section that uses a different master page.
Assign a master page to each report section.
For example, to design the report in Figure 21-22, two master pages, named Portrait and Landscape, were created. The Portrait master page was applied to the first report page, and the Landscape master page to the rest of the report, using the following procedure:
Select the report section that you want to appear on the title page, and set its Master Page property to Portrait. Then set the Page Break After property to Always. Figure 21-23 shows a grid selected, and its master page and page break properties set. The grid contains all the elements whose data appears on the first page.
Select the first element that appears on the next page, and set its master page to Landscape. The Landscape master page is used for the rest of the pages.
