
Data sources typically contain large amounts of data. Reports usually only need a specific subset of data that meets certain criteria. You can select specific records to use in a report by using filters. For example, rather than get information about all customers, you can create filters to select customers in a certain region or customers with a certain credit rank. You can also design filters that provide the report user with the opportunity to specify the filter criteria when the report runs. This chapter discusses creating filters for which you specify the criteria.
Generally, one goal in developing reports with acceptable performance is to limit the amount of data you use to just the data that meets your needs. You can limit, or filter, data in different ways depending on the type of data source you are using and the type of report you are creating.
The first opportunity you have for filtering is by using any filtering techniques provided by your data source. For example, JDBC-compliant databases allow users to run SQL queries that use restrictive WHERE clauses. In fact, best practices recommend designing databases with filtering in mind. You can achieve optimal report performance by filtering data while it is still in the database.
After BIRT retrieves the data from the data source, there are several more opportunities for filtering. The decision on where and when to filter is largely dependent on efficiency. Instead of creating two different data sets that are very similar, for example, you can create one data set that contains information to be used by both a table and a list.
You can use a combination of filtering techniques. For example, if you are accessing data from a database, you can write a query that filters some rows and use other techniques to filter additional rows. Figure 15-1 shows the effects of using various filtering techniques at different points in processing data.
If your report accesses data from a database or an XML data source, you can specify filter conditions to retrieve a certain set of data from the data source. This section covers some typical ways to filter data in a database or XML data source.
When you create a JDBC data set, you use a SQL SELECT statement to specify which rows to retrieve from the database. To select only rows that meet certain criteria, add a WHERE clause to the SELECT statement. The WHERE clause consists of the keyword WHERE, followed by a search condition that specifies which rows to retrieve.
For example, the following statement returns only customers from the USA:
SELECT *
FROM Customer
WHERE country = 'USA'
As another example, the following statement returns only customers from USA and whose credit limit exceeds $10,000.00:
SELECT customerName
FROM Customer
WHERE country = 'USA'
AND creditLimit > 10000
In the following example, the statement returns all customers from USA or Canada:
SELECT customerName
FROM Customer
WHERE country = 'USA'
OR country = 'Canada'
How to filter the rows to retrieve from a JDBC data source
This procedure assumes that you have already created a JDBC data set using a SQL query or stored procedure.
In Data Explorer, double-click the data set to which to add a filter condition.
On Edit Data Set, add a WHERE clause to the SELECT statement to specify a filter condition. For examples and information about the types of filter conditions that you can specify, see the next section.
Choose Preview Results to verify that the query returns only the rows that meet the filter condition.
Table 15-1 describes the types of filter conditions and provides examples of filter conditions that are used in WHERE clauses.
Table 15-1. Examples of filter conditions in the WHERE clause
Type of filter condition | Description | Examples of WHERE... |
|---|---|---|
Comparison | Compares the value of one expression to the value of another expression |
quantity = 10
custName = 'Acme Inc.'
custName > 'P'
custState <> 'CA'
orderDate > {d '2005-06-30'} |
Range | Tests whether the value of an expression falls within a range of values. The test includes the endpoints of the range. |
price BETWEEN 1000 AND 2000
custName BETWEEN 'E' AND 'K'
orderDate BETWEEN
   {d '2005-01-01'}
AND {d '2005-06-30'} |
Membership | Tests whether the value of an expression matches one value in a set of values |
officeCode IN (101,103,104)
itemType IN ('sofa',
   'loveseat', 'endtable',
   'clubchair')
orderDate IN
   ({d '2005-10-10'},
{d '2005-10-17'}) |
Pattern-matching | Tests whether the value of a string field matches a specified pattern |
custName LIKE 'Smith%' (% matches zero or more characters) custName LIKE 'Smiths_n' (_ matches one character) custState NOT LIKE 'CA%' |
Null value | Tests whether a field has a null, or missing, value |
manager IS NULL shipDate IS NULL shipDate IS NOT NULL |
SQL provides many other operators and options that you can use to create more complex search conditions. For more information about the WHERE clause, see the SQL documentation for your JDBC database.
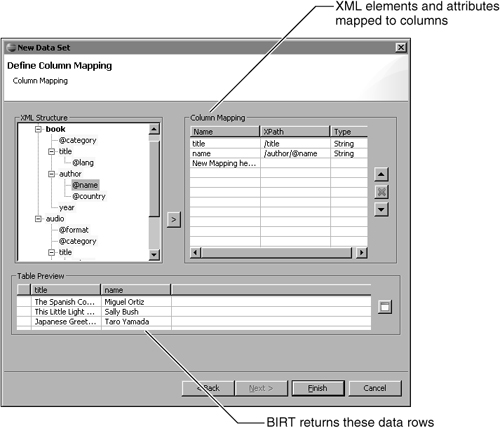
When you create an XML data set, you specify what data to retrieve from an XML data source by mapping XML elements and attributes to data set columns. To map an XML element or attribute to a column, you specify an XPath expression. If you are not familiar with XML, XPath is a query language for accessing parts of an XML document. Figure 15-2 shows an example of column mappings defined in an XML data set and the data rows that BIRT returns.
To select only data that meets certain criteria, specify the value to search in the XPath expression that was used to map the column. The following XPath expression, for example, specifies that only rows where the author’s name is Sally Bush should be retrieved:
author[@name="Sally Bush"]
When filtering data with an XPath expression, observe the following limitations:
You can specify only one value on which to search. You cannot, for example, search for author names Sally Bush and Miguel Ortiz.
You can filter only on XML attributes, not XML elements. The XML structure in the Column Mapping page displays XML attributes with the @ symbol. For example, @category is an attribute, and title is an element.
If you need more advanced filtering capabilities, use BIRT Report Designer’s filter tool, which is described later in this chapter.
How to define a filter on row retrieval for XML data sets
In Data Explorer, double-click the data set to which to add a filter condition.
On Edit Data Set, choose Column Mapping. Column Mapping displays the XML structure and the XML elements and attributes that you mapped to data set columns.
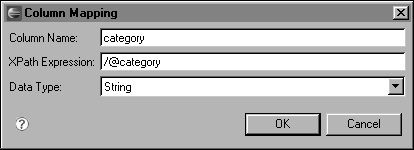
In XML structure, select the attribute on which to filter, then choose the right arrow. You can select only items that contain the @ symbol in their names. Column Mapping appears, as shown in Figure 15-3. It displays a default column name, XPath expression, and data type.
Modify the XPath expression to specify the value on which to filter. The following expressions are examples of XPath filtering expressions:
[@category="CHILDREN"]
author[@name="Sally Bush"]
The value you specify within the double quotation marks (“”) must match exactly the value in the XML document.
Choose OK. The column mapping that you defined appears on Column Mapping.
 In Table Preview, click the preview button to confirm that the filter returns only rows that match the value that you specified.
BIRT provides options for filtering data that complement, and in some cases, replace filtering provided by data sources. It is always recommended to filter at the data source when possible. There are cases, however, when you cannot. For example, if you use flat file data sources and you want to filter data, you must filter data in BIRT.
In addition, if using SQL to modify an existing database query is problematic, you can specify the filter conditions using JavaScript expressions instead of SQL. BIRT Report Designer provides a graphical tool to help you build these filter conditions.
There are three places in BIRT you can filter data. You can create a filter in any or all of these places:
The data set
A report element, such as a table or list
A group
The first opportunity to filter data in BIRT is on the data set level. Use this technique if only one report element uses the data set or if you want all report elements that use the data set to use the same set of rows.
Next, you can filter on a report element. You can edit the report element filter properties to specify conditions for displaying only certain data rows. Use this technique if multiple tables, lists, and charts use the same data set, but you want each report element to display a different set of rows.
For example, you create a data set that returns data for all customers in the USA. You use this data set for two elements, such as a table and a list. You can specify a different filter condition for each element to limit further the rows to display. The table element, for example, can filter the rows to display only customers from California. The list element can filter the rows to display only customers from New York. Figure 15-4 illustrates this concept.
Finally, you can filter on a group of data. If you group data in a table or list, you can edit the filter properties of each group. Filter at the group level if a table or list displays rows in groups and you want to display only certain groups. For example, a sales report groups orders by customer. Rather than showing data for all customers, you can specify a filter to display only customers that have order totals above a certain amount or specify a filter to display only the top three customers.
Figure 15-5 compares three reports that use the same data set but different group filters. The first report shows all customer groups. The second report uses a filter at the customer group level to show only customers whose order totals exceed $100,000.00. The third report uses a filter at the customer group level to show the top three customers with the highest order totals.
You can specify filter conditions at all three levels if your report design needs it. Filtering at each level serves a different purpose, can yield different results, and can have different rules. Use the following guidelines to help you decide where to filter data for a report:
When you filter at the data set level, BIRT filters all rows that are retrieved from the data source.
When you filter at the report element level, BIRT filters all rows that are returned by the data set that is bound to the report element.
When you filter at the group level, BIRT filters only rows in that particular group. In the reports shown in Figure 15-5, you can filter on customer names and order totals only. You cannot, for example, filter on order number, because that data is in a different group. Typically, a filter at the group level uses an aggregate expression.
Filters that use aggregate expressions can be specified only at the group level. The second report shown in Figure 15-5 uses the following filter condition:
Total.sum(row["orderTotal"]) Larger Than 100000
The third report uses the following filter condition:
Total.sum(row["orderTotal"]) Top n 3
If you use an aggregate expression in a filter at the data set or report element level, BIRT Report Designer displays an error message.
Some filter conditions provide the same results whether they are applied at the data set, report element, or group level. In the reports shown in Figure 15-5, if you want to display only customers whose names start with M or a later letter, you can specify the following filter condition at the data set, table, or group level, and the reports display the same data:
row["customerName"] Larger Than "M"
Just as with the data source filtering capabilities, you can design different types of filter conditions with BIRT Report Designer depending on how you want to search for data rows. For example, you can specify that BIRT returns rows when the value of a particular field matches a specific value, when the field value falls within a range of values, when the field value matches a string pattern, or when the field value is null.
The filter tool displays operators as English words instead of the actual operators. For example, the tool displays Equal, Larger than, Larger than or Equal, and Not Equal, instead of ==, >, >=, and !=. Table 15-2 describes the types of filter conditions that you can create with the filter tool. The table also contains numerous examples of expressions you can create using the operators. Most operators can be used with different data types. You should be aware that the filter tool provides two pattern-matching operators: Like and Match. The Like operator enables users who are familiar with SQL to specify pattern-matching expressions using SQL syntax. The Match operator enables users who are familiar with JavaScript to specify pattern-matching expressions using JavaScript’s regular expression syntax.
Table 15-2. Examples of BIRT filter conditions
Type of filter condition | Description | Example as it appears in the filter tool |
|---|---|---|
Comparison | Compares the value of a field to a specified value. |
row["quantity"] Less than 10 row["custName"] Equal "Acme Inc." row["custName"] Larger than or Equal "P" row["custState"] Not Equal "CA" row["orderDate"] Less than or Equal "06/30/05" |
Null value | Tests whether a field has a value or not. |
row["manager"] Is Null row["shipDate"] Is Not Null |
Range | Tests whether the value of a field falls within a range of specified values. The test includes the endpoints of the range. |
|
Conditional logic | Tests if a complete filter condition evaluates to true or false. Use to create a single filter condition that consists of multiple conditions. |
|
Pattern-matching test, using JavaScript syntax | Tests whether the value of a string field matches a specified pattern called a regular expression. For more information about matching patterns with regular expressions, see “Matching string patterns” in Chapter 14, “Writing Expressions.” |
|
Pattern-matching test, using SQL syntax | Tests whether the value of a string field matches a specified pattern that uses SQL syntax. |
|
Top or bottom n logic | Tests if the value of a specified field is within the top or bottom n values. |
|
The procedure for creating a filter condition is the same whether you create it at the data set, report element, or group level. The difference is in how you access the filter tool.
When you create a filter condition, you specify the following information:
The expression to evaluate, typically the field to search, such as row["grade"].
The operator that specifies the type of filter test, such as Equal.
The value for which to search, such as “A”.
You can create more complex filter conditions that include JavaScript functions or scripts. For example, you can specify calculated values for the expression and value portions of the filter. The following example shows a multiline expression in the expression part. The expression returns a customer’s first name from the customerName field, which stores full names:
spaceCharPosition = row["customerName"].indexOf(" ");
stringToGet = row["customerName"]substr(0, spaceCharPosition);
If you combine this expression with the Equal operator and specify a value of “John”, the filter condition extracts the first name from the customerName field, compares the first name to John, and returns only rows where this condition is true.
The expressions and values that you specify in a filter condition in BIRT Report Designer must use JavaScript syntax. If you filter data using both the SQL query and BIRT Report Designer’s filter tool, be careful not to confuse SQL syntax with JavaScript syntax when specifying the filter condition.
It is easy, for example, to confuse the use of single quotation marks (' ') and double quotation marks (" "). SQL requires single quotation marks for string and date constants, but JavaScript requires double quotation marks. Another example is the comparison operator. You use = for SQL and == for JavaScript.
How to filter at the data set level
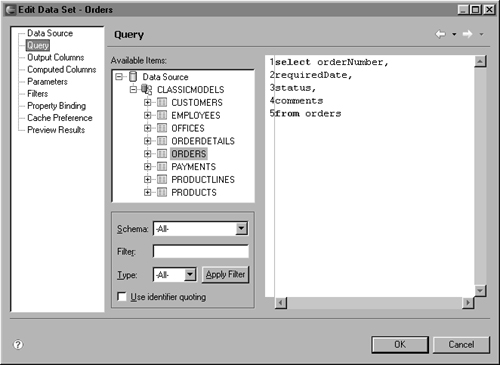
In Data Explorer, right-click the data set whose rows you want to filter, then choose Edit. Edit Data Set displays the query for the data set, as shown in Figure 15-6.
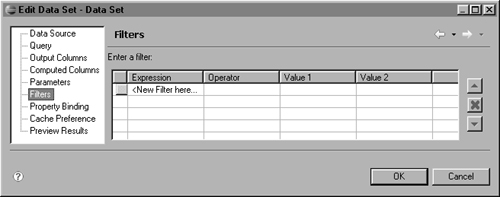
Choose Filters from the left side of the window. Edit Data Set displays filter information, as shown in Figure 15-7.
Specify the filter condition:
Click the cell below Expression. Two buttons appear on the right. The arrow button displays a list of fields you can use in Expression. The ellipsis (...) button launches Expression Builder, which you can use to create a more complex expression.
For Expression, select a field. You can also type the filter expression.
For Operator, select an operator from the drop-down list.
For Value 1, specify the search value. You can type the value, select from the list of values, or use Expression Builder to create a more complex value expression. If you select the Is True, Is False, Is Null, or Is Not Null operator, you do not specify a value.
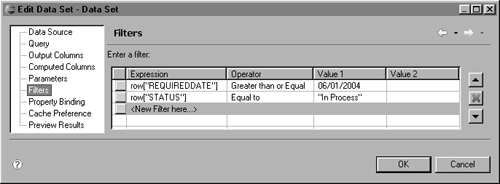
For Value 2, specify a value only if you select the Between or Not Between operator. Figure 15-8 shows some examples of filter conditions.
Choose Preview Results to verify the results that the data set returns. If you specified multiple filter conditions, the report displays only rows that match all filter conditions. To display rows that match any one of the filter conditions, create a single filter condition that contains an OR expression, then select the Is True operator. This task is described later in this chapter.
How to filter at the report element level
These instructions assume you already created a report that uses a table to display data from a data set.
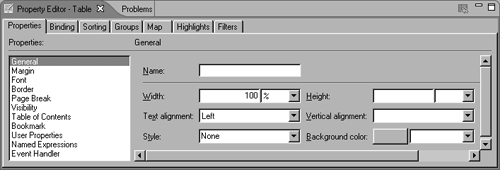
Open Property Editor.
In the layout editor, select the table or list whose data you want to filter. Property Editor displays the properties of the table or list, as shown in Figure 15-9.
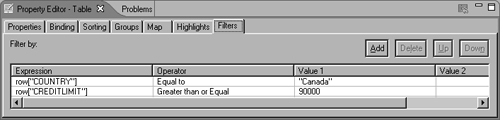
Choose the Filters tab. Property Editor displays the filters page.
Choose Add to create a filter condition.
Specify the filter condition. For detailed steps, see the previous section. Figure 15-10 shows some examples of filter conditions.
Preview the report to verify the results. If you specified multiple filter conditions, the report displays only rows that match all filter conditions.
How to filter at the group level
These instructions assume that you have already created a table that displays data from a data set, and created a group or groups to organize the data.
In the layout editor, select the table that contains the data to filter.
In Property Editor, choose the Groups tab. Property Editor displays the groups that you defined for the table.
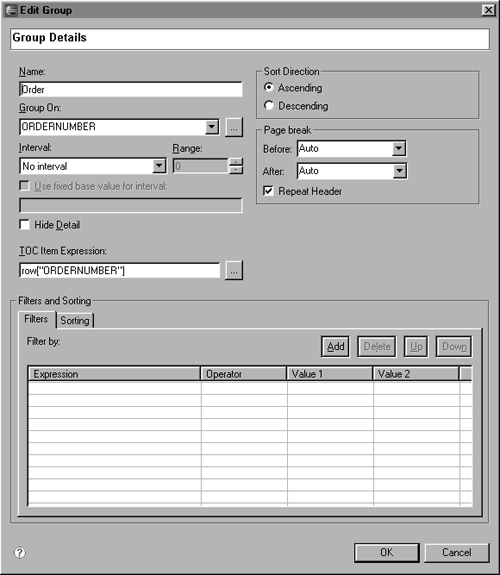
Double-click the group whose data you want to filter. Edit Group displays the properties of the group, as shown in Figure 15-11.
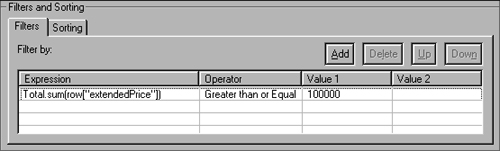
Under Filtering and Sorting, choose Filters.
Choose Add to create a filter condition. A placeholder expression appears in the first row.
Specify the filter condition. Figure 15-12 shows an example.
Preview the report to verify the results. The report displays a different set of group values.
The filter tool enables you to create any number of conditions for filtering data. BIRT evaluates each condition and includes only data rows that meet all the conditions. For example, assume the following two conditions were created with the filter tool:
row["orderTotal"] Larger Than 10000
row["country"] Equal "USA"
In this example, BIRT includes a row only if the value in the orderTotal field is greater than 10000 and the value in the country field is equal to USA. In other words, creating two filter conditions is equivalent to specifying the following JavaScript expression:
row["orderTotal"] > 10000 && row["country"] == "USA"
The following rows meet the specified filter conditions:
Country   Order ID  Order Total

USA       1010      15000
USA       1035      18500
USA       1155      25000
USA       1200      12000
USA       1455      20500
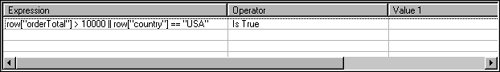
If you want to return a row if it meets any one of multiple conditions, create a single filter condition that uses the OR (||) operator to combine multiple conditions. For example, to include a row where either orderTotal exceeds 10000 or country is USA, create an expression that compares to true, as follows:
row["orderTotal"] > 10000 || row["country"] == "USA" Is True
For expressions that compare to true or false, you must use the comparison operator. As the previous example shows, you use ==, not the assignment operator, =. Figure 15-13 shows how the filter condition is specified in the filter tool. Note that you select Is True from the list of operators under Operator.
In this example, the following rows meet the specified filter condition:
Country   Order ID  Order Total

Belgium   1020      21000
France    2005      14500
USA       1425       5000
USA       1750       7500
USA       1010      15000
USA       1035      18500
USA       1155      25000
USA       1200      12000
USA       1455      20500