
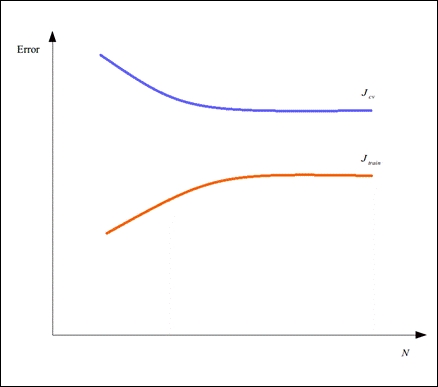
Another useful way to visualize the performance of a machine learning model is to use learning curves. A learning curve is essentially a plot of the error values in a model over the number of samples by which it is trained and cross-validated. For example, a model could have the following learning curve for the training and cross-validation errors:
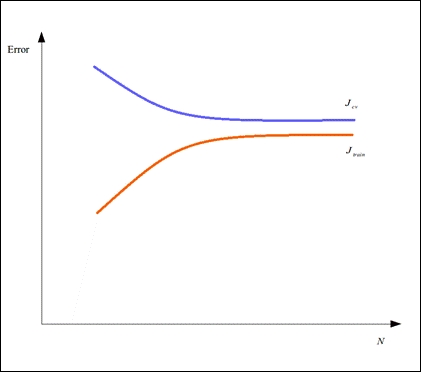
Learning curves can be used to diagnose an underfit and overfit model. For example, the training error could be observed to increase quickly and converge towards a value close to the cross-validation with the number of samples provided to the model. Also, both the error values in our model have a significantly high value. A model that exhibits this kind of variance of error with the number of samples is underfit and has a learning curve similar to the following plot:
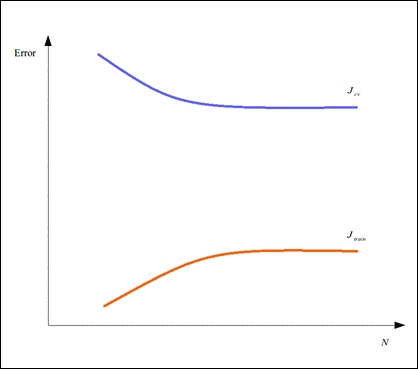
On the other hand, a model's training error could be observed to increase slowly with the number of samples provided to the model, and there might also be a large difference between the training and cross-validation errors in the model. This model is said to be overfit and has a learning curve similar to the following plot:
Thus, learning curve is a good supplementary tool to cross-validation for determining what is not working and what needs to be changed in a given machine learning model.