
Chapter 6
Transporters in Hepatotoxicity
Eleni Kotsampasakou, Sankalp Jain, Daniela Digles and Gerhard F. Ecker
Department of Pharmaceutical Chemistry, University of Vienna, Wien, Austria
Chapter Menu
- Introduction
- Basolateral Transporters
- Canalicular Transporters
- Data Sources for Transporters in Hepatotoxicity
- In Silico Transporters Models
- Ligand-Based Approaches
- OATP1B1 and OATP1B3
- NTCP
- OCT1
- OCT2
- MRP1, MRP3, and MRP4
- BSEP
- MRP2
- MDR1/P-gp
- MDR3
- BCRP
- MATE1
- ASBT
- Structure-Based Approaches
- Complex Models Incorporating Transporter Information
- In Vitro Models
- Multiscale Models
- Outlook
6.1 Introduction
Transmembrane transporters are essential for regulation of the uptake and efflux of endobiotics and xenobiotics at the cellular level as well as in barrier tissues (e.g., blood–brain barrier, kidney, liver, enterocytes). Among them, hepatic transporters possess a vital role, as the liver is the main organ of metabolism and detoxification [1, 2]. Figure 6.1 depicts the main hepatic transporters and their respective location in the hepatocyte. In the following section, we will briefly introduce their significance in selected liver toxicity manifestations.
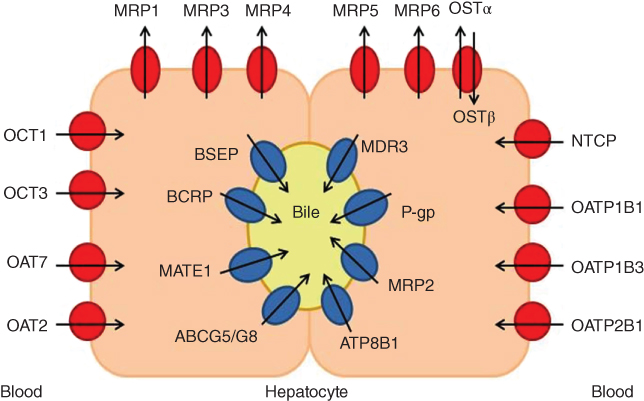
Figure 6.1 Transporters located in the hepatocyte. The medium grey symbols represent the canalicular transporters and dark grey ones the basolateral transporters. Cycles represent uptake transporters and ellipses refer to efflux transporters. The arrows define the direction of transport.
6.2 Basolateral Transporters
Regarding the basolateral uptake transporters, the sodium (Na+) taurocholate co-transporting polypeptide (NTCP) is quite important in the enterohepatic circulation of bile salts, thus contributing to liver homeostasis [3, 4]. It has been proposed that the mechanistic basis of some hepatotoxic – and, in particular, cholestatic - drugs includes the inhibition of NTCP [5]. In addition, the potential association of organic anion transporting polypeptides 1B1 and 1B3 (OATP1B1 and OATP1B3) inhibition with hyperbilirubinemia, a pathological accumulation of conjugated or unconjugated bilirubin in sinusoidal blood [6, 7], is worth mentioning. Hyperbilirubinemia can be drug-induced [6, 7] or genetically induced, such as in the case of the Rotor syndrome [7–13]. Figure 6.2 shows the cycle of bilirubin and how transporters might be involved in the development of this condition.

Figure 6.2 The cycle of bilirubin in the liver. Bilirubin is taken up from sinusoidal blood by OATP1B1 and OATP1B3. It is metabolized by UGT1A1 into mono- and bi-glucuronidated products that are exported into bile primarily by MRP2 and in smaller extent (smaller arrow) by BCRP. A portion of the glucuronidated or unglucuronidated bilirubin is effluxed into sinusoidal blood by MRP4 and the cycle is repeated.
Source: Adapted from Sticova and Jirsa 2013 [11].
For the other major basolateral uptake transporters, such as the organic anion transporters (OATs) and the organic cation transporters (OCTs), there is low incidence for a potential role in toxicity phenotypes in the liver. However, there is one exception, namely, some polymorphisms and mutations in human OCT1 that lead to decreased transport activity of OCT1 in the liver, which can obstruct the biliary excretion of hydrophobic cationic drugs [14].
Regarding the basolateral efflux transporters, the organic solute transporter alpha-beta (OSTα–OSTβ) dimer is upregulated as a protective mechanism against the accumulation of toxic bile salts in the hepatocyte [15]. The same accounts for most of the multidrug resistance-associated proteins (MRPs). Several reviews describe an increase in mRNA levels of MRP1, MRP3, MRP4, and MRP5 [4], as well as an increase in protein levels of MRP3 and MRP4 [16] in hepatobiliary pathological conditions. Moreover, MRP3 as well as MRP1 may act as a compensatory mechanism to alleviate the potential toxic effects of high bile acid concentrations in the liver, when the canalicular efflux transporters such as the bile salt export pump (BSEP) and multidrug resistance-associated protein 2 (MRP2) are blocked [1, 17].
6.3 Canalicular Transporters
For canalicular transporters, the most prominent example is the contribution of both genetically – [3, 18–21] and drug-induced [18, 20, 22–24] BSEP inhibition in the development of cholestatic conditions. MRP2, due to its important role in bilirubin and bile salts transport, is also suggested to be correlated with drug-induced hyperbilirubinemia [11, 25] and cholestasis [26–28]. Similarly, BCRP is also believed possibly contribute to the efflux of bilirubin conjugates into bile [11]. Deficiency of BCRP is also suspected to result in accumulation of toxic bile salts in the liver, which induce toxicity issues [29]. MDR3 maintains the integrity of the membrane and conducts the phospholipid flow across the canalicular membrane of the hepatocyte [30]. It has also been associated with genetically – [1, 16, 26, 29–33] and drug-induced [16, 26, 29, 30, 34, 35] cholestatic conditions.
Furthermore, MDR1 (P-glycoprotein, P-gp) is also expressed in the liver. MDR1 plays a prominent role in drug resistance during cancer therapy [36, 37] and has also been associated with drug-drug interactions. Nevertheless, in most of the cases of drug-induced hepatotoxicity or cholestasis, the implication of P-gp is attributed to its localization in several organ membranes and its great number of its substrates, rather than to direct effects in the liver [38, 39].
The ATP-binding cassette subfamily G members 5 and 8 (ABCG5 and ABCG8) heterodimer, the ATPase class I type 8B member 1, also known as ATPase-aminophospholipid transporter (ATP8B1 or FIC1), the multidrug and toxin extrusion transporter 1 (MATE1), the cystic fibrosis transmembrane conductance regulator (CFTR), the copper-transporting P-type ATP-ase (ATP7B), and the manganese transporter SLC30A10 are also liver transporters with an important physiological role. Despite the fact that they are associated with several diseases – including manifestations of liver toxicity, to our knowledge they are not associated with any pathological drug-induced liver condition.
With this list of transporters and their important role it becomes evident, that any distortion in the proper function of hepatic transporters might result in manifestation of hepatotoxic phenomena. Therefore, knowledge of the inhibitory profile of drugs currently in the market, as well as the ones under development, is vital in order to avoid potential side effects. One step in this direction is the collection of the available data and another step further is the development of robust predictive models for these transporters.
6.4 Data Sources for Transporters in Hepatotoxicity
Currently several large-scale initiatives collect and predict toxicity data for both drugs and environmental chemicals. These include, among others, projects funded by the innovative medicines initiative (IMI) such as eTOX (http://www.etoxproject.eu/) and MIP-DILI (http://www.mip-dili.eu/), the Horizon 2020 EU-ToxRisk project (www.eu-toxrisk.eu) and the Toxicology in the 21st Century (Tox21) initiative [40] (http://tox21.org). EU-ToxRisk aims at advancing in vitro and in silico tools for toxicology, thereby focusing on mechanism-based approaches. Adverse outcome pathways (AOPs) introduced by the Organisation for Economic Co-operation and Development (OECD) play an important role here. One example for an AOP relevant to hepatotoxicity is “cholestatic liver injury induced by inhibition of the BSEP (ABCB11)” [41].
Searching for data on hepatotoxicity in bioactivity databases, such as ChEMBL [42, 43] or PubChem [44], is difficult owing to the way biological data are organized. While searches for bioactivity data for protein targets are straightforward, hepatotoxicity as a “target” is more difficult to define. For example, an assay search in ChEMBL version 22 [43] (accessed October 5, 2016) for “hepatotoxicity” returns 585 different assays mentioning hepatotoxicity in the assay description. Here, the target is for example the tissue Liver, the cell-line hepatocyte, or the general target ADMET. However, the phenotype “hepatotoxicity” is available as target directly (CHEMBL1697861) and is connected with 31 assays. These include, among others, datasets mined from literature [45, 46], the drug induced liver injury prediction system (DILIps) training set [47], and the food and drug administration (FDA) liver toxicity knowledge base benchmark dataset (LTKB-BD) [48]. Of note for hepatotoxicity, but not yet available in ChEMBL, is a recent work by Chen et al. [49], where a reference list for drug-induced liver injury (DILI) was presented.
While identifying activity values for a specific transporter is more straightforward, interpreting the data can be challenging. As an example, a search for BCRP easily identifies the human protein (CHEMBL6020), which shows a total of 1799 bioactivity values. While a large portion of the values are reported as IC50 values in nanomolar (nM) units (615), others are given as inhibition in percentage (357), activity in percentage or fold increase of control (278), or EC50 in nM (213). Several activities are reported as ratios (58) or other activity types (275), for example, fluorescence intensity, drug transport, intrinsic activity, or permeability. This makes a direct comparison of the values rather difficult. In addition, measurements of different assay setups cannot always be directly compared, as shown for P-gp inhibitors [50].
To retrieve bioactivity values for transporters (e.g., to build computational models), a list of relevant transporters is needed first. This can be achieved by reviewing the literature, but data collections such as the Gene Ontology (geneontology.org) [51] can be helpful as well. For example, the molecular function of “canalicular bile acid transmembrane transporter activity” (GO:0015126) can be used to retrieve a list of BSEP proteins from different organisms.
6.5 In Silico Transporters Models
Table 6.1 summarizes some of the available computational models of hepatic transporters implicated in hepatotoxicity, namely, BSEP, MRP2, MDR1, BCRP, MATE1, OCT1, OCT2, OATP1B1, OATP1B3, MRP3, MRP4, NTCP, ASBT, and OATPs. Owing to the heterogeneity of experimental reports in terms of assay types, test concentrations, and experimental conditions, most computational studies focus on classification models of varying prediction performances. These models are built to distinguish inhibitors from non-inhibitors [79]. Only a few models for prediction of binding affinity or inhibition at a quantitative level are available. Their predictivity is usually limited to small sets of compounds with measurements from assays with similar experimental conditions [79].
Table 6.1 Summary of the best-performing models for transporters
| Transporter | Model summary (best model) | Performance (TS, EV) | Dataset size (training set/TS, EV) | References |
| OATP1B1 | OPLS-DA (Cl. inhib) | Correctly predicted 81% inhibitors and 93% non-inhibitors | 98/48 | Karlgren et al. [52] |
| PLS (Cl. inhib) | Acc. = 79% | 150/75 | Karlgren et al. [53] | |
| RF (Cl. inhib) | Acc. = 85% | 1708/201 | Kotsampasakou et al. [54] | |
| OATP1B3 | PLS (Cl. inhib) | Acc. = 92% | 150/75 | Karlgren et al. [53] |
| SVM (Cl. inhib) | Acc. = 87% | 1725/209 | Kotsampasakou et al. [54] | |
| OATP2B1 | PLS (Cl. inhib) | Acc. = 75% | 118/60 | Karlgren et al. [53] |
| RF (Cl. inhib); kNN (Cl. inhib) | Acc. = 80% (RF, kNN) | 109/27 | Sedykh et al. [55] | |
| RF (Cl. subst.); kNN (Cl. subst.) | Acc. = 75% (RF, kNN) | 42/11 | Sedykh et al. [55] | |
| NTCP | Pharmacophore | Acc. = 60% | 5/10 | Greupink et al. [56] |
| OCT1 | OPLS-DA (Cl. inhib) | Acc. = 85% | 95/96 | Ahlin et al. [57] |
| OCT2 | 2D-QSAR | R2 = 0.81 | 28/6 | Suhre et al. [58] |
| 3D-QSAR (CoMFA) | R2 = 0.97 | 28/6 | Suhre et al. [58] | |
| Pharmacophore (combinations) | Acc. = 70% | 162/299 | Xu et al. [59] | |
| MRP1 | Stepwise multiple regression | R2 = 0.77 | 29/0 | Van Zanden et al. [60] |
| Pharmacophore | R2 = 0.80 | 60/20 | Tawari et al. [61] | |
| CoMFA | Q2 = 0.71 | 107/0 | Pajeva et al. [62] | |
| CoMSIA | Q2 = 0.73 | 107/0 | Pajeva et al. [62] | |
| MRP3 | SVM (Cl. subst.) | Acc. = 98% | 50/12 | Sedykh et al. [55] |
| MRP4 | SVM (Cl. subst.) | Acc. = 89% | 74/18 | Sedykh et al. [55] |
| SVM (Cl. inhib) | Acc. = 67% | 51/13 | Sedykh et al. [55] | |
| BSEP | SVM (Cl. inhib) | Acc. = 87% | 437/187 | Warner et al. [145] |
| Multiple linear regression | R2 = 0.95 | 37/0 | Saito et al. [63], Pedersen et al. [64] | |
| OPLS-DA | Acc. = 89% | 163/86 | Pedersen et al. [64] | |
| RF (Cl. inhib) | Acc. = 80% (TS), 89% (EV) | 670/168 (TS), 156 (EV) | Montanari et al. [65] | |
| MRP2 | SA-PLS (binding affinity, Ki) | R2 = 0.82 | 20/5 | Ng et al. [66] |
| OPLS-DA (Cl. inhib) | Acc. = 72% | 79/39 | Pedersen et al. [64] | |
| SVM (Cl. inhib) | Acc. = 77% | 257/61 | Zheng et al. [67] | |
| RF (Cl. inhib) | Acc. = 75% | 964/240 | Pinto et al. [68] | |
| SVM (Cl. subst.) | Acc. = 87% | 150/38 | Sedykh et al. [55] | |
| SVM (Cl. inhib) | Acc. = 89% | 77/19 | Sedykh et al. [55] | |
| MDR1 | LDA (Cl. inhib) | Acc. = 85% (TS), 86% (EV) | 772/85 (TS), 418 (EV) | Broccatelli et al. [69] |
| Naive Bayes (Cl. inhib) | 81% | 973/300 | Chen et al. [70] | |
| SVM (Cl. inhib) | 75% | 1201/407 | Klepsch et al. [71] | |
| BCRP | ANN, SVM (Cl. inhib) | Acc. = 87% (TS), 67% (EV) | 96/32 (TS), 147 (EV) | Erić et al. [72] |
| OPLS-DA (Cl. inhib) | 79% | 80/43 | Matsson et al. [73] | |
| Pharmacophore (Cl. inhib) | 66% | 30/79 | Pan et al. [74] | |
| Logistic regression (Cl. inhib) | 64% (leave-sources-out CV); 83% (10-fold CV) | 978 | Montanari et al. [75] | |
| ASBT | Linear regression (binding affinity, Ki) | R2 = 0.73 | 29/1 | González et al. [76] |
| Linear regression (binding affinity, Ki) | R2 = 0.68 | 23/4 | Zheng et al. [77] | |
| Linear regression (binding affinity, Ki) | R2 = 0.89 | 31/1 | Rais et al. [78] | |
| kNN (Cl. subst.) | Acc. = 94% | 80/20 | Sedykh et al. [55] | |
| RF (Cl. inhib) | Acc. = 88% | 120/30 | Sedykh et al. [55] |
The type of transporter and the summary for the best model (algorithm, performance, data size, and original publication) are provided.
Cl. inhib., classification of inhibitors; Cl. subst., classification of substrates; Acc., accuracy; TS, test set; EV, external validation set; RF, random forest; SVM, support vector machine; PLS, partial least squares regression; OPLS-DA, orthogonal partial least-squares projection to latent structures discriminant analysis; CoMFA, comparative molecular field analysis; CoMSIA, comparative molecular similarity index analysis; LDA, linear discriminant analysis; SMO, Kohonen self-organizing maps; BPNN, back-propagation neural network; QSAR, quantitative structure–activity relationship; ANN, artificial neural network; kNN, k-nearest neighbor; SA-PLS, simulated annealing-partial least squares.
6.6 Ligand-Based Approaches
Considerable progress has been made in the development of in silico prediction models for canalicular transporters such as BSEP, MRP2, MDR1, and BCRP. In addition, there were also recent advances for in silico models for basolateral transporters.
6.7 OATP1B1 and OATP1B3
Karlgren et al. proposed a computational model for OATP1B1 [52] based on 146 compounds (2/3 training set; 1/3 test set) using orthogonal partial least-squares discriminant analysis (OPLS-DA). The model used a set of molecular descriptors and achieved a performance of 80% sensitivity and 91% specificity for a test set. Subsequently, they reported classification models for OATP1B1, OATP1B3, and OATP2B1 inhibitors at a 20 μM potency threshold, with accuracies between 75% and 93% [53]. Following a proteochemometric modeling approach, De Bruyn et al. [80] combined protein-based and ligand-based molecular descriptors using random forest (RF) as classifier. They used 2,000 compounds for training and 54 compounds as an external test set. An additional OATP1B1 classification model was published by van de Steeg et al. [81] Their Bayesian model was based on a training set of 437 compounds (37 inhibitors and 400 non-inhibitors) and an internal set of 155 compounds for validation (12 inhibitors and 143 non-inhibitors), resulting from the screening of a commercial library of 640 FDA-approved drugs. The overall model performance was greater than 80%, both for leave-one-out cross-validation and external validation. Kotsampasakou et al. [54] developed a set of classification models for OATP1B1 and OATP1B3 inhibition based on 1,700 curated compounds from the literature. Virtual screening of DrugBank drugs followed by biological testing of 10 top-ranked hits confirmed the validity of the models, yielding in an accuracy of 90% for OATP1B1 and 80% for OATP1B3, respectively.
6.8 NTCP
A study by Greupink et al. [56] proposed a ligand-based common feature pharmacophore model consisting of two hydrogen bond acceptors and three hydrophobic features. This model, based on five NTCP substrates, was then applied to screen large chemical libraries. In the virtual screening procedure, 10 compounds were selected out of which 6 notably inhibited taurocholate uptake in NTCP overexpressing cells.
6.9 OCT1
Three pharmacophore models have been reported for OCT1 so far [82–84]. Ahlin et al. [57] investigated the inhibition patterns of OCT1 using registered oral drugs to develop predictive computational models. Increased lipophilicity and positive net charge were found to be key physicochemical properties that positively correlated with OCT1 inhibitory activity. Moreover, dipole moment and multiple hydrogen bonds were found to be negatively correlated. The data were used to generate orthogonal partial least-squares projection to latent structures discriminant analysis (OPLS-DA) models for OCT1 inhibitors so as to discriminate the inhibitors from the non-inhibitors. The final model correctly predicted 82% of the inhibitors and 88% of the non-inhibitors from the test set.
6.10 OCT2
A 2D-QSAR model based on 34 OCT2 inhibitors that inhibit tetraethylammonium (TEA) transport was reported by Suhre et al. [58]. Another study by Zolk et al. [85] analyzed 26 commonly used drugs for inhibition of MPP+ uptake. A significant correlation was found between the topological polar surface area (TPSA) and activity on MPP+ uptake inhibition. Kido et al. [86] experimentally screened 910 compounds, of which 244 compounds inhibited OCT2-mediated transport of 4-(4-(dimethylamino)styryl)-N-methylpyridinium(ASP+). Using computational analysis, molecular charge was identified as one of the key properties for differentiating inhibitors from non-inhibitors. The 10 most potent OCT2 inhibitors were used to generate a two-point pharmacophore, showing a pattern of an ion-pair interaction site and a hydrophobic aromatic site separated by 5.0 Å.
Xu et al. [59] designed a scheme for screening combinations of pharmacophores based on hypotheses established using 162 OCT2 inhibitors. The final model comprises four individual pharmacophores. The combinatorial model provided an overall accuracy of about 70% on a test set containing 81 OCT2 inhibitors and 218 non-inhibitors.
6.11 MRP1, MRP3, and MRP4
van Zanden et al. [60] studied the effect of flavonoids on MRP1 and MRP2 transfected MDCKII cells. A QSAR model for the inhibition of MRP1 was obtained [60]. Pharmacophore-based models are reported for MRP1 inhibition by Chang et al. [87], Tawari et al. [61], and Pajeva et al. [62].
Owing to lack of experimental measurements, very few computational studies exist for the basolateral bile acid efflux transporters MRP3 and MRP4 (Table 6.1). Sedykh et al. [55] reported classification models of MRP4 inhibitors at a 10 μM threshold with accuracy of 70% on external dataset. The modeling was based on a rather small set of 64 molecules. In a recent study, Akanuma et al. [88] attempted structural analysis of MRP4 transport for several groups of β-lactam antibiotics.
6.12 BSEP
For the human BSEP, Warner et al. [20] used a recently described in vitro membrane vesicle BSEP inhibition assay to quantify transporter inhibition for a set of 624 compounds. A support vector machine (SVM) learning model, employing in-house descriptor sets comprising 2D, 3D, and fingerprint-like features, led to prediction accuracy of 87%. Relating a set of physicochemical properties of the compounds to BSEP inhibition, they demonstrated that lipophilicity and molecular size are significantly correlated with BSEP inhibition. The model could be further used to minimize the propensity of drug candidates to inhibit BSEP. Saito et al. [63] reported a BSEP inhibition model based on multiple linear regression using 37 diverse druglike compounds and their chemical fragment descriptors. However, the model was not validated further to evaluate its applicability. The model proposed by Hirano et al. [89], based on as few as 37 compounds, does not allow in silico profiling of chemically diverse compound libraries. Later, Pedersen et al. [90] built two OPLS-DA models on 163 compounds. They report an accuracy of 89% on a test set of randomly selected 86 compounds. Nevertheless, none of the aforementioned models were applied in prospective studies to mark BSEP inhibitors in real-life settings.
In a more recent study, Montanari et al. [65] developed a classification model based on a set of physicochemical descriptors. The model revealed the importance of hydrophobicity, aromaticity, and H-bond donor characteristics in distinguishing inhibitors from non-inhibitors. One major finding of these studies was bromocriptine - a known drug - being identified as BSEP inhibitor. The accuracies of the BSEP models on external datasets ranged from 70% to 90%.
6.13 MRP2
Several publications have proposed prediction models for MRP2 inhibition (Table 6.1) using linear and nonlinear modeling methods. For linear models, mainly partial least squares (PLS) regression and discriminant analysis were used, while nonlinear modeling methods include SVM, k-nearest neighbors (kNN), and RF [55, 64, 91]. Ng et al. developed a QSAR model of binding affinity to rat MRP2 for 25 methotrexate analogs as well as a pharmacophore for their binding mode [66]. Zhang et al. [91] have constructed a pharmacophore for MRP2 inhibitors, which performed slightly worse than their SVM-based model. Pinto et al. [68] applied different machine learning methods for the development of models for putative substrate/non-substrate classification for MRP2. Although the prediction performance is not excellent, the study can be marked as the first of its kind for classification of a huge set of putative MRP2 substrates and non-substrates.
6.14 MDR1/P-gp
P-gp is a thoroughly studied ABC transporter protein. A number of ligand-based approaches have been proposed already, including conventional methods such as Hansch analysis, linear and nonlinear classification algorithms, pharmacophore modeling, and even more advanced methods such as supervised and unsupervised artificial neural networks [92–97]. One of the groundbreaking contributions is the work of Broccatelli et al. [69], who used a combination of molecular field analysis, pharmacophore-based representation of the compounds, as well as physicochemical descriptors to develop both global and local models for P-gp inhibitors. The final model indicated that flexibility, hydrophobic surface area, and log P are the discriminating physicochemical properties for inhibitors and non-inhibitors. The model, which was based on 1275 compounds extracted from 61 studies, also points toward shape, a 3D descriptor/feature, as a crucial discriminative property. With a reported accuracy of 86%, the model demonstrated a sensitivity of 0.9, a specificity of 0.8, and Cohen's kappa of 0.7 when tested on an external set. In addition to binary classifiers, a number of other 2D-QSAR models [98–107] and machine learning methods were successfully applied for prediction of P-gp substrates and inhibitors [108, 109].
Wang et al. [109] used unsupervised machine learning methods such as Kohonen self-organizing maps, which were also employed to predict P-gp substrates and inhibitors. The best model, based on a dataset of 206 compounds, correctly predicted 83% of substrates and 81% of inhibitors. Models based on recursive partitioning and Naïve Bayes methods were developed by Chen et al. [70] on a dataset containing 1273 compounds. The best model accurately predicted 81% of the compounds in the test dataset. Klepsch et al. [71] used BestFirst as a feature selection method using a dataset of 1608 P-gp inhibitors and non-inhibitors. Random forest and SVM models were reported as the best classifiers, accurately predicting a total of 86% and 83% of the training set compounds and 73% and 75% of the test set compounds, respectively.
Different studies, employing a range of simple to complex methods, showed satisfactory prediction performance and have contributed to identification of molecular features that are involved in P-gp mediated MDR reversal. However, the applicability of the models is questionable, taking into account the still relatively small number of molecules investigated in each of these studies [110].
6.15 MDR3
Multidrug resistance protein 3 (MDR3) is the closest homologe to P-gp sharing a sequence identity of 75%. Only five substrates could be identified in previous studies [111]. Regarding inhibitors, a study by He et al. [34] led to the discovery of nine drugs that inhibit MDR3, while a more recent study by Mahdi et al. showed inhibition of MDR3 by antifungal azoles. In addition, their data indicated a potential increased cholestatic effect in case of simultaneous inhibition of BSEP and MDR3 [35]. However, this information is not sufficient to establish in silico prediction models.
6.16 BCRP
Several global machine learning-based classification models have been proposed to predict BCRP inhibition. Erić et al. [72] extracted and merged literature data on BCRP inhibition to build neural network and SVM models based on 96 compounds. The models provided test set accuracies over 82%, sensitivities over 83%, and specificities over 80%. Matsson and colleagues [73] developed models that could distinguish BCRP inhibitors from non-inhibitors using a diverse training set of 80 compounds and the descriptors log D and polarizability. The best model had a sensitivity of 83% and a specificity of 76% on a test set of 43 compounds. Pan et al. [74] developed a Bayesian classification model and a set of pharmacophores on 203 compounds. Screening the collaborative drug discovery (CDD) database [112] with these models led to selection and testing of 33 compounds. Among them, two compounds, flunarizine and pimozide, showed significant BCRP inhibition at 10 μM. All these models were built on rather small datasets, without using all the data available at the respective times of their studies.
Montanari et al. [113] compiled the largest set of 978 BCRP compounds available up to now by extracting information from 47 different studies. The authors reported an accuracy of 0.92 and an area under the ROC curve (AUC) of 0.85 in cross validation based on a naïve Bayes model. Later on, this dataset was used [75] to build a global binary classification model for prediction of BCRP inhibition. The final model was used to screen all the approved drugs in DrugBank to identify potential BCRP inhibitors. Ten drugs were selected and tested in BCRP-expressing PLB985 cells. Among them, two drugs, cisapride (IC50 = 0.4 μM) and roflumilast (IC50 = 0.9 μM), showed inhibition in the sub micromolar range.
6.17 MATE1
Protein-ligand interactions for organic cation transporters and the multidrug and toxin extrusion (MATE) transporter have been investigated using pharmacophores and quantitative structure-activity relationships [58, 82, 85, 86, 114]. In a recent study, Astorga et al. [114], characterized the relative selectivity of MATE1 and MATE2-K for some clinically important organic cations (OCs). Novel inhibitors for these transporters were identified and predictive models of MATE1 selectivity were developed. Using the IC50 values, a common-feature pharmacophore could be developed along with quantitative pharmacophores for hMATE1. Furthermore, a Bayesian model suggesting molecular features favoring and not favoring the interaction of ligands with hMATE1 was introduced [114].
In another study, Wittwer et al. [115] proposed an RF classification model to identify MATE1 inhibitors and non-inhibitors. The average AUC for 10 tests was 0.70 ± 0.05 (permutation test; p-value < 0.0001), indicating that models of good quality had been obtained.
6.18 ASBT
Efforts from Zheng et al. [67, 77], Rais et al. [78, 116], and González et al. [76] provided several QSAR models and pharmacophore models for ASBT binding affinity, with R2 values between 0.68 and 0.89. All were trained on small congeneric series of conjugated bile acid derivatives. Classification QSARs of ASBT inhibitors based on 10 and 100 μM potency thresholds were reported by Sedykh et al. [55] and Zheng et al. [67], respectively.
To summarize this part, based on the data presented in Table 6.1, confined size of datasets has been a major limitation in developing highly accurate in silico prediction models to identify the drug interaction potential of hepatic transporters. The conformational flexibility of membrane transporters, the diverse chemical space covered by their substrates, and the inconsistency in data availability from experimental assays limit the predictive power of computational models even further.
6.19 Structure-Based Approaches
As stated earlier, the nonnavailability of resolved 3D structures of a number of membrane transporters is the reason for limited progress in structure-based approaches for transporter interaction prediction. However, in recent years, a number of 3D structures of ABC transporters have been resolved [117, 118]. Thus, improved performance of experimental approaches [119] has led to the development of structure-based models with decent performance.
Bikadi et al. [120] used SVM prediction and molecular docking approaches to predict P-gp substrate binding modes. Dolghih et al. [121] separated P-gp binders from non-binders via induced fit docking into the crystal structure of mouse P-gp (PDB ID: 3G60) [117] and using the docking score for subsequent classification. Further, Chen et al. [93] performed docking studies using 245 P-gp substrates and non-substrates, but could not clearly separate them on the basis of the Glide docking scores [122]. Klepsch et al. [123] docked a set of propafenones into a homology model of human P-gp. The study revealed that the binding poses are consistent with QSAR data, indicating that the observations can be exploited in identification of new P-gp inhibitors [124]. This study was further extended to structure-based classification of nearly 2000 compounds, which showed a prediction accuracy of 61% for the external test set compounds [71].
Although ligand-based approaches, owing to their high speed and accuracies, remain the method of choice for classification of transporter ligands, structure-assisted docking models show reasonable prediction accuracies in addition to providing valuable information on putative protein-ligand interactions at the molecular level.
6.20 Complex Models Incorporating Transporter Information
As described in the introduction, there is ample of evidence for the association between hepatic transporters and toxicity manifestations in the liver. This knowledge generated the idea that transporter information (inhibition, expression, or upregulation) could be incorporated within in vitro or in silico models, together with other assay data and physicochemical and/or biological descriptors. This is also in line with the FDA recommendations for transporters to be tested during drug development [125, 126]. Curiously, despite the fact that information on drug-transporter interactions is quite important and there are several in vitro and in silico models available for transporters per se, as outlined in the next section, there are only few studies combining the transporters information with other data.
6.21 In Vitro Models
There have been some well-established assays for hepatic transporters inhibition to predict liver toxicity. Especially in the case of BSEP, whose inhibition is linked with cholestasis, the respective screening is considered essential at the early stages of drug development. However, although there are several methods to measure BSEP inhibition, not all of them are equally suitable. In their review, Kis et al. [22] describe several appropriate in vitro methods that can predict BSEP-drug interactions. Furthermore, Szakács et al. present several in vitro methods and models for elucidating the ADMET profile of ABC transporters [127].
Thomson et al. have proposed a combination of assays for cytotoxicity [128]. Their suggestion is the use of a hazard matrix based on covalent binding, in conjunction with an array of five in vitro assays, addressing cytotoxicity in different cell lines and inhibition of the canalicular transporters BSEP and MRP2, with individual cutoff values for each assay. Aleo et al. have shown that the severity of human DILI is highly associated with the dual inhibition of mitochondrial function and BSEP, flagging them as two very important liability factors that should be checked during pharmaceutical screening [129]. Another study by Schadt et al. [130] proposed a methodology based on a compilation of assays to predict DILI for drug candidates. Among these assays are BSEP inhibition, glutathione adduct assay, CYP3A time-dependent inhibition, cytotoxicity in human hepatocytes, mitochondrial toxicity, and cytotoxicity in NIH 3T3 mouse fibroblasts. As a training set, 81 marketed or withdrawn compounds with differing DILI classes (according to FDA) were used. The resulted modeling approach yielded a performance of 79% overall accuracy, 76% sensitivity, and 82% specificity for the external test set composed of 39 compounds [130].
On a slightly different level, Dawson et al.s' [18] testing of 85 drugs for human BSEP inhibition, as well as its rat ortholog Bsep, followed by statistical analysis showed that inhibition of BSEP/Bsep correlates with the drug potential to cause DILI with an r2 = 0.94. Moreover, all drugs with human BSEP IC50 < 300 μM had molecular weight > 250, ClogP > 1.5, and nonpolar surface area > 180 Å [18].
Similarly, in the work of Köck et al. [131], 88 drugs (100 μM) were investigated regarding their inhibitory effect on MRP3- and MRP4-mediated substrate transport. 50 BSEP non-inhibitors (24 non-cholestatic; 26 cholestatic) and 38 BSEP inhibitors (16 non-cholestatic; 22 cholestatic) were examined. MRP4 inhibition was associated with an increased cholestatic risk among BSEP non-inhibitors. In this group, for each 1% increase in MRP4 inhibition, the odds of the drug being cholestatic increased by 3.1%. By implementing a cutoff value of 21% for inhibition, which predicted a 50% chance of cholestasis, 62% of the cholestatic drugs inhibited MRP4 (P < 0.05). Nevertheless, merely 17% of non-cholestatic drugs were MRP4 inhibitors. Among BSEP inhibitors, MRP4 inhibition did not provide additional predictive value for cholestatic potential, as almost all BSEP inhibitors were also MRP4 inhibitors. The study failed to prove statistically significant association of MRP3 inhibition and cholestasis, regardless of the drug's capability to inhibit BSEP.
6.22 Multiscale Models
During the last decades, there has been a vast development in biomedical research, which allows the investigation of biological systems with higher level of detail and accuracy [132]. Multiscale models, that is, complex models that couple high- and low-resolution models thus allowing the study of biological systems from atomic to macroscopic levels [133], have made considerable contribution in this direction. The virtual liver network (VLN) is a characteristic example where several multiscale models are combined to simulate the function of a single organ [132]. Similar initiatives have also taken place previously for heart, such as the Virtual Heart (http://thevirtualheart.org/) [134] and the Living Heart Project (http://www.3ds.com/products-services/simulia/solutions/life-sciences/the-living-heart-project/) [135]. They combine information from the level of molecular targets, move toward molecular pathways/processes, then cellular/tissue processes, and end up at a tissue or whole-organ endpoint. This approach, apart from modeling the physiological function of an organ, can further be implemented for modeling whole-organ toxicity [136]. These multiscale models might facilitate the discovery of potentially hazardous drugs/chemicals at the early stages of drug discovery in a more efficient way than the single models, as more parameters that contribute to toxicity are taken into account.
In this direction, Diaz Ochoa et al. [137] developed a multiscale modeling framework for spatiotemporal prediction of substances' distribution that may result in hepatotoxicity. This framework consists of cellular models, a 2D liver model, and a whole-body model. Several mechanistic, genome-based in silico cells composite the 2D liver model and the whole-body model, including also the function of MRP2, MRP3, and MRP4. In principle, they use cellular systems for kinetic modeling and their aim was not only to calculate the drug concentration in the organ, but also the cell viability [137].
Another systems biology approach based on the analysis of dynamic adaptations in parameter trajectories (ADAPT) pointed out the important role of liver X receptor (LXR) activation for the development of steatosis [138]. Hijmans et al. showed that both input and output fluxes to hepatic triglyceride content can be induced by LXR activation, and during the early stages of LXR activation, steatosis can be induced by just a small imbalance between input/output fluxes of triglycerides. For the modeling analysis, mRNA levels of several mice genes were used, including Abcg1, which is known for its major role in cholesterol efflux from macrophage foam cells [139], and Abcg5, which forms a heterodimer with Abcg8 to translocate cholesterol and other plant sterols from the canalicular membrane into bile [16, 19, 39].
In addition, recent modeling approaches in our lab concerning prediction of hepatotoxicity endpoints by incorporating transporter interaction profiles follow the multiscale model concept. Apart from the prediction of hepatotoxicity endpoints, these models also aim to investigate the putative link of transporters inhibition with the respective toxicity endpoints. Initially, we used physicochemical descriptors of chemical compounds together with predictions of OATP1B1 and OATP1B3 inhibition [54] to predict hyperbilirubinemia [140]. In total a dataset of 836 compounds (86 positives and 749 negatives) for hyperbilirubinemia was used for training. Combination of MetaCost [141] and SMO (the SVM implementation in the WEKA [142] software package) using 93 interpretable 2D MOE [143] descriptors gave a performance of 68% accuracy and AUC. However, with respect to hyperbilirubinemia-transporter association, we only saw a weak relationship. For sure, more studies are expected in this field, which will allow targeting complex in vivo endpoints on a more sophisticated level than conventional machine learning methods currently allow.
6.23 Outlook
Transmembrane transport proteins represent a considerable fraction of the human genome. Their substrates cover a broad chemical space and range from neurotransmitters via hormones up to a large panel of xenobiotics. Furthermore, they are also strongly involved in ADME and toxicity. One of the organs where a proper transporter homeostasis plays an important role is the liver. Imbalance in the function of the numerous transport proteins expressed in the liver has a big impact in its physiological function and subsequently in human health.
In the past decade, the community has faced a tremendous increase in knowledge on transmembrane transporters, their function, and their ligands. Several high-resolution structures were deposited in the Protein Data Bank, and specialized databases composed of inhibitors and substrates for transport proteins became available. These served in the development of in silico models for predicting transporter ligands. However, coverage is still quite limited and there is a strong need for high-quality data for particular transporters (NTCP, MRPs, MDR3) in order to develop more robust models for transporter inhibition. Furthermore, as generally observed for all target classes, the data available suffer from a “positive data bias,” that is, they are heavily biased toward biologically active compounds. In addition, in most cases, the respective assay conditions are not available in a standardized form, which renders it difficult to compare data retrieved from different assays. Thus, it would be of major importance to have public available data depositories, which allow the deposition of both positive and negative data. These transporter data hubs should also follow the findable accessible, integratable reuse (FAIR) principles of data access [144] and allow data upload in a standardized format, especially with respect to assay conditions.
With respect to in silico toxicity prediction tools, multiscale models and virtual organs might be the near future of toxicity prediction. They are able to capture the necessary information from the molecular interaction with individual targets to the cellular response up to the whole tissue or organ. Of course, this is a complex challenge, but the first success stories for the heart demonstrate the advantage of a more holistic view on organ function and dysfunction. In addition, in this case, high-quality data are the key. They need to be provided on different levels, ranging from molecular interactions up to time/concentration series of solutes. In our opinion, all the tools necessary to pursue such a task for the liver are there already, and it just needs a concerted effort to make it happen.
Finally, following the increasing automation in life sciences, genotyping of patients will become routine soon. This opens up the whole field of single nucleotide polymorphisms (SNPs) and their consequences on response rates to medication. In addition, in the field of transporters, numerous SNPs are known which influence function and ligand recognition. This will add another layer of complexity to holistic prediction tools, but finally will link transporter informatics to precision medicine.
Acknowledgments
We gratefully acknowledge financial support provided by the Austrian Science Fund, Grant F3502 (SFB35 – Transmembrane Transporters in Health and Disease). Additionally, the research leading to these results has received support from the Innovative Medicines Initiative Joint Undertaking under Grant Agreements No. 115002 (eTOX) resources of which are composed of financial contribution from the European Union's Seventh Framework Programme (FP7/2007-2013) and EFPIA companies' in kind contribution.
References
- 1 Faber, K.N., Muller, M., and Jansen, P.L. (2003) Drug transport proteins in the liver. Adv. Drug Deliv. Rev., 55, 107–124.
- 2 Jamei, M., Bajot, F., Neuhoff, S. et al. (2013) A mechanistic framework for in vitro–in vivo extrapolation of liver membrane transporters: prediction of drug-drug interaction between rosuvastatin and cyclosporine. Clin. Pharmacokinet., 53, 73–87.
- 3 Alrefai, W.A. and Gill, R.K. (2007) Bile acid transporters: structure, function, regulation and pathophysiological implications. Pharm. Res., 24, 1803–1823.
- 4 Roma, M.G., Crocenzi, F.A., and Sanchez Pozzi, E.A. (2008) Hepatocellular transport in acquired cholestasis: new insights into functional, regulatory and therapeutic aspects. Clin. Sci. (London), 114, 567–588.
- 5 Mita, S., Suzuki, H., Akita, H. et al. (2006) Inhibition of bile acid transport across Na+/taurocholate cotransporting polypeptide (SLC10A1) and bile salt export pump (ABCB 11)-coexpressing LLC-PK1 cells by cholestasis-inducing drugs. Drug Metab. Dispos., 34, 1575–1581.
- 6 Chang, J.H., Plise, E., Cheong, J. et al. (2013) Evaluating the in vitro inhibition of UGT1A1, OATP1B1, OATP1B3, MRP2, and BSEP in predicting drug-induced hyperbilirubinemia. Mol. Pharm., 10, 3067–3075.
- 7 Campbell, S.D., de Morais, S.M., and Xu, J.J. (2004) Inhibition of human organic anion transporting polypeptide OATP 1B1 as a mechanism of drug-induced hyperbilirubinemia. Chem. Biol. Interact., 150, 179–187.
- 8 Hagenbuch, B. and Stieger, B. (2013) The SLCO (former SLC21) superfamily of transporters. Mol. Aspects Med., 34, 396–412.
- 9 Dhumeaux, D. and Erlinger, S. (2012) Hereditary conjugated hyperbilirubinaemia: 37 years later. J. Hepatol., 58, 388–390.
- 10 Keppler, D. (2014) The roles of MRP2, MRP3, OATP1B1, and OATP1B3 in conjugated hyperbilirubinemia. Drug Metab. Dispos., 42, 561–565.
- 11 Sticova, E. and Jirsa, M. (2013) New insights in bilirubin metabolism and their clinical implications. World J. Gastroenterol., 19, 6398–6407.
- 12 van de Steeg, E., Stranecky, V., Hartmannova, H. et al. (2012) Complete OATP1B1 and OATP1B3 deficiency causes human Rotor syndrome by interrupting conjugated bilirubin reuptake into the liver. J. Clin. Invest., 122, 519–528.
- 13 van de Steeg, E., Wagenaar, E., van der Kruijssen, C.M. et al. (2010) Organic anion transporting polypeptide 1a/1b-knockout mice provide insights into hepatic handling of bilirubin, bile acids, and drugs. J. Clin. Invest., 120, 2942–2952.
- 14 Koepsell, H., Lips, K., and Volk, C. (2007) Polyspecific organic cation transporters: structure, function, physiological roles, and biopharmaceutical implications. Pharm. Res., 24, 1227–1251.
- 15 Soroka, C.J., Ballatori, N., and Boyer, J.L. (2010) Organic solute transporter, OSTalpha-OSTbeta: its role in bile acid transport and cholestasis. Semin. Liver Dis., 30, 178–185.
- 16 Klaassen, C.D. and Aleksunes, L.M. (2010) Xenobiotic, bile acid, and cholesterol transporters: function and regulation. Pharmacol. Rev., 62, 1–96.
- 17 Ros, J.E., Libbrecht, L., Geuken, M. et al. (2003) High expression of MDR1, MRP1, and MRP3 in the hepatic progenitor cell compartment and hepatocytes in severe human liver disease. J. Pathol., 200, 553–560.
- 18 Dawson, S., Stahl, S., Paul, N. et al. (2011) In vitro inhibition of the bile salt export pump correlates with risk of cholestatic drug-induced liver injury in humans. Drug Metab. Dispos., 40, 130–138.
- 19 Chan, J. and Vandeberg, J.L. (2012) Hepatobiliary transport in health and disease. Clin. Lipidol., 7, 189–202.
- 20 Warner, D.J., Chen, H., Cantin, L.D. et al. (2012) Mitigating the inhibition of human bile salt export pump by drugs: opportunities provided by physicochemical property modulation, in silico modeling, and structural modification. Drug Metab. Dispos., 40, 2332–2341.
- 21 Garzel, B., Yang, H., Zhang, L. et al. (2013) The role of bile salt export pump gene repression in drug-induced cholestatic liver toxicity. Drug Metab. Dispos., 42, 318–322.
- 22 Kis, E., Ioja, E., Rajnai, Z. et al. (2012) BSEP inhibition: in vitro screens to assess cholestatic potential of drugs. Toxicol. In Vitro, 26, 1294–1299.
- 23 Ogimura, E., Sekine, S., and Horie, T. (2011) Bile salt export pump inhibitors are associated with bile acid-dependent drug-induced toxicity in sandwich-cultured hepatocytes. Biochem. Biophys. Res. Commun., 416, 313–317.
- 24 Kock, K., Ferslew, B.C., Netterberg, I. et al. (2014) Risk factors for development of cholestatic drug-induced liver injury: inhibition of hepatic basolateral bile acid transporters multidrug resistance-associated proteins 3 and 4. Drug Metab. Dispos., 42, 665–674.
- 25 Templeton, I., Eichenbaum, G., Sane, R., and Zhou, J. (2014) Case study 5. Deconvoluting hyperbilirubinemia: differentiating between hepatotoxicity and reversible inhibition of UGT1A1, MRP2, or OATP1B1 in drug development. Methods Mol. Biol., 1113, 471–483.
- 26 Padda, M.S., Sanchez, M., Akhtar, A.J., and Boyer, J.L. (2011) Drug-induced cholestasis. Hepatology, 53, 1377–1387.
- 27 Huang, L., Smit, J.W., Meijer, D.K., and Vore, M. (2000) Mrp2 is essential for estradiol-17beta(beta-d-glucuronide)-induced cholestasis in rats. Hepatology, 32, 66–72.
- 28 Payen, L., Sparfel, L., Courtois, A. et al. (2002) The drug efflux pump MRP2: regulation of expression in physiopathological situations and by endogenous and exogenous compounds. Cell Biol. Toxicol., 18, 221–233.
- 29 Yang, K., Woodhead, J.L., Watkins, P.B. et al. (2014) Systems pharmacology modeling predicts delayed presentation and species differences in bile acid-mediated troglitazone hepatotoxicity. Clin. Pharmacol. Ther., 96, 589–598.
- 30 Rodrigues, A.D., Lai, Y., Cvijic, M.E. et al. (2013) Drug-induced perturbations of the bile acid pool, cholestasis, and hepatotoxicity: mechanistic considerations beyond the direct inhibition of the bile salt export pump. Drug Metab. Dispos., 42, 566–574.
- 31 Meier, Y., Pauli-Magnus, C., Zanger, U.M. et al. (2006) Interindividual variability of canalicular ATP-binding-cassette (ABC)-transporter expression in human liver. Hepatology, 44, 62–74.
- 32 Park, H.J., Kim, T.H., Kim, S.W. et al. (2016) Functional characterization of ABCB4 mutations found in progressive familial intrahepatic cholestasis type 3. Sci. Rep., 6, 1–926872.
- 33 Sundaram, S.S. and Sokol, R.J. (2007) The multiple facets of ABCB4 (MDR3) deficiency. Curr. Treat Options Gastroenterol., 10, 495–503.
- 34 He, K., Cai, L., Shi, Q. et al. (2015) Inhibition of MDR3 activity in human hepatocytes by drugs associated with liver injury. Chem. Res. Toxicol., 28, 1987–1990.
- 35 Mahdi, Z.M., Synal-Hermanns, U., Yoker, A. et al. (2016) Role of multidrug resistance protein 3 in antifungal-induced cholestasis. Mol. Pharmacol., 90, 23–34.
- 36 Bodo, A., Bakos, E., Szeri, F. et al. (2003) The role of multidrug transporters in drug availability, metabolism and toxicity. Toxicol. Lett., 140–141, 133–143.
- 37 DeGorter, M.K., Xia, C.Q., Yang, J.J., and Kim, R.B. (2012) Drug transporters in drug efficacy and toxicity. Annu. Rev. Pharmacol. Toxicol., 52, 249–273.
- 38 Pauli-Magnus, C. and Meier, P.J. (2006) Hepatobiliary transporters and drug-induced cholestasis. Hepatology, 44, 778–787.
- 39 Stieger, B., Kullak-Ublick, G.A., and DeLeve, L.D. (2013) Chapter 7 – Role of Membrane Transport in Hepatotoxicity and Pathogenesis of Drug-Induced Cholestasis A2, in Drug-Induced Liver Disease, 3rd edn (ed. N. Kaplowitz), Academic Press, Boston, pp. 123–133.
- 40 Tox21, http://tox21.org (accessed Aug 11, 2017).
- 41 Vinken, M., Landesmann, B., Goumenou, M. et al. (2016) AOP27: cholestatic liver injury induced by inhibition of the bile salt export pump (ABCB11).
- 42 Bento, A.P., Gaulton, A., Hersey, A. et al. (2013) The ChEMBL bioactivity database: an update. Nucleic Acids Res., 42, D1083–D1090.
- 43 ChEMBL v.22, DOI: 10.6019/CHEMBL.database.22.
- 44 Wang, Y., Suzek, T., Zhang, J. et al. (2014) PubChem BioAssay: 2014 update. Nucleic Acids Res., 42, D1075–D1082.
- 45 Greene, N., Fisk, L., Naven, R.T. et al. (2010) Developing structure–activity relationships for the prediction of hepatotoxicity. Chem. Res. Toxicol., 23, 1215–1222.
- 46 Fourches, D., Barnes, J.C., Day, N.C. et al. (2010) Cheminformatics analysis of assertions mined from literature that describe drug-induced liver injury in different species. Chem. Res. Toxicol., 23, 171–183.
- 47 Liu, Z., Shi, Q., Ding, D. et al. (2011) Translating clinical findings into knowledge in drug safety evaluation--drug induced liver injury prediction system (DILIps). PLoS Comput. Biol., 7, e1002310.
- 48 Chen, M., Vijay, V., Shi, Q. et al. (2011) FDA-approved drug labeling for the study of drug-induced liver injury. Drug Discov. Today, 16, 697–703.
- 49 Chen, M., Suzuki, A., Thakkar, S. et al. (2016) DILIrank: the largest reference drug list ranked by the risk for developing drug-induced liver injury in humans. Drug Discov. Today, 21, 648–653.
- 50 Zdrazil, B., Pinto, M., Vasanthanathan, P. et al. (2012) Annotating Human P-Glycoprotein Bioassay Data. Mol. Inform., 31, 599–609.
- 51 The Gene Ontology Consortium (2014) Gene Ontology Consortium: going forward. Nucleic Acids Res., 43, D1049–D1056.
- 52 Karlgren, M., Ahlin, G., Bergström, C.A. et al. (2012) In vitro and in silico strategies to identify OATP1B1 inhibitors and predict clinical drug–drug interactions. Pharm. Res., 29, 411–426.
- 53 Karlgren, M., Vildhede, A., Norinder, U. et al. (2012) Classification of inhibitors of hepatic organic anion transporting polypeptides (OATPs): influence of protein expression on drug-drug interactions. J. Med. Chem., 55, 4740–4763.
- 54 Kotsampasakou, E., Brenner, S., Jäger, W., and Ecker, G.F. (2015) Identification of novel inhibitors of organic anion transporting polypeptides 1B1 and 1B3 (OATP1B1 and OATP1B3) using a consensus vote of six classification models. Mol. Pharm., 12, 4395–4404.
- 55 Sedykh, A., Fourches, D., Duan, J. et al. (2013) Human intestinal transporter database: QSAR modeling and virtual profiling of drug uptake, efflux and interactions. Pharm. Res., 30, 996–1007.
- 56 Greupink, R., Nabuurs, S.B., Zarzycka, B. et al. (2012) In silico identification of potential cholestasis-inducing agents via modeling of Na(+)-dependent taurocholate cotransporting polypeptide substrate specificity. Toxicol. Sci., 129, 35–48.
- 57 Ahlin, G., Karlsson, J., Pedersen, J.M. et al. (2008) Structural requirements for drug inhibition of the liver specific human organic cation transport protein 1. J. Med. Chem., 51, 5932–5942.
- 58 Suhre, W.M., Ekins, S., Chang, C. et al. (2005) Molecular determinants of substrate/inhibitor binding to the human and rabbit renal organic cation transporters hOCT2 and rbOCT2. Mol. Pharmacol., 67, 1067–1077.
- 59 Xu, Y., Liu, X., Li, S. et al. (2013) Combinatorial pharmacophore modeling of organic cation transporter 2 (OCT2) inhibitors: insights into multiple inhibitory mechanisms. Mol. Pharm., 10, 4611–4619.
- 60 van Zanden, J.J., Wortelboer, H.M., Bijlsma, S. et al. (2005) Quantitative structure activity relationship studies on the flavonoid mediated inhibition of multidrug resistance proteins 1 and 2. Biochem. Pharmacol., 69, 699–708.
- 61 Tawari, N.R., Bag, S., and Degani, M.S. (2008) Pharmacophore mapping of a series of pyrrolopyrimidines, indolopyrimidines and their congeners as multidrug-resistance-associated protein (MRP1) modulators. J. Mol. Model., 14, 911–921.
- 62 Pajeva, I.K., Globisch, C., and Wiese, M. (2009) Combined pharmacophore modeling, docking, and 3D QSAR studies of ABCB1 and ABCC1 transporter inhibitors. ChemMedChem, 4, 1883–1896.
- 63 Saito, H., Osumi, M., Hirano, H. et al. (2009) Technical pitfalls and improvements for high-speed screening and QSAR analysis to predict inhibitors of the human bile salt export pump (ABCB11/BSEP). AAPS J., 11, 581–589.
- 64 Pedersen, J.M., Matsson, P., Bergstrom, C.A. et al. (2008) Prediction and identification of drug interactions with the human ATP-binding cassette transporter multidrug-resistance associated protein 2 (MRP2; ABCC2). J. Med. Chem., 51, 3275–3287.
- 65 Montanari, F., Pinto, M., Khunweeraphong, N. et al. (2016) Flagging Drugs That Inhibit the Bile Salt Export Pump. Mol. Pharm., 13, 163–171.
- 66 Ng, C., Xiao, Y.D., Lum, B.L., and Han, Y.H. (2005) Quantitative structure–activity relationships of methotrexate and methotrexate analogues transported by the rat multispecific resistance-associated protein 2 (rMrp2). Eur. J. Pharm. Sci., 26, 405–413.
- 67 Zheng, X., Ekins, S., Raufman, J.P., and Polli, J.E. (2009) Computational models for drug inhibition of the human apical sodium-dependent bile acid transporter. Mol. Pharm., 6, 1591–1603.
- 68 Pinto, M., Trauner, M., and Ecker, G.F. (2012) An In Silico Classification Model for Putative ABCC2 Substrates. Mol. Inform., 31, 547–553.
- 69 Broccatelli, F., Carosati, E., Neri, A. et al. (2011) A novel approach for predicting P-glycoprotein (ABCB1) inhibition using molecular interaction fields. J. Med. Chem., 54, 1740–1751.
- 70 Chen, L., Li, Y., Zhao, Q. et al. (2011) ADME evaluation in drug discovery. 10. Predictions of P-glycoprotein inhibitors using recursive partitioning and naive Bayesian classification techniques. Mol. Pharm., 8, 889–900.
- 71 Klepsch, F., Vasanthanathan, P., and Ecker, G.F. (2014) Ligand and structure-based classification models for prediction of P-glycoprotein inhibitors. J. Chem. Inf. Model., 54, 218–229.
- 72 Erić, S., Kalinić, M., Ilić, K., and Zloh, M. (2014) Computational classification models for predicting the interaction of drugs with P-glycoprotein and breast cancer resistance protein. SAR QSAR Environ. Res., 25, 939–966.
- 73 Matsson, P., Englund, G., Ahlin, G. et al. (2007) A global drug inhibition pattern for the human ATP-binding cassette transporter breast cancer resistance protein (ABCG2). J. Pharmacol. Exp. Ther., 323, 19–30.
- 74 Pan, Y., Chothe, P.P., and Swaan, P.W. (2013) Identification of novel breast cancer resistance protein (BCRP) inhibitors by virtual screening. Mol. Pharm., 10, 1236–1248.
- 75 Montanari, F., Cseke, A., Wlcek, K., and Ecker, G.F. (2017) Virtual screening of drugbank reveals two drugs as new BCRP inhibitors. J. Biomol. Screen., 22, 86–93.
- 76 González, P.M., Acharya, C., Mackerell, A.D. Jr., and Polli, J.E. (2009) Inhibition requirements of the human apical sodium-dependent bile acid transporter (hASBT) using aminopiperidine conjugates of glutamyl-bile acids. Pharm. Res., 26, 1665–1678.
- 77 Zheng, X., Pan, Y., Acharya, C. et al. (2010) Structural requirements of the ASBT by 3D-QSAR analysis using aminopyridine conjugates of chenodeoxycholic acid. Bioconjug. Chem., 21, 2038–2048.
- 78 Rais, R., Acharya, C., Mackerell, A.D., and Polli, J.E. (2010) Structural determinants for transport across the intestinal bile acid transporter using C-24 bile acid conjugates. Mol. Pharm., 7, 2240–2254.
- 79 Yang, K., Kock, K., Sedykh, A. et al. (2013) An updated review on drug-induced cholestasis: mechanisms and investigation of physicochemical properties and pharmacokinetic parameters. J. Pharm. Sci., 102, 3037–3057.
- 80 De Bruyn, T., van Westen, G.J., Ijzerman, A.P. et al. (2013) Structure-based identification of OATP1B1/3 inhibitors. Mol. Pharmacol., 83, 1257–1267.
- 81 van de Steeg, E., Venhorst, J., Jansen, H.T. et al. (2015) Generation of Bayesian prediction models for OATP-mediated drug–drug interactions based on inhibition screen of OATP1B1, OATP1B1 *15 and OATP1B3. Eur. J. Pharm. Sci., 70, 29–36.
- 82 Bednarczyk, D., Ekins, S., Wikel, J.H., and Wright, S.H. (2003) Influence of molecular structure on substrate binding to the human organic cation transporter, hOCT1. Mol. Pharmacol., 63, 489–498.
- 83 Moaddel, R., Patel, S., Jozwiak, K. et al. (2005) Enantioselective binding to the human organic cation transporter-1 (hOCT1) determined using an immobilized hOCT1 liquid chromatographic stationary phase. Chirality, 17, 501–506.
- 84 Moaddel, R., Ravichandran, S., Bighi, F. et al. (2007) Pharmacophore modelling of stereoselective binding to the human organic cation transporter (hOCT1). Br. J. Pharmacol., 151, 1305–1314.
- 85 Zolk, O., Solbach, T.F., König, J., and Fromm, M.F. (2009) Structural determinants of inhibitor interaction with the human organic cation transporter OCT2 (SLC22A2). Naunyn Schmiedebergs Arch. Pharmacol., 379, 337–348.
- 86 Kido, Y., Matsson, P., and Giacomini, K.M. (2011) Profiling of a prescription drug library for potential renal drug-drug interactions mediated by the organic cation transporter 2. J. Med. Chem., 54, 4548–4558.
- 87 Chang, C., Ekins, S., Bahadduri, P., and Swaan, P.W. (2006) Pharmacophore-based discovery of ligands for drug transporters. Adv. Drug Deliv. Rev., 58, 1431–1450.
- 88 Akanuma, S., Uchida, Y., Ohtsuki, S. et al. (2011) Molecular-weight-dependent, anionic-substrate-preferential transport of beta-lactam antibiotics via multidrug resistance-associated protein 4. Drug Metab. Pharmacokinet., 26, 602–611.
- 89 Hirano, H., Kurata, A., Onishi, Y. et al. (2006) High-speed screening and QSAR analysis of human ATP-binding cassette transporter ABCB11 (bile salt export pump) to predict drug-induced intrahepatic cholestasis. Mol. Pharm., 3, 252–265.
- 90 Pedersen, J.M., Matsson, P., Bergström, C.A. et al. (2013) Early identification of clinically relevant drug interactions with the human bile salt export pump (BSEP/ABCB11). Toxicol. Sci., 136, 328–343.
- 91 Zhang, H., Xiang, M.L., Zhao, Y.L. et al. (2009) Support vector machine and pharmacophore-based prediction models of multidrug-resistance protein 2 (MRP2) inhibitors. Eur. J. Pharm. Sci., 36, 451–457.
- 92 Chang, C. and Swaan, P.W. (2006) Computational approaches to modeling drug transporters. Eur. J. Pharm. Sci., 27, 411–424.
- 93 Chen, L., Li, Y., Yu, H. et al. (2012) Computational models for predicting substrates or inhibitors of P-glycoprotein. Drug Discov. Today, 17, 343–351.
- 94 Demel, M.A., Kramer, O., Ettmayer, P. et al. (2009) Predicting ligand interactions with ABC transporters in ADME. Chem. Biodivers., 6, 1960–1969.
- 95 Ecker, G.F., Stockner, T., and Chiba, P. (2008) Computational models for prediction of interactions with ABC-transporters. Drug Discov. Today, 13, 311–317.
- 96 Gandhi, Y.A. and Morris, M.E. (2009) Structure–activity relationships and quantitative structure–activity relationships for breast cancer resistance protein (ABCG2). AAPS J., 11, 541–552.
- 97 Montanari, F. and Ecker, G.F. (2015) Prediction of drug–ABC-transporter interaction – recent advances and future challenges. Adv. Drug Deliv. Rev., 86, 17–26.
- 98 Dearden, J.C., Al-Noobi, A., Scott, A.C., and Thomson, S.A. (2003) QSAR studies on P-glycoprotein-regulated multidrug resistance and on its reversal by phenothiazines. SAR QSAR Environ. Res., 14, 447–454.
- 99 Kupsáková, I., Rybár, A., Docolomanský, P. et al. (2004) Reversal of P-glycoprotein mediated vincristine resistance of L1210/VCR cells by analogues of pentoxifylline: a QSAR study. Eur. J. Pharm. Sci., 21, 283–293.
- 100 Osterberg, T. and Norinder, U. (2000) Theoretical calculation and prediction of P-glycoprotein-interacting drugs using MolSurf parametrization and PLS statistics. Eur. J. Pharm. Sci., 10, 295–303.
- 101 Wang, R.B., Kuo, C.L., Lien, L.L., and Lien, E.J. (2003) Structure–activity relationship: analyses of p-glycoprotein substrates and inhibitors. J. Clin. Pharm. Ther., 28, 203–228.
- 102 Wang, Y.H., Li, Y., Yang, S.L., and Yang, L. (2005) An in silico approach for screening flavonoids as P-glycoprotein inhibitors based on a Bayesian-regularized neural network. J. Comput. Aided Mol. Des., 19, 137–147.
- 103 Jabeen, I., Wetwitayaklung, P., Chiba, P. et al. (2013) 2D- and 3D-QSAR studies of a series of benzopyranes and benzopyrano[3,4b][1,4]-oxazines as inhibitors of the multidrug transporter P-glycoprotein. J. Comput. Aided Mol. Des., 27, 161–171.
- 104 Shen, J., Cui, Y., Gu, J. et al. (2014) A genetic algorithm- back propagation artificial neural network model to quantify the affinity of flavonoids toward P-glycoprotein. Comb. Chem. High Throughput Screen., 17, 162–172.
- 105 Sousa, I.J., Ferreira, M.J., Molnar, J., and Fernandes, M.X. (2013) QSAR studies of macrocyclic diterpenes with P-glycoprotein inhibitory activity. Eur. J. Pharm. Sci., 48, 542–553.
- 106 Vázquez, R.N., Camargo, A.B., Marchevsky, E.J., and Luco, J.M. (2014) Molecular factors influencing the affinity of flavonoid compounds on P-glycoprotein efflux transporter. Curr. Comput. Aided Drug Des., 10, 250–258.
- 107 Wu, J., Li, X., Cheng, W. et al. (2009) Quantitative structure activity relationship (QSAR) approach to multiple drug resistance (MDR) modulators based on combined hybrid system. QSAR & Comb. Sci., 28, 969–978.
- 108 Sakiyama, Y. (2009) The use of machine learning and nonlinear statistical tools for ADME prediction. Expert Opin. Drug Metab. Toxicol., 5, 149–169.
- 109 Wang, Y.H., Li, Y., Yang, S.L., and Yang, L. (2005) Classification of substrates and inhibitors of P-glycoprotein using unsupervised machine learning approach. J. Chem. Inf. Model., 45, 750–757.
- 110 Ngo, T.D., Tran, T.D., Le, M.T., and Thai, K.M. (2016) Computational predictive models for P-glycoprotein inhibition of in-house chalcone derivatives and drug-bank compounds. Mol. Divers., 20, 945–961.
- 111 Smith, A.J., van Helvoort, A., van Meer, G. et al. (2000) MDR3 P-glycoprotein, a phosphatidylcholine translocase, transports several cytotoxic drugs and directly interacts with drugs as judged by interference with nucleotide trapping. J. Biol. Chem., 275, 23530–23539.
- 112 Ekins, S. and Bunin, B.A. (2013) The Collaborative Drug Discovery (CDD) database. Methods Mol. Biol., 993, 139–154.
- 113 Montanari, F. and Ecker, G.F. (2014) BCRP inhibition: from data collection to ligand-based modeling. Mol. Inform., 33, 322–331.
- 114 Astorga, B., Ekins, S., Morales, M., and Wright, S.H. (2012) Molecular determinants of ligand selectivity for the human multidrug and toxin extruder proteins MATE1 and MATE2-K. J. Pharmacol. Exp. Ther., 341, 743–755.
- 115 Wittwer, M.B., Zur, A.A., Khuri, N. et al. (2013) Discovery of potent, selective multidrug and toxin extrusion transporter 1 (MATE1, SLC47A1) inhibitors through prescription drug profiling and computational modeling. J. Med. Chem., 56, 781–795.
- 116 Rais, R., Acharya, C., Tririya, G. et al. (2010) Molecular switch controlling the binding of anionic bile acid conjugates to human apical sodium-dependent bile acid transporter. J. Med. Chem., 53, 4749–4760.
- 117 Aller, S.G., Yu, J., Ward, A. et al. (2009) Structure of P-glycoprotein reveals a molecular basis for poly-specific drug binding. Science, 323, 1718–1722.
- 118 Klepsch, F. and Ecker, G.F. (2010) Impact of the recent mouse P-glycoprotein structure for structure-based ligand design. Mol. Inform., 29, 276–286.
- 119 Winter, S.S., Lovato, D.M., Khawaja, H.M. et al. (2008) High-throughput screening for daunorubicin-mediated drug resistance identifies mometasone furoate as a novel ABCB1-reversal agent. J. Biomol. Screen., 13, 185–193.
- 120 Bikadi, Z., Hazai, I., Malik, D. et al. (2011) Predicting P-glycoprotein-mediated drug transport based on support vector machine and three-dimensional crystal structure of P-glycoprotein. PLoS One, 6, e25815.
- 121 Dolghih, E., Bryant, C., Renslo, A.R., and Jacobson, M.P. (2011) Predicting binding to p-glycoprotein by flexible receptor docking. PLoS Comput. Biol., 7, e1002083.
- 122 Friesner, R.A., Murphy, R.B., Repasky, M.P. et al. (2006) Extra precision glide: docking and scoring incorporating a model of hydrophobic enclosure for protein–ligand complexes. J. Med. Chem., 49, 6177–6196.
- 123 Klepsch, F., Chiba, P., and Ecker, G.F. (2011) Exhaustive sampling of docking poses reveals binding hypotheses for propafenone type inhibitors of P-glycoprotein. PLoS Comput. Biol., 7, e1002036.
- 124 Prokes K. (2012) Development of “in silico” models for identification of new ligands acting as pharmacochaperones for P-glycoprotein. University of Vienna.
- 125 Zhang, L., Strong, J.M., Qiu, W. et al. (2006) Scientific perspectives on drug transporters and their role in drug interactions. Mol. Pharm., 3, 62–69.
- 126 FDA (2012) Guidance for industry: drug interaction studies – study design, data analysis, implications for dosing, and labeling recommendations, available at http://www.fda.gov/downloads/Drugs/GuidanceComplianceRegulatoryInformation/Guidances/ucm292362.pdf (accessed September 27, 2017).
- 127 Szakács, G., Varadi, A., Ozvegy-Laczka, C., and Sarkadi, B. (2008) The role of ABC transporters in drug absorption, distribution, metabolism, excretion and toxicity (ADME-Tox). Drug Discov. Today, 13, 379–393.
- 128 Thompson, R.A., Isin, E.M., Li, Y. et al. (2012) In vitro approach to assess the potential for risk of idiosyncratic adverse reactions caused by candidate drugs. Chem. Res. Toxicol., 25, 1616–1632.
- 129 Aleo, M.D., Luo, Y., Swiss, R. et al. (2014) Human drug-induced liver injury severity is highly associated with dual inhibition of liver mitochondrial function and bile salt export pump. Hepatology, 60, 1015–1022.
- 130 Schadt, S., Simon, S., Kustermann, S. et al. (2015) Minimizing DILI risk in drug discovery – a screening tool for drug candidates. Toxicol. In Vitro, 30, 429–437.
- 131 Köck, K., Ferslew, B.C., Netterberg, I. et al. (2014) Risk factors for development of cholestatic drug-induced liver injury: inhibition of hepatic basolateral bile acid transporters multidrug resistance-associated proteins 3 and 4. Drug Metab. Dispos., 42, 665–674.
- 132 Holzhütter, H.G., Drasdo, D., Preusser, T. et al. (2012) The virtual liver: a multidisciplinary, multilevel challenge for systems biology. Wiley Interdiscip. Rev. Syst. Biol. Med., 4, 221–235.
- 133 Ayton, G.S., Noid, W.G., and Voth, G.A. (2007) Multiscale modeling of biomolecular systems: in serial and in parallel. Curr. Opin. Struct. Biol., 17, 192–198.
- 134 Cherry, E. and Fenton, F. The Virtual Heart http://thevirtualheart.org/ (accessed September 28, 2017).
- 135 The Living Heart Project. http://www.3ds.com/products-services/simulia/solutions/life-sciences/the-living-heart-project/ (accessed September 28, 2017).
- 136 Judson, R., Elloumi, F., Setzer, R.W. et al. (2008) A comparison of machine learning algorithms for chemical toxicity classification using a simulated multi-scale data model. BMC Bioinformatics, 9, 1–16241.
- 137 Diaz Ochoa, J.G., Bucher, J., Pery, A.R. et al. (2013) A multi-scale modeling framework for individualized, spatiotemporal prediction of drug effects and toxicological risk. Front. Pharmacol., 3, 1–11204.
- 138 Hijmans, B.S., Tiemann, C.A., Grefhorst, A. et al. (2016) A systems biology approach reveals the physiological origin of hepatic steatosis induced by liver X receptor activation. FASEB J., 29, 1153–1164.
- 139 Yvan-Charvet, L., Wang, N., and Tall, A.R. (2010) Role of HDL, ABCA1, and ABCG1 transporters in cholesterol efflux and immune responses. Arterioscler. Thromb. Vasc. Biol., 30, 139–143.
- 140 Kotsampasakou, E., Escher, S.E., and Ecker, G.F. (2017) Linking transporter interaction profiles to toxicity – the hyperbilirubinemia use case. Eur. J. Pharm. Sci., 100, 9–16.
- 141 Pedro D. (1999) MetaCost: A General Method for Making Classifiers Cost-Sensitive. Proceedings of the fifth ACM SIGKDD international conference on Knowledge discovery and data mining, San Diego, California, USA, ACM.
- 142 Hall, M., Frank, E., Holmes, G. et al. (2009) The WEKA data mining software: an update. SIGKDD Explor. NewsL., 11, 10–18.
- 143 Molecular Operating Environment (MOE) (2015) 1010 Sherbooke St. West, Suite #910, Montreal, QC, Canada, H3A 2R7, Chemical Computing Group Inc.
- 144 Wilkinson, M.D., Dumontier, M., Aalbersberg, I.J. et al. (2016) The FAIR Guiding Principles for scientific data management and stewardship. Sci. Data, 3, 1–9160018.
- 145 Warner, D.J., Chen, H., Cantin, L.D. et al. (2012) Mitigating the inhibition of human bile salt export pump by drugs: opportunities provided by physicochemical property modulation, in silico modelling, and structural modification. Drug Metab. Dispos., 40, 2332–2341.