
Chapter 12
HLA-Mediated Adverse Drug Reactions: Challenges and Opportunities for Predictive Molecular Modeling
George van Den Driessche and Denis Fourches
Department of Chemistry, Bioinformatics Research Center, North Carolina State University, Raleigh, NC, USA
Chapter Menu
12.1 Introduction
Adverse Drug Reactions (ADRs) are mild-to-serious undesired effects a patient can undergo after taking a particular medication. ADRs can even be life threatening for certain subpopulations of patients. Overall, ADRs present a major financial burden to the US healthcare system [1]. One important challenge for accurately monitoring both the occurrences and financial burdens associated with ADRs is mainly the lack of a cohesive definition used to track such events [2]. According to the FDA Adverse Event Reporting System (FAERS), there were over 1.2 million adverse events reported in 2014 compared to only 400,000 cases in 2006 [3]. For all the aforementioned reasons, there is a strong need to develop computational models that could accurately predict a drug's likelihood of causing ADR. In fact, models reliably predicting such ADR for a subpopulation of patients are especially in high demand for future precision medicine protocols.
There are two main different types of ADRs referred to as Type I and Type II [4, 5]. Type I ADRs are predictable pharmacological events induced by a drug, while Type II ADRs are idiosyncratic events. Predictable ADRs occur owing to off-target binding events resulting from the drug's polypharmacology. A drug's metabolism may also be the source of ADRs often subcategorized into pharmacokinetic and pharmacodynamics [6]. Pharmacokinetic drug properties are identified by studying the drug metabolism from absorption to excretion and identifying when the drug response actually occurs [6]. Pharmacodynamics ADRs are less studied and require a greater understanding of drug interactions with ion channels, protein receptors, enzymes, and nucleic acids for clearly understanding how the drug response is triggered [6].
Idiosyncratic ADRs (iADR) are extremely difficult to predict. They mostly occur when a drug triggers an undesired immune system response and may actually result from a drug's pharmacodynamic properties [4–6]. The major biological pathway sought to trigger iADRs is the interactions of drugs with the human leukocyte antigen (HLA) proteins. To date, the most well-known example of such a type of HLA-drug interaction is that of abacavir (ABA) with the HLA-B*57:01 variant. Abacavir is used in the treatment of HIV; if treated patients express the HLA-B*57:01 variant, they are likely to experience the abacavir hypersensitivity syndrome (AHS).
In this chapter, we recapitulate the relationships between HLA variants and drug associations resulting in ADRs. First, we explore the diversity of HLA proteins, their expression pathways, and highlight the structural differences of Class I versus Class II HLAs. Next, we discuss a few examples of known HLA-drug complexes and highlight some specific research efforts on identifying HLA-drug associations via population-wide studies and odds ratios (OR) followed by a brief summary of the HLA-drug binding mechanisms. Finally, we describe how structure-based molecular docking could be employed to screen for HLA-active drugs and the clear limitations associated with molecular docking. To conclude, we present perspectives for HLA-mediated ADR events.
12.2 Human Leukocyte Antigens
12.2.1 HLA Proteins
In humans, the major histocompatibility complex (MHC) is encoded by the HLA, which is responsible for determining cell similarity and signaling to T-cells for immune system activation against pathogens. HLA proteins can be categorized into two classes: Class I and Class II. To date, the IMGT/HLA database (accessible at www.ebi.ac.uk/ipd/imgt/hla/) has over 15,000 HLA allele sequences with 11,000 Class I alleles and about 4,000 Class II alleles [7]. In general, Class I and Class II HLA perform the same function by presenting peptides to T-cells for immune system activation [8]. However, beyond their functions, the two classes of proteins become quite distinct. One major distinction is that Class I HLA presents a peptide to CD8+ T-cells; whereas Class II HLA presents a peptide to CD4+ T-cells [8]. Another major difference between the two classes occurs due to the source of peptide. The normal peptide source for Class I HLA occurs from an endogenous antigen, while the normal peptide source for Class II HLA comes from an exogenous antigen [9]. However, under particular conditions these peptide sources can be reversed. In the case of cross-presentation, Class I HLA will present an exogenous peptide [10] and when autophagy protein degradation occurs, Class II HLA can present an endogenous peptide [11]. There are also notable differences in the structures of Class I and Class II HLA which are presented in Figure 12.1.

Figure 12.1 Structure of HLA-variants Class I and Class II.
Even though T-cell signaling occurs at the cell surface, the formation of Class I HLA occurs inside the cell in the endoplasmic reticulum (ER) [8]. The Class I heterodimer is assembled in the ER consisting of a 270 amino acid residue peptide binding domain and a 90–100 amino acid residue β2-microglobulin light chain. Interestingly, it is not stable until after an 8–10 amino acid residue endogenous peptide is translocated into the ER to stabilize the HLA protein [8, 12]. The C- and N-termini of the peptide form H-bonds that anchor the peptide in the Class I pocket [8, 12]. After the HLA-peptide complex is formed, it is released from the ER and presented at the cell surface [9]. A more detailed exploration of the pathway can be found in the excellent review of MHC Class I and II pathways by Neefjes et al. [8].
The peptide binding domain of Class I HLA can be subdivided into three 90-residue α-domains. Two of these α-domains (α1 and α2) are directly involved in stabilizing the co-binding peptide between two α-helical walls connected by a β-pleated floor [12]. Once Class I HLA is presented at the cell surface, the third α-domain (α3) and the β2-microglobulin chain provide anchoring sites to the cell surface [12]. Interestingly, even though there are over 11,000 Class I alleles, the overall protein structure is highly conserved [7]. A schematic of the structure for Class I HLA variants is provided in Figure 12.1.
Class II HLAs share a lot of similarities with Class I HLAs such as the polymorphism, three-dimensional structures, genetic location, and function [8, 12]. However, there are several notable differences between the two classes beginning with the fact that there are significantly fewer known sequences of Class II HLA compared to Class I (4,000 known Class II alleles) [7]. Two other major differences concern the tissue distribution and the antigenic peptides between the Classes. Class I HLA is ubiquitously expressed in most cells, whereas Class II HLA is expressed in specific cells (APCs, DCs, macrophages, and B-cells) [8]. As discussed earlier, Class I antigenic peptides are 8–10 residues in length, while Class II antigenic peptides can be 12–24 residues in length [8, 12].
Antigenic peptide presentation in Class II HLA begins in the ER by the formation of an α- and a β-heterodimer that are then stabilized by an invariant chain (Ii) [8]. Then the Ii-Class II HLA is transported from the ER to the MHC Class II Compartment (MIIC) where the Ii chain is digested to form a residual Class II-associated Ii peptide (CLIP) [8]. This CLIP peptide is typically 83–107 residues in length [13]. Finally, the CLIP peptide is replaced by a 12–24 mer antigenic peptide degraded from proteins in the endocytic pathway [14], before the Class II HLA protein is translocated from the MIIC to the cell surface. Again, a more thorough analysis can be found in the very detailed review by Neefjes et al. [8].
Structurally, Class II HLA consists of an α and a β heterodimer, with each section containing 90–100 residues [12]. Each of these regions can then be subdivided into two subdomains that are membrane-distal (α1 and β1) and membrane-proximal (α2 and β2). The membrane-distal region is where peptide binding occurs, while the membrane-proximal region holds Class II HLA to the cell surface. Comparing the structure of Class II with Class I, it becomes apparent that the α1 and β2 subdomains of Class II correspond to the peptide binding pocket α1 and α2 subdomains of Class I. As such, the membrane-distal region of Class II is composed of two alpha helical walls with β-pleated strands forming the peptide binding pocket floor. However, instead of antigenic peptides non-covalently binding in anchor fashion (as in Class I), Class II peptides undergo H-bonds between the pocket and center of the peptide which allows the C- and N-termini to hang past the edges of the peptide pocket (allowing for longer peptides to bind Class II HLA) [8, 12]. Continuing the comparison between Class I and Class II, it is known that the α3 and β2-m subdomains of Class I correspond to the membrane-proximal subdomains of Class II (α2 and β2). An overview of the structure of Class I and II HLA alleles is provided in Figure 12.1.
12.2.2 ADR–HLA Associations
Idiosyncratic ADRs can occur anytime a drug binds with an HLA variant and activates either CD4+ or CD8+ T-cells. Upon T-cell activation a patient can suffer from a multitude of ADRs such as drug-induced liver injury (DILI), Stevens-Johnson syndrome/toxic epidermal necrolysis (SJS/TEN), hypersensitivity, drug reaction with eosinophilia and systemic symptoms (DRESS), malignant pleural effusion (MPE), or agranulocytosis/granulocytosis to name the most well-known examples. Table 12.1 provides examples of drugs and their reported OR for a particular HLA-variant; interestingly, some drugs, such as carbamazepine, are listed as being active at multiple variants [18–20]. The OR is a population-based statistical measure that assesses the likelihood of an exposure (drug-HLA variant interaction) to cause a particular outcome (ADR event occurs) [31]. This measurement is obtained using the following equation:

Table 12.1 List of drug-HLA associations with their reported odds ratios
| Drug | Indication | ADR | HLA variant | OR | References |
| Abacavir | HIV | AHS | B*57:01 | >900 | Martin et al. [15]; Chung et al. [16] |
| Allopurinol | Hyperuricemia | SJS/TEN | B*58:01 | 580 | Hung et al. [17] |
| DRESS | |||||
| Atorvastatin | High cholesterol | N/A | DRB1*10:10 | N/A | a |
| Carbamazepine | Anticonvulsant | SJS/TEN | B*15:02 | 895 | Chung et al. [18] |
| Epilepsy | B*15:11 | 31 | Shi et al. [19] | ||
| Bipolar | A*31:01 | 33 | Ozeki et al. [20] | ||
| Disorder | DRESS | 12 | |||
| Ciprofloxacin | Antibiotic | Gastrointestinal irritation | B*50:02 | N/A | a |
| Clindamycin | Antibiotic | Delayed maculopapular exantherma | B*15:27 | 55 | Yang et al. [21] |
| B*51:01 | 9 | ||||
| C*14:02 | 6 | ||||
| SJS/TEN | C*15:02 | 6 | |||
| Clozapine | Schizophrenia | Agranulocytosis/granulocytosis | B(158T) | 3.3 | Goldstein et al. [22] |
| DQB1 | 15.6 | Legge et al. [23] | |||
| Dapsone | Antibiotic | DRESS | B*13:01 | 20 | Tohyama et al. [24] |
| Fenofibrate | High cholesterol | AGEP | A*33:01 | N/A | a |
| Flucloxacillin | Antibiotic | DILI | B*57:01 | 80 | Daly et al. [25] |
| Lamotrigine | Anticonvulsant | SJS/TEN | B*15:02 | 3 | Che ung et al. [26] |
| Methazolamide | Glaucoma | SJS/TEN | B*59:01 | 1974 | Yang et al. [27] |
| Methyldopa | Antihypertensive | N/A | A*33:01 | N/A | a |
| Minocycline | Antimicrobial | Thyroid hyperplasia | B*35:02 | N/A | a |
| Nevirapine | HIV | DRESS/MPE | B*35:05 | 19 | Chantarangsu et al. [28] |
| Oxacarbazepine | Anticonvulsant | SJS/TEN | B*15:02 | 80 | Hung et al. 2010 |
| Pazopanib | Anticancer | DILI | B*57:01 | N/A | Xu et al. [29] |
| Phenytoin | Anticonvulsant | SJS/TEN | B*15:02 | 33 | Hung et al. 2010 |
| Epilepsy | |||||
| Seizures | |||||
| Sertraline | PTSD/OCD | Serotonin syndrome | A*33:01 | N/A | a |
| Drug | Indication | ADR | HLA | OR | References |
| Simvastatin | High cholesterol | Myalgia Arthralgia | B*13:02 | N/A | a |
| Ticlopidne | Thrombotic stroke | Agranulocytosis | A*33:01 | 36 | Hirata et al. [30] |
a Putative data, unpublished.
There are three possible outcomes in Equation 12.1; first, OR = 1 in which case it can be concluded that exposure does not affect the odds of the outcome [31]. Second, if OR > 1, then the exposure is associated with a higher odds of the outcome, and finally, if OR < 1, then the exposure is associated with a lower odds of the outcome [31]. The recently built HLADR database compiles all the known drug-HLA associations with their respective ORs [32].
Let us take a real world example using ORs to determine a potential drug-HLA relationship. Clindamycin is an antibiotic that causes either delayed maculopapular exantherma or SJS/TEN in patients expressing the HLA-B*51:01 variant [21]. However, Yang et al. found that there were three other variants that had OR greater than one, indicating that the HLA variants B*15:27 (OR: 55), B*51:01 (OR: 24), C*14:02 (OR: 9), and C*15:02 (OR:19) could all be binding clindamycin to trigger an ADR event [21]. These results raise several questions: Do all of these alleles result in ADR events? Are drug-HLA interactions more favorable for a particular variant compared to the others? Will drug-HLA binding be strong enough to induce the ADR? Clearly the limitations of using OR to diagnose drug-mediated ADR events have been reached and alternative techniques are needed to analyze and elucidate drug-HLA complexes. In this particular case, Yang et al. attempted to perform a molecular docking study using a HLA-B*51:01 crystal (PDB:1E27) and homology models for HLA-B*15:27 (PDB Template:1XR8), HLA-C*14:02, and -C*15:02 (PDB Template: 1EFX) to determine which drug-HLA combination was most likely [21]. From their docking results, Yang et al. concluded that HLA-B*51:01 was most likely responsible for inducing ADR (GLIDE docking score DSXP = −10.1 kcal/mol) [21]. Unfortunately, the docking results reported by Yang et al. indicated that docking at all four variants was actually possible and predicted as favorable (all docking scores < −7 kcal/mol) [21]. Additionally, the authors did not mention how the co-binding peptide was analyzed or taken into account in their docking procedure despite the fact that the peptide has a significant role in HLA stability [8, 12]. The role of the co-binding peptide with HLA-B*57:01 and abacavir will be discussed in greater detail in Section 12.3.2.
Another well-studied example is the drug carbamazepine. Carbamazepine is used to treat epilepsy and bipolar disorder, but in patients who have one of the following HLA-variants, SJS/TEN may occur: HLA-B*15:02 (OR: 895), HLA-B*15:11 (OR: 31), or HLA-A*31:01 (OR:33) [18–20]. In 2012, Wei et al. confirmed carbamazepine's affinity for HLA-B*15:02 through the use of T-cell proliferation and cytotoxic assays in addition to a HLA-B*15:02 peptide-specific assay [33]. Interestingly, the assay results also indicated that HLA-B*15:08, -B*15:11, and B*15:21 would have some binding affinity with carbamazepine [33]. Furthermore, based on the basis of their site-directed mutagenesis work and homology model (using HLA-B*15:01 as a template, PDB: 1XP8), Wei et al. were able to identify ARG62 and GLU63 as two critical amino acids for carbamazepine binding [33].
Using this previous work, two interesting studies have recently emerged. First, Schotland et al. used molecular analysis of side effects (MASE) to data-mine the FAERS database for drug-HLA associations for SJS/TEN and found that patients taking acetominophen (APAP) and carbamazepine showed a reduced chance of SJS/TEN [34]. Using the homology model developed by Wei et al. [33], Schotland et al. tested the binding affinities of carbamazepine and APAP and found that APAP had a higher binding affinity with HLA-B*15:02 [34]. The second study used the same homology model, but now involved performing molecular dynamic (MD) simulations to further understand the T-cell signaling pathway [35]. Zhou et al. [35] have proposed an interesting signaling pathway that is highlighted in Section 12.2.3.
Thus far, only interactions between Class I HLA and drugs have been discussed. It is important to remember that drug-HLA interactions are also observed with Class II HLA. Clozapine is used for the treatment of schizophrenia, but in certain cases may result in agranulocytosis or granuloctopenia. In 2007, Dettling et al. reported significant OR values for clozapine with HLA-B*57 (OR:22) and HLA-DRB5*02:01 (OR: 22) [36] Then in 2014, Goldstein et al. reported a possible connection for clozapine binding with HLA-B*57:01 or HLA-DQB1*05:02 variants [22]. Most recently, Legge et al. confirmed clozapine's HLA-dependence with HLA-DQB1*05:02 with a reported OR of 15 [23]. Remarkably, these reports indicate that clozapine may bind with either Class I or Class II HLA [22, 23, 36].
The use of ORs provides evidence for a correlation between an ADR event and specific HLA variant(s), but it does not imply a significant binding affinity between a particular drug and HLA-variant. In some instances, (as with carbamazepine) binding assays are available to confirm drug-HLA associations, but even in vitro assays are limited in their ability to elucidate information about specific drug and HLA binding pocket interactions. The best method to visualize HLA-drug binding interactions is through the use of NMR or X-ray crystallography.
The association between abacavir and HLA-B*57:01 is the best understood one, notably owing to the availability of three X-ray crystals identified in 2012 by Illing et al. (PDB: 3VRI and 3VRJ) [37] and Ostrov et al. (PDB: 3UPR) [38]. These three crystals not only confirmed the HLA-drug complex previously reported has OR values (greater than 900) [15, 39] but also provided accurate starting structures for molecular docking and dynamics [40–42]. Recently, Metushi et al. conducted a virtual screening of the ZINC database to identify potential HLA-B*57:01-active compounds with a high similarity to abacavir [41]. After performing a 2D/3D similarity search, they next used a combination of pharmacophore and molecular docking (using PDB: 3UPR from their previous work) to identify several chemicals for an HLA-binding assay and a peptide-elution assay [38, 41]. Using this protocol, Metushi et al. identified acyclovir as a potential HLA-B*57:01-active compound and subjected it to a CD8+ T-cell response assay [41, 43]. Using the T-cell response assay, they were able to confirm that acyclovir does not mediate a T-cell response (as expected, this is due to historical lack of ADRs associated with acyclovir) [44–46].
Interestingly, in each of the HLA-drug interaction examples discussed above, molecular docking was used as the main cheminformatics tool to explore the binding modes of drugs in the HLA pocket [21, 22, 33–35, 40–42]. Best practices and limitations when performing molecular docking are discussed in Section 12.3.1. This is followed by an in-depth analysis of our own work in developing a virtual screening protocol at the HLA-B*57:01 variant using molecular docking, in Section 12.3.2 [42].
12.2.3 HLA-Drug-Peptide Proposed T-Cell Signaling Mechanisms
In order for a drug to cause an adverse event, it must signal to T-cells (CD8+ for Class I and CD4+ for Class II) after forming an HLA-drug-peptide complex. Currently, there are three proposed mechanisms for HLA-T-cell signaling: altered repertoire, pharmacological interaction (p. i.) complex, and the hapten complex [4, 47]. An adaptation of these signaling modes from Illing et al. [48] is provided in Figure 12.2. The altered repertoire signaling mechanism occurs when a drug non-covalently binds in the peptide pocket beneath the peptide as shown in Figure 12.2a. A p. i. complex is based on non-covalent interactions, but forms with the peptide surface outside of the binding pocket as shown in Figure 12.2b. The hapten complex is the only occurrence where the drug is covalently bonded to the peptide and can occur either inside or outside the binding pocket as shown in Figure 12.2c. Interestingly, the altered repertoire and hapten complex can both form either at the cell surface or in the ER during HLA formation, whereas the p. i. complex forms solely on the cell surface [4, 47, 48].

Figure 12.2 HLA-drug binding mechanism adapted from Illing et al. [48] for T-cell activation (a) Altered repertoire (non-covalent). (B) p. i. complex (non-covalent). (C) Hapten complex (non-covalent). The non-covalent T-cell interaction is not shown.
These three signaling mechanisms have been suggested (and/or observed) for abacavir, carbamazepine, and flucloxacillin [35, 37, 38, 48, 49]. To date, the only structurally verified signaling mode is for HLA-B*57:01-abacavir-peptide in an altered repertoire complex (PDB: 3VRI, 3VRJ, 3UPR) [37, 38]. Carbamazepine is believed to form a p. i. complex with HLA-B*15:02-peptide-carbamazepine [48], but recent MD simulations by Zhou et al. [35] suggests that carbamazepine may non-covalently bind to a CD8+ cell before non-covalently binding to the peptide surface as shown in Figure 12.3. Without an NMR or crystal structure, it will be difficult to confirm this supposed mechanism. Flucloxacillin is believed to form a hapten complex due to the nature of β-lactams and their ability to form covalent bonds with lysine residues [48–50]. Without NMR structure or crystals of HLA-drug complexes, the use of molecular docking and molecular dynamics offers an opportunity to identify drugs that favor altered repertoire or p. i. complexes with HLA. Unfortunately, molecular docking and dynamics will be unable to identify hapten complexes owing to their use of classical force fields; a quantum mechanical technique would be needed to identify these types of complexes due to the formation of a covalent bond.

Figure 12.3 Alternative p. i. complex CD8+ T-cell signaling pathway for carbamazepine binding with HLA-B*15:02.
Source: Adapted from Zhou et al. (2016) [35]
12.3 Structure-Based Molecular Docking to Study HLA-Mediated ADRs
Owing to the serious health implications of ADRs, the ability to predict whether a drug can bind with HLA and induce an immune system response is extremely important. However, solely relying on experimental assays to identify all possible drug-HLA relationships is perhaps not the best strategy. Currently, there are over 15,000 HLA-variants listed in the IMGT/HLA database [7]. If an assay were developed for every single variant and an experimental screening of DrugBank were performed (currently experiments performed. The screening of larger libraries such as ZINC database (over 15 million compounds) would simply become infeasible. That number does not even account for experimental errors and replicates in the different assays. Clearly, brute-force experimental screening for HLA-drug interactions is hardly possible if many variants and a large library of compounds are considered.
Meanwhile, in silico virtual screening offers a comparatively quick alternative for identifying potentially HLA–active drug compounds. The use of similarity searching, pharmacophore, quantitative structure-activity relationships (QSAR), and molecular docking could all provide valuable insight into the identification of HLA-active compounds. However, owing to very limited structural information about HLA-drug binding affinities (Ki), statistical techniques such as QSAR modeling cannot be conducted at this time. In contrast, molecular docking represents the most appropriate cheminformatics technique to perform a virtual screening tool for HLA owing to the availability of crystal structures (e.g., three structures for HLA-B*57:01-abacavir crystal structures 3VRI, 3VRJ, 3UPR) and the possibility to build additional homology models for the other variants.
12.3.1 Structure-Based Docking
Molecular docking consists of virtually inserting a ligand into the binding pocket of a target (e.g., protein) and then scoring the actual molecular interactions between the ligand and protein according to the binding mode of the ligand and a scoring function. Docking scores can be used to rank a set of ligands on the basis of their predicted binding affinities toward the target, and thus help identifying and prioritizing those ligand(s) with the most interesting interactions with the target. A classical docking procedure can be performed in three ways: rigid ligand-rigid protein, flexible ligand-rigid protein, and flexible ligand-flexible protein. Rigid-rigid docking is considered to be the least accurate and is only used for screening extremely large databases as a first and rapid initial step. Flexible-rigid docking is the most commonly used technique and is generally considered to produce reliable binding modes and binding affinities between ligands and proteins. In theory, the best approach would be to use fully flexible-flexible docking as this would account for induced conformational changes in proteins upon ligand binding, but this technique is still rarely usedowing to the large computational cost. The rapid development of ensemble docking (i.e., docking flexible ligands in many conformations of the protein) and GPU-accelerated molecular dynamics will accelerate the transition to flexible-flexible docking.
When performing flexible-rigid molecular docking, the starting structure for the protein comes from an experimentally validated 3D structure (X-ray or NMR). Using this known structure, two approaches can be used: (i) docking is performed directly on that structure or (ii) docking is performed by developing a homology model built from this initial 3D structure. In the case of homology modeling, the residue sequence for a protein is known (for example HLA-B*15:02) but the 3D structure is unknown. However, there may be an NMR or crystal structure available of a closely related allele (such as HLA-B*15:01). Using the 3D structure of this closely related variant as a template, a theoretical homology structure can be built. This technique was used in the study of HLA-B*15:02 with carbamazepine [33–35]. Homology modeling is usually followed by several cycles of full-atom molecular dynamics to optimize the overall geometry of the protein before conducting molecular docking.
In some instances, the actual binding mode of a drug with a given protein is directly known from NMR or X-ray crystallography. If this is the case, as with HLA-B*57:01 and abacavir, then molecular docking may be performed directly on that structure after in-depth preprocessing steps have been completed. First, unessential counter ions and waters are removed (the ones in the binding site can be preserved if necessary) and explicit hydrogens are added. Then, missing side chains are identified and corrected. Protonation states and H-bonding are optimized. The overall structure is minimized [51–55]. In our group, we are notably relying on the Protein Preparation Wizard available in the Schrödinger Suite (www.schrodinger.com). Protein Preparation Wizard affords the easy removal of waters, salts, and H-bond optimization [51], while utilizing PRIME to generate missing side chains [52, 53] and protonation states are generated using EPIK at physiological pH of 7 [54, 55]. Finally, protein minimization is performed using the OPLS3 force field [56–60].
After the protein structure has properly been curated, it is important to perform self-docking (sometimes referred to as “native docking”) of the parent ligand from the original crystal. Self-docking is a critical step to verify whether the docking software can accurately retrieve the native binding mode of the ligand. After successful completion of self-docking, the curated and prepared compounds of interest can be docked. Chemical curation is an important step to ensure the correctness of chemical structures to be docked [61, 62]. The curated set of ligands should then be optimized (either with classical- or quantum mechanics) in addition to generating active tautomerized states at physiological pH. Our group performs ligand preparation using LigPrep available in the Schrödinger suite which generates tautomeric states with EPIK [54, 55] and minimizes conformers using the OPLS3 force field [56–60].
With the properly curated and preprocessed ligand database, molecular docking can be performed. There are numerous docking software available: Autodock Vina [63], GOLD [64], FLEXX [65], and GLIDE [66–69]. Our group relies on Schrodinger's GLIDE for docking owing to the availability of multiple scoring functions, HVSP, SP, XP, and SP-PEP [66–69], as well as the overall prediction performances of the software [67]. Briefly, GLIDE operates by docking in three main steps: (i) performs initial screening of ligand conformers in the active site of the receptor, (ii) minimizes the energy according to a force field (e.g., OPLS3), and (iii) scores the molecular interactions to assess the estimated free energy of binding of the ligand [66]. The GLIDE DS estimates the free energy of binding of a ligand in the binding pocket and is formally the sum of the Glide score and the EPIK state penalty occurred from generating ligand tautomers [51, 66]. The eModel (eM) score is the sum of the Glide score, ligand-receptor interaction energy, and the ligand strain energy [66]. When studying HLA, we used two empirical thresholds to identify HLA-active compounds. A drug was considered HLA binder or “active” when it was found to afford a DS below −7 kcal/mol and an eM score below −50 kcal/mol.
Recently, we developed a virtual screening molecular docking procedure for the HLA-B*57:01 variant using three crystals of HLA-bound abacavir (PDB: 3VRI, 3VRJ, 3UPR) [42]. Interestingly, each structure had a different co-binding peptide which allowed us to explore the importance of that peptide in HLA-drug binding. In this work, we did not use ensemble docking as we wanted to develop a fast virtual screening procedure targeting the HLA-B*57:01 variant and the fact that abacavir is found in an altered repertoire complex led us to hypothesize that there is little variation in the protein structure.
12.3.2 Case Study: Abacavir with B*57:01
Recently, we developed and tested a virtual screening protocol for identifying HLA-B*57:01-active drugs using flexible-ligand and rigid-protein molecular docking [42]. The HLA-B*57:01 variant was selected owing to the availability of three X-ray crystals consisting of HLA-B*57:01-abacavir and a co-binding peptide in an altered repertoire complex (PDB: 3VRI, 3VRJ, 3UPR) [37, 38]. Owing to the availability of these three crystals with a confirmed drug-binding mechanism and known HLA-B*57:01-drug associations resulting in ADR events (AHS and DILI), we decided to use these structures as a starting point for developing a virtual screening protocol. A schematic of our protocol is provided in Figure 12.4.

Figure 12.4 Schematic for using molecular docking to perform virtual screening at HLA-B*57:01 variant.
As described in Section 12.3.1, we started by curating the three protein structures using the Protein Preparation Wizard available in the Schrodinger Suite [51–55]. Once the three proteins were preprocessed, we conducted a protein alignment to identify the differences between the three binding pockets, the three units of abacavir, and the three co-binding peptides. The protein pocket was found to be in the same conformation for all three crystals with measured root mean square Deviations (RMSDs) less than 0.6 Å and overlay similarities greater than 75% [42]. Furthermore, we found that aside from ring puckering in abacavir's cyclopropyl group or orientation of the hydroxyl functional group, the structure of abacavir in the pocket was universal among all three crystals [42]. The largest variation between crystals was in the co-binding peptide as each peptide had a unique amino acid sequence for 3VRI (P1: RVAQLEQVYI), 3VRJ (P2: LTTKLTNTNI), and 3UPR (P3: HSITYLLPV) [42]. Interestingly, when a peptide backbone alignment was performed, it was found that the backbone of each peptide was in a similar orientation with a measured RMSD of less than 1.8 Å [42]. On the basis of alignment results, we moved forward with the self-docking abacavir.
In a molecular docking experiment with a known binding mode between a protein and a drug, self-docking is an essential step in validating the ability of molecular docking to retrieve that particular binding mode with very high accuracy. In the case of HLA, self-docking is even more important owing to the presence of a co-binding peptide. When a flexible-ligand/rigid-receptor protocol is used, GLIDE fixes the entire protein in place. Importantly, in the case of HLA complexes, this includes the co-binding peptide. As such, we conducted docking in the absence and presence of the co-binding peptide using the SP and XP scoring functions of GLIDE [66–68] in order to understand the specific role of the peptide in docking [42]. These results are provided in Figure 12.5. The SP and XP scoring functions were both able to reliably reproduce the native binding pose of abacavir in the absence and presence of peptide P1 with measured RMSD of 1.21-1.28 Å provided in Figure 12.5a [42]. Interestingly, the differences between structures occurred as a result of ring strain in the cyclopropyl moiety and the hydroxyl functional group.

Figure 12.5 (a) Self-docking of abacavir alignment, (b) binding modes of abacavir, (c), (d) docking results.
Source: Van Den Driessche and Fourches (2016) [42]. https://jcheminf.springeropen.com/articles/10.1186/s13321-017-0202-6. Licenced under CC BY 4.0.
The observed protein-drug interactions between HLA-B*57:01 and abacavir were identical between the native crystal and the docking-generated binding modes except with respect to the hydroxyl group [42]. Strangely, the hydroxyl group was found to participate in the H-bond with three different amino acid residues as shown in Figure 12.5b [42]. Native abacavir from 3VRI has H-bonding between the hydroxyl group and the TYR74 residue, while SP docking without peptide found the hydroxyl group to H-bond with the TYR99 residue, and SP docking with peptide found that the hydroxyl group H-bonds with carbonyl backbone of ALA3 from P1 (Figure 12.5b) [42]. Owing to the proximity of TYR74, TYR99, and ALA3, it is possible that in a dynamic system, the hydroxyl group actually rotates and H-bonds with all three residues. In order to validate this hypothesis, molecular dynamic simulations still need to be performed. We also explored the role of the co-binding peptide in stabilizing the HLA-B*57:01-drug complex. It was observed that all three peptides (P1, P2, and P3) lowered the DS by 1–2 kcal/mol (Figure 12.5c) and that the eM score was lowered by 12-17 kcal/mol (Figure 12.5d) [42].

Figure 12.6 Chemical structures of the 14 drugs used to construct a virtual screening molecular docking model.
Source: Van Den Driessche and Fourches (2016) [42]. https://jcheminf.springeropen.com/articles/10.1186/s13321-017-0202-6. Licenced under CC BY 4.0.
Next, a small test set of 14 drugs and abacavir were docked at 3VRI, 3VRJ, and 3UPR in the absence and presence of peptides P1, P2, and P3, respectively [42]. The test set consisted of abacavir, allopurinol, atorvastatin, carbamazepine, ciprofloxacin, clozapine, fenofibrate, flucloxacillin, methyldopa, minocycline, pazopanib, sertraline, simvastatin, and ticlopidine [42]. Associated ADRs and indications of these drugs can be found in Table 12.1, while the structures are provided in Figure 12.6. The test set of compounds were docked using both SP and XP scoring functions using protein structures from 3VRI, 3VRJ, and 3UPR in both the absence and presence of peptides P1, P2, and P3 [42]. Heat maps of the DS and eM scores are provided in Figures 12.7 and 12.8, respectively, where green boxes indicate the lowest measured DS or eM score (most favorable), red boxes indicate the highest measured DS or eM score (least favorable), and white boxes indicate that no favorable binding pose between drug and HLA-B*57:01 were obtained.

Figure 12.7 Heat map of DS for full set. Green spaces represent the most favorable docking scores (DS < −7 kcal/mol), while spaces transition from orange to red represent drugs that have nonfavorable interactions with HLA-B*57:01 (DS > −7 kcal/mol). White spaces indicate that GLIDE was unable to identify a best binding mode between drug and HLA-B*57:01.
Source: Van Den Driessche and Fourches (2016) [42]. https://jcheminf.springeropen.com/articles/10.1186/s13321-017-0202-6. Licenced under CC BY 4.0. (See color plate section for the color representation of this figure.)

Figure 12.8 Heat map of eM scores for the full test set. Green spaces represent the most favorable docking scores (eM < −50 kcal/mol) while spaces transition from yellow to red represent drugs that have nonfavorable interactions with HLA-B*57:01 (eM > −50 kcal/mol). White spaces indicate that GLIDE was unable to identify a best binding mode between drug and HLA-B*57:01.
Source: Van Den Driessche and Fourches (2016) [42]. https://jcheminf.springeropen.com/articles/10.1186/s13321-017-0202-6. Licenced under CC BY 4.0.
Interestingly, the role of peptide becomes quite apparent when viewing either Figure 12.7 or 12.8: there are three drugs that have favorable DS scores (less than or equal to −7 kcal/mol) and favorable eM scores (less than or equal to −50 kcal/mol) in the absence of P1, P2, or P3, but do not pass the thresholds when peptide is present [42]. Interestingly, fenofibrate in the presence of P1 passes both thresholds, but fails both thresholds when docked in the presence of P2 or P3. For the test set of drugs DS values range from −1.8 (flucloxacillin, XP + P2) to −10.3 (fenofibrate, XP + P1); however, there is significantly more variance in the eM scores. The lowest measured eM score is −91.6 (pazopanib, XP – P1), while the highest eM score is positive 112.2 (simvastatin, XP + P1) [42]. Intriguingly, there are four drugs that exhibit positive eM scores when the XP scoring function is employed in the presence of either P1, P2, or P3 (clozapine, fenofibrate, flucloxacillin, and simvastatin) [42]. When these positive eM scores are observed, it is expected that the corresponding DS would also be high; however, in some instances this is not the case and in fact the corresponding DS for fenofibrate, flucloxacillin, and simvastatin are rather negative. For example, when simvastatin was docked using XP + P1, the resulting DS was −10.3 kcal/mol, while the eM score was 112.2 kcal/mol. Simvastatin's DS indicates that the drug forms extremely favorable interactions with the binding pocket, but the eM scores indicate that this pose will be unfavorable. It seems unlikely that both situations can be true to such an extreme extent. These ambiguous results indicate a clear limitation of applying molecular docking to a tripartite complex such as HLA-drug-peptide, where the dynamic interactions between drug and peptide are extremely important. Therefore, molecular dynamics simulations will be needed to further evaluate, analyze, and understand these interactions.
Overall, our model was able to reproduce the binding mode of crystallized abacavir and successfully docked a test set of drugs with the HLA-B*57:01 variant. A full summary of these results are provided in Figure 12.9, where green cells represent drugs that passed both threshold criteria using SP and XP functions, yellow cells represent drugs that only passed using the XP function, orange cells represent drugs that only passed using the SP function, and red cells represent drugs that failed both SP and XP scoring functions. Furthermore, our model was able to successfully distinguish active pazopanib as an HLA-B*57:01-active compound. Interestingly, our model failed to identify flucloxacillin as an HLA-B*57:01-active compound. This result may occur because flucloxacillin is suspected to form a hapten complex with lysine containing peptides [49, 50] and molecular mechanics cannot create covalent bonds. Although there are some clear limitations with applying molecular docking as a virtual screening procedure with HLA variants, we feel confident that our model will be able to identify previously unknown HLA-B*57:01-active compounds when we conduct a screening of the DrugBank and Tox21 databases.
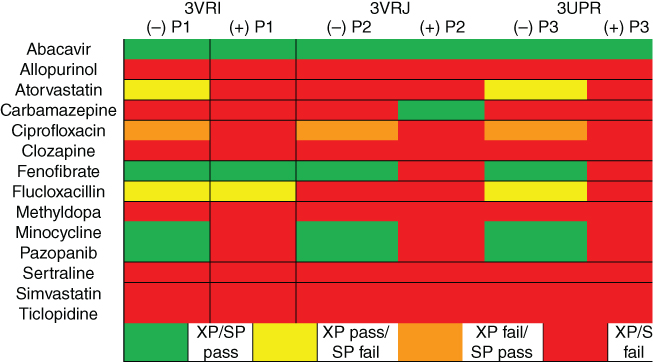
Figure 12.9 Full docking summary combining SP and XP results. Green represents compounds that passed both DS (DS < −7 kcal/mol) and eM (eM < −50 kcal/mol) thresholds for SP and XP scoring functions; yellow represents compounds that passed the thresholds for XP but failed using SP; orange represents compounds that failed the XP thresholds but passed SP; and red represents the compounds that failed the thresholds for both XP and SP scoring functions.
Source: Van Den Driessche and Fourches (2016) [42]. https://jcheminf.springeropen.com/articles/10.1186/s13321-017-0202-6. Licenced under CC BY 4.0.
12.3.3 Limitations
Developing a virtual screening protocol that can quickly and accurately identify HLA-drug associations in order to reduce the number of drug-related adverse events is extremely important for patient safety and reducing treatment-related costs. However, with a lack of experimentally verified HLA-drug associations (such as IC50 or pKi values), the use of traditional virtual screening techniques (e.g., QSAR, pharmacophore) is extremely difficult. Our group developed a virtual screening protocol using molecular docking targeting the HLA-B*57:01 variant [42]. Our model was able to successfully reproduce the binding mode of crystalized abacavir with three co-binding peptides. Furthermore, we successfully identified the stabilization energy provided by the co-binding peptide for abacavir (DS is stabilized by ∼1–2 kcal/mol and the eM score is stabilized by ∼12–17 kcal/mol).
However, there are some clear limitations when applying molecular docking to such a three-part system. First, our model employs a flexible-ligand/rigid-receptor molecular docking approach. In systems without a co-binding peptide, this technique can accurately be used to screen compounds for activity. However, in that model the co-binding peptide is also treated as rigid. In reality, the co-binding peptide will undergo conformational changes in response to the binding of different drugs. The next phase of our research will attempt molecular dynamic simulations of HLA-B*57:01 variant with different co-binding peptides and three active drugs in order to better understand the dynamic relationships between HLA, drug, and peptide.
This limitation of a rigid peptide is clearly demonstrated for clozapine, fenofibrate, flucloxacillin, and simvastatin when the XP scoring function is used and a positive eM score is measured (Figures 12.7–12.9). Identifying the cause of this shortcoming may prove difficult. However, the range of this limitation may be explored by conducting multiple docking studies, performing self-docking, and employing molecular dynamic studies. Finally, this problem may be minimized by allowing amino acid side chains to rotate freely.
Lastly, there is one major challenge when attempting any molecular docking study of HLA-drug binding. There are three mechanisms for HLA-drug signaling mechanisms for T-cell activation: altered repertoire, p. i. complex, and hapten complex (Figure 12.3). If a drug forms an altered repertoire, then generating a docking grid in the protein pocket (or beneath a peptide) should allow us to accurately screen for HLA actives; but the peptide binding pockets are extremely large (8–12 amino acid residues in length for Class I). However, if a drug forms a p. i. complex with HLA and peptide, then a docking protocol built using an altered repertoire complex (similar to our model) may not accurately forecast these compounds as active, because the model was designed using a different binding. Instead, an ensemble docking approach will be needed where molecular dynamics are used to first identify, where a drug non-covalently binds to the surface of HLA-peptide and then a molecular docking procedure is employed. In the event that a drug forms a hapten complex (such as flucloxacillin), then molecular docking and molecular dynamics will both fail to identify whether a drug is HLA active. This limitation is the direct result of hapten complexes created from the formation of a covalent bond, which limits these complexes to studies by quantum mechanics. One technique that could be used to identify these compounds would be the use of quantum mechanics/molecular mechanics (QM/MM), where large systems are treated with MM while the bond formation site of the complex is treated at the QM level.

Figure 12.10 Population distribution by percentage for three select HLA-variants: HLA-A*31:01, HLA-B*15:02, and HLA-B*57:01. The ethnicities studied were African-American (n = 251), Caucasian (n = 265), Hispanic (n = 234), North American Natives (n = 187), and Asians (n = 358) from the United States. Please refer to Cao et al. 2001 [73] for further details.
12.4 Perspectives
The dramatic cost reduction of genetic sequencing is fueling the development of personalized medicine opportunities. Indeed, DNA sequencing can now be conducted for less than $1,000 per individual which is a drastic drop from the reported value of $4,000 from mid-2015 [70]. Therefore, it is likely plausible to envision a future where all patients are genotyped as part of their routine lab work. Such highly specific patient-gene profiling could enable new strategies for prescribing drugs to individuals by taking into account their actual gene alleles and/or gene expression profiles. This scenario is already in place for certain types of tumors: for instance, BRCA1 was identified as a carrier for breast cancer in 2002 [71], which enabled a famous actress (and thousands of other women) to undertake a preventive double mastectomy to reduce her chances of breast cancer in 2013 [72]. Undoubtedly, we can imagine the same type of precision medicine strategy for limiting ADRs.
The frequency of a particular HLA variant is very different from one variant to another, from one population to another. A study conducted in 2001 by Cao et al. [73] studied the frequency of multiple HLA-variants in African–Americans (n = 251), Caucasians (n = 265), Hispanics (n = 234), North American Natives (n = 187), and Asians (n = 358) from the United States. In Figure 12.10, three HLA-variants are highlighted (HLA-A*31:01, -B*15:02, and -B*57:01) with the percentage occurrence by population plotted. Interestingly, the occurrence of a variant changes with the ethnicity of the studied population. For instance, in African–Americans it was observed that there was 2.4% occurrence of the HLA-B*57:01 variant, whereas the HLA-A*31:01 and -B*15:02 variants occurred in less than 1% of African–Americans [73]. Furthermore, the occurrence of the HLA-B*15:02 variant was not observed in Caucasian, Hispanic, or North American Natives, but was observed in those populations for the HLA-A*31:01 and HLA-B*57:01 variants [73]. Clearly, the changing distribution of HLA-variants by ethnicity presents another obstacle to the challenge of forecasting specific drug-HLA inducing events.
Thus, new experimental assays need to be developed that aim to identify in patients the most common variants and/or the ones known to be responsible for the most life-threatening ADRs. Meanwhile, HLA-mediated ADRs could be better assessed using the cheminformatics and computational chemistry techniques we presented in the previous sections of this chapter. Modeling results recapitulated in this chapter demonstrate that strong HLA binders can be detected using molecular docking. However, there are limitations to the use of molecular docking as a tool to forecast drug-HLA associations that should be considered when employing the model. With the advent of more experimental assays capable of determining the binding affinities between drugs and HLA-variants, more robust cheminformatics models will use those experimental points and become more accurate. The use of several different cheminformatics models would greatly increase the likelihood of identifying true HLA-active compounds.
One possible technique for improving the accuracy of any molecular docking model could be the development of a virtual HLA Pocketome. A virtual HLA Pocketome would enable fast and automatic screening of lead compounds and drug candidates toward a panel of HLA variants. Protein binding site libraries already exist for protein kinases, cytochrome P450, and nuclear hormone receptor families to give a few examples (www.pocketome.org). If the drug candidate or any other chemical would be predicted to hit a list of key HLA variants with a binding affinity predicted to be significant, then alerts could be made for this chemical. Since HLA-mediated ADRs are rarely seen during clinical trials, such in silico predictions would facilitate their detection and thus help preventing such life-threatening events.
References
- 1 Rodríguez-Monguió, R., Otero, M.J., and Rovira, J. (2003) Assessing the economic impact of adverse drug effects. Pharmacoeconomics, 21 (9), 623–650.
- 2 Hakkarainen, K.M., Hedna, K., Petzold, M. et al. (2012) Percentage of patients with preventable adverse drug reactions and preventability of adverse drug reactions – a meta-analysis. PLoS One, 7 (3), e33236.
- 3 U.S. Food and Drug Administration. (2017) FDA Adverse Event Reporting System (FAERS) Statistics.
- 4 Bharadwaj, M., Illing, P., Theodossis, A. et al. (2012) Drug hypersensitivity and human leukocyte antigens of the major histocompatibility complex. Annu. Rev. Pharmacol. Toxicol., 52, 401–431.
- 5 Hunziker, T., Bruppacher, R., Kuenzi, U.P. et al. (2002) Classification of ADRs: a proposal for harmonization and differentiation based on the experience of the comprehensive hospital drug monitoring Bern/St. Gallen, 1974–1993. Pharmacoepidemiol. Drug Saf., 11 (2), 159–163.
- 6 Pirmohamed, M. (2014) Personalized Pharmacogenomics: Predicting Efficacy and Adverse Drug Reactions. Annu. Rev. Genomics Hum. Genet., 15 (1), 349–370.
- 7 Robinson, J., Hayhurst, J., Flicek, P. et al. (2015) The IPD and IMGT/HLA database: allele variant databases. Nucleic Acids Res., 43, D423–D431.
- 8 Neefjes, J., Jongsma, M.L.M., Paul, P., and Bakke, O. (2011) Towards a systems understanding of MHC class I and MHC class II antigen presentation. Nat. Rev. Immunol., 11 (12), 823.
- 9 Vyas, J.M., Van der Veen, A.G., and Ploegh, H.L. (2008) The known unknowns of antigen processing and presentation. Nat. Rev. Immunol., 8 (8), 607–618.
- 10 Kurts, C., Robinson, B.W.S., and Knolle, P.A. (2010) Cross-priming in health and disease. Nat. Rev. Immunol., 10 (6), 403–414.
- 11 Crotzer, V.L., Glosson, N., Zhou, D. et al. (2010) LAMP-2-deficient human B cells exhibit altered MHC class II presentation of exogenous antigens. Immunology, 131 (3), 318–330.
- 12 Marsh, S.G.E., Parham, P., and Barber, L.D. (2000) The HLA Facts Book, Academic Press, London, pp. 55–57.
- 13 Ghosh, P., Amaya, M., Mellins, E., and Wiley, D.C. (1995) The structure of an intermediate in class II MHC maturation: CLIP bound to HLA-DR3. Nature, 378 (6556), 457–462.
- 14 Kropshofer, H., Vogt, A.B., Moldenhauer, G. et al. (1996) Editing of the HLA-DR-peptide repertoire by HLA-DM. EMBO J., 15 (22), 6144–6154.
- 15 Martin, A.M., Nolan, D., Gaudieri, S. et al. (2004) Predisposition to abacavir hypersensitivity conferred by HLA-B*5701 and a haplotypic Hsp70-Hom variant. Proc. Natl. Acad. Sci. USA, 101 (12), 4180–4185.
- 16 Cheng, C.Y., Su, S.C., Chen, C.H. et al. (2014) HLA associations and clinical implications in T-cell mediated drug hypersensitivity reactions: an updated review. J. Immunol. Res., 2014, 1–8.
- 17 Hung, S., Chung, W., Liou, L.-B. et al. (2005) HLA-B*5801 allele as a genetic marker for severe cutaneous adverse reactions caused by allopurinol. Proc. Natl. Acad. Sci. USA, 102 (11), 4134–4139.
- 18 Chung, W.H., Hung, S.-I., Hong, H.-S. et al. (2004) A marker for Stevens–Johnson syndrome. Nature, 428 (6982), 6–7.
- 19 Shi, Y.-W., Min, F.-L., Qin, B. et al. (2012) Association between HLA and Stevens–Johnson syndrome induced by carbamazepine in Southern Han Chinese: genetic markers besides B*1502? Basic Clin. Pharmacol. Toxicol., 111 (1), 58–64.
- 20 Ozeki, T., Mushiroda, T., Yowang, A. et al. (2011) Genome-wide association study identifies HLA-A*3101 allele as a genetic risk factor for carbamazepine-induced cutaneous adverse drug reactions in Japanese population. Hum. Mol. Genet., 20 (5), 1034–1041.
- 21 Yang, Y., Chen, S., Yang, F. et al. (2016) HLA-B*51:01 is strongly associated with clindamycin-related cutaneous adverse drug reactions. Pharmacogenomics J. doi: 10.1038/tpj.2016.61. Epub ahead of print.
- 22 Goldstein, J.I., Jarskog, L.F., Hilliard, C. et al. (2014) Clozapine-induced agranulocytosis is associated with rare HLA-DQB1 and HLA-B alleles. Nat. Commun., 5, 4757.
- 23 Legge, S.E., Hamshere, M.L., Ripke, S. et al. (2016) Genome-wide common and rare variant analysis provides novel insights into clozapine-associated neutropenia. Mol. Psychiatry, 22, 1–7.
- 24 Tohyama, M., Hashimoto, K., Yasukawa, M. et al. (2007) Association of human herpesvirus 6 reactivation with the flaring and severity of drug-induced hypersensitivity syndrome. Br. J. Dermatol., 157 (5), 934–940.
- 25 Daly, A.K., Donaldson, P.T., Bhatnagar, P. et al. (2009) HLA-B*5701 genotype is a major determinant of drug-induced liver injury due to flucloxacillin. Nat. Genet., 41 (7), 816–819.
- 26 Cheung, Y.-K., Cheng, S.-H., Chan, E.J.M. et al. (2013) HLA-B alleles associated with severe cutaneous reactions to antiepileptic drugs in Han Chinese. Epilepsia, 54 (7), 1307–1314.
- 27 Yang, F., Xuan, J., Chen, J. et al. (2016) HLA-B*59:01: a marker for Stevens–Johnson syndrome/toxic epidermal necrolysis caused by methazolamide in Han Chinese. Pharmacogenomics J., 16 (1), 83–87.
- 28 Chantarangsu, S., Mushiroda, T., Mahasirimongkol, S. et al. (2009) HLA-B*3505 allele is a strong predictor for nevirapine-induced skin adverse drug reactions in HIV-infected Thai patients. Pharmacogenet. Genomics, 19 (2), 139–146.
- 29 Xu, C.-F., Johnson, T., Wang, X. et al. (2016) HLA-B*57:01 confers susceptibility to pazopanib-associated liver injury in patients with cancer. Clin. Cancer Res., 22 (6), 1371–1377.
- 30 Hirata, K., Takagi, H., Yamamoto, M. et al. (2008) Ticlopidine-induced hepatotoxicity is associated with specific human leukocyte antigen genomic subtypes in Japanese patients: a preliminary case-control study. Pharmacogenomics J., 8 (1), 29–33.
- 31 Sedgwick, P. and Marston, L. (2010) Odds ratios. BMJ, 341 (Aug18 1), c4414–c4419.
- 32 Tingting, D., Yang, L., Luo, H. et al. (2015) HLADR : a database system for enhancing the discovery of biomarkers for predicting human leukocyte antigen-mediated idiosyncratic adverse drug reactions. Biomark. Med., 9, 1079–1093.
- 33 Wei, C.Y., Chung, W.H., Huang, H.W. et al. (2012) Direct interaction between HLA-B and carbamazepine activates T cells in patients with Stevens–Johnson syndrome. J. Allergy Clin. Immunol., 129 (6), 1562–1569.
- 34 Schotland, P., Bojunga, N., Zien, A. et al. (2016) Improving drug safety with a systems pharmacology approach. Eur. J. Pharm. Sci, 94, 84–92.
- 35 Zhou, P., Zhang, S., Wang, Y. et al. (2016) Structural modeling of HLA-B*1502/peptide/carbamazepine/T-cell receptor complex architecture: implication for the molecular mechanism of carbamazepine-induced Stevens–Johnson syndrome/toxic epidermal necrolysis. J. Biomol. Struct. Dyn., 34 (8), 1806–1817.
- 36 Dettling, M., Cascorbi, I., Opgen-Rhein, C., and Schaub, R. (2007) Clozapine-induced agranulocytosis in schizophrenic Caucasians: confirming clues for associations with human leukocyte class I and II antigens. Pharmacogenomics J., 7 (5), 325–332.
- 37 Illing, P.T., Vivian, J.P., Dudek, N.L. et al. (2012) Immune self-reactivity triggered by drug-modified HLA-peptide repertoire. Nature, 486 (7404), 554–558.
- 38 Ostrov, D.A., Grant, B.J., Pompeu, Y.A. et al. (2012) Drug hypersensitivity caused by alteration of the MHC-presented self-peptide repertoire. Proc. Natl. Acad. Sci. USA, 109 (25), 9959–9964.
- 39 Saag, M., Balu, R., Phillips, E. et al. (2008) High sensitivity of human leukocyte antigen-b*5701 as a marker for immunologically confirmed abacavir hypersensitivity in white and black patients. Clin. Infect. Dis., 46 (7), 1111–1118.
- 40 Yang, C., Wang, C., Zhang, S. et al. (2015) Structural and energetic insights into the intermolecular interaction among human leukocyte antigens, clinical hypersensitive drugs and antigenic peptides. Mol. Simul., 41 (9), 741–751.
- 41 Metushi, I.G., Wriston, A., Banerjee, P. et al. (2015) Acyclovir has low but detectable influence on HLA-B*57:01 specificity without inducing hypersensitivity. PLoS One, 10 (5), e0124878.
- 42 Van Den Driessche, G. and Fourches, D. (2016) Adverse drug reactions triggered by the common HLA-B*57:01 variant: a molecular docking study. J. Cheminform., 9, 1–17.
- 43 Lucas, A., Lucas, M., Strhyn, A. et al. (2015) Abacavir-reactive memory T cells are present in drug naïve individuals. PLoS One, 10 (2), e0117160.
- 44 Robinson, G.E., Weber, J., Griffiths, C. et al. (1985) Cutaneous adverse reactions to acyclovir: case reports. Genitourin. Med., 61 (1), 62–63.
- 45 Vernassiere, C., Barbaud, A., Trechot, P.H. et al. (2003) Systemic acyclovir reaction subsequent to acyclovir contact allergy: which systemic antiviral drug should then be used? Contact Dermatitis, 49 (3), 155–157.
- 46 Mir-Bonafé, J.M., Román-Curto, C., Santos-Briz, A. et al. (2013) Eczema herpeticum with herpetic folliculitis after bone marrow transplant under prophylactic acyclovir: are patients with underlying dermatologic disorders at higher risk? Transpl. Infect. Dis., 15 (2), E75–E80.
- 47 Pichler, W.J., Beeler, A., Keller, M. et al. (2006) Pharmacological interaction of drugs with immune receptors: the p–i concept. Allergol. Int., 55 (November 2005), 17–25.
- 48 Illing, P.T., Mifsud, N.A., and Purcell, A.W. (2016) Allotype specific interactions of drugs and HLA molecules in hypersensitivity reactions. Curr. Opin. Immunol., 42, 31–40.
- 49 Monshi, M.M., Faulkner, L., Gibson, A. et al. (2013) Human leukocyte antigen (HLA)-B*57:01-restricted activation of drug-specific T cells provides the immunological basis for flucloxacillin-induced liver injury. Hepatology, 57 (2), 727–739.
- 50 Jenkins, R.E., Meng, X., Elliott, V.L. et al. (2009) Characterisation of flucloxacillin and 5-hydroxymethyl flucloxacillin haptenated HSA in vitro and in vivo. PROTEOMICS - Clin. Appl., 3 (6), 720–729.
- 51 Madhavi Sastry, G., Adzhigirey, M., Day, T. et al. (2013) Protein and ligand preparation: Parameters, protocols, and influence on virtual screening enrichments. J. Comput. Aided. Mol. Des., 27 (3), 221–234.
- 52 Jacobson, M.P., Friesner, R.A., Xiang, Z., and Honig, B. (2002) On the role of the crystal environment in determining protein side-chain conformations. J. Mol. Biol., 320 (3), 597–608.
- 53 Jacobson, M.P., Pincus, D.L., Rapp, C.S. et al. (2004) A hierarchical approach to all-atom protein loop prediction. Proteins Struct. Funct. Genet., 55 (2), 351–367.
- 54 Greenwood, J.R., Calkins, D., Sullivan, A.P., and Shelley, J.C. (2010) Towards the comprehensive, rapid, and accurate prediction of the favorable tautomeric states of drug-like molecules in aqueous solution. J. Comput. Aided. Mol. Des., 24 (6–7), 591–604.
- 55 Shelley, J.C., Cholleti, A., Frye, L.L. et al. (2007) Epik: a software program for pKa prediction and protonation state generation for drug-like molecules. J. Comput. Aided. Mol. Des., 21 (12), 681–691.
- 56 Banks, J.L., Beard, H.S., Cao, Y. et al. (2005) Integrated modeling program, applied chemical theory (IMPACT). J. Comput. Chem., 26 (16), 1752–1780.
- 57 Harder, E., Damm, W., Maple, J. et al. (2016) OPLS3: a force field providing broad coverage of drug-like small molecules and proteins. J. Chem. Theory Comput., 12 (1), 281–296.
- 58 Jorgensen, W.L., Maxwell, D.S., and Tirado-Rives, J. (1996) Development and testing of the OLPS all-atom force field on conformational energetics and properties of organic liquids. J. Am. Chem. Soc., 118 (15), 11225–11236.
- 59 Jorgensen, W.L. and Tirado-Rives, J. (1988) The OPLS [optimized potentials for liquid simulations] potential functions for proteins, energy minimizations for crystals of cyclic peptides and crambin. J. Am. Chem. Soc., 110 (6), 1657–1666.
- 60 Shivakumar, D., Williams, J., Wu, Y. et al. (2010) Prediction of absolute solvation free energies using molecular dynamics free energy perturbation and the OPLS force field. J. Chem. Theory Comput., 6 (5), 1509–1519.
- 61 Fourches, D., Muratov, E., and Tropsha, A. (2010) Trust, but verify: on the importance of chemical structure curation in cheminformatics and QSAR modeling research. J. Chem. Inf. Model., 50 (7), 1189–204.
- 62 Fourches, D., Muratov, E., and Tropsha, A. (2015) Curation of chemogenomics data. Nat. Chem. Biol., 11 (8), 535.
- 63 Trott, O. and Olson, A.J. (2009) AutoDock vina: improving the speed and accuracy of docking with a new scoring function, efficient optimization, and multithreading. J. Comput. Chem., 31 (2), 455–461.
- 64 Jones, G., Willett, P., Glen, R.C. et al. (1997) Development and validation of a genetic algorithm for flexible docking. J. Mol. Biol., 267 (3), 727–748.
- 65 Rarey, M., Kramer, B., Lengauer, T., and Klebe, G. (1996) A fast flexible docking method using an incremental construction algorithm. J. Mol. Biol., 261 (3), 470–489.
- 66 Friesner, R.A., Banks, J.L., Murphy, R.B. et al. (2004) Glide: a new approach for rapid, accurate docking and scoring. 1. Method and assessment of docking accuracy. J. Med. Chem., 47 (7), 1739–1749.
- 67 Halgren, T.A., Murphy, R.B., Friesner, R.A. et al. (2004) Glide: a new approach for rapid, accurate docking and scoring. 2. Enrichment factors in database screening. J. Med. Chem., 47 (7), 1750–1759.
- 68 Friesner, R.A., Murphy, R.B., Repasky, M.P. et al. (2006) Extra precision glide: docking and scoring incorporating a model of hydrophobic enclosure for protein–ligand complexes. J. Med. Chem., 49 (21), 6177–6196.
- 69 Tubert-Brohman, I., Sherman, W., Repasky, M., and Beuming, T. (2013) Improved docking of polypeptides with glide. J. Chem. Inf. Model., 53 (7), 1689–1699.
- 70 National Human Genome Research Institute (NHGRI) (2016) The Cost of Sequencing a Human Genome.
- 71 van 't Veer, L.J., Dai, H., van de Vijver, M.J. et al. (2002) Gene expression profiling predicts clinical outcome of breast cancer. Nature, 415 (6871), 530–536.
- 72 Jolie, A. (2013) My Medical Choice. New York Times.
- 73 Cao, K., Hollenbach, J., Shi, X. et al. (2001) Analysis of the frequencies of HLA-A, B, and C alleles and haplotypes in the five major ethnic groups of the United States reveals high levels of diversity in these loci and contrasting distribution patterns in these populations. Hum. Immunol., 62 (9), 1009–1030.