
14
Surveillance Detection
“We can learn even from our enemies.”
Ovid
14.1 Surveillance Detection and Other Suspicious Situations
In the days following the 9/11 attacks, information, speculation, rumors, “be on the lookout” or BOLOs, and suspicious situation reports flooded into every public safety agency, which generally compiled these reports in notebooks and clipboards. Many of these reports were investigated; however, the vast flow of information made it difficult to conduct any sort of analysis. Similarly, information went up, down, over, around, and through almost every public safety agency in this country, whether large, small, local, state, or federal; however, there were limited opportunities to ensure that this information-sharing process was organized or even complete. As things have slowed down somewhat from that initial frenzy, two information-based challenges have emerged: information stovepipes and the failure to identify meaningful relationships and patterns. One of the goals of this text is to encourage analytical and operational personnel to work together more closely, even within the same organization. To address information stovepipes in law enforcement and intelligence analysis is well beyond the scope of this book. The emerging emphasis on identifying meaningful patterns and relationships however, is well within the purview of data mining and predictive analysis. In my opinion, “connecting the dots” merely tells us what happened. To create safer neighborhoods for our children and ensure our homeland security requires us to look forward in an effort to anticipate and ultimately prevent bad things from happening. Whether it is a street corner drug-related shooting or the next cataclysmic terrorist attack, figuring out what happened in retrospect is a costly approach to public safety.
While there are no crystal balls in law enforcement and intelligence analysis, data mining and predictive analytics can help characterize criminal behavior so that we can make accurate and reliable predictions regarding future behavior or actions, which is absolutely essential to effective crime prevention. One area where this has tremendous potential is surveillance detection. In many ways, surveillance is a systematic review of a person, route, facility, or some other item of interest. Data mining and predictive analytics thrive on homogeneous and coordinated behavior, such as that which is embodied in the aforementioned “systematic review.”
Most, if not all, suspicious situation reports should be analyzed for any consistent behavior, unusual patterns, or indications of possible intensification or escalation, even if they have been investigated already. The analyst frequently can provide preliminary information illuminating what the suspect might be considering. For example, ongoing repeated observations of the same facility might indicate an interest in that location as a particular target. Preliminary analysis of these reports might suggest clustering in the weekends. By separating the activity by different time blocks, the analyst might notice increased surveillance activity around closing time. By drilling down into the data, we might identify two types of suspicious activity. Perhaps there are two groups interested in this location. One is considering a robbery, while the other might be interested in an after-hours burglary. Characterizing and modeling this behavior can guide additional coordinated surveillance detection activities, or it might establish a likely time frame and possible type of incident, which could be addressed by heavy deployment or some other proactive, targeted operation.
In many ways, surveillance detection techniques can play a significant role in traditional crime analysis. Preoperational surveillance is not unusual for many patterns of offending. A criminal planning a bank robbery might drive by several banks looking for those with physical characteristics that appeal to him. Easy access and egress might be imperative. Proximity to major highways or multiple escape routes might be important considerations. Once a specific location has been selected, the suspect might spend time watching the bank to determine routine operations. When is it busy? When is it relatively slow? Are there security personnel? If so, do they take breaks? In short, the potential bank robber is interested in information that will maximize his gain while minimizing the risk of apprehension. The suspect might have been noticed several times during this process. The bank tellers may have noticed the same vehicle sitting outside the bank on multiple occasions. The suspect might even have come into the bank and then left without transacting any bank business. In some cases the suspect might engage in conversation with bank employees or make inquiries regarding the security procedures. Unfortunately, this information often comes to the attention of law enforcement personnel only after something happens or if awareness has been heightened due to a high-profile event or series of events. The important point, though, is that preoperational surveillance is associated with many patterns of offending, and that in many cases this behavior is noted. In some cases, preoperational surveillance is reported, but it is rare for it to be compiled and analyzed on a routine basis. If a particular agency understands the value of this information and proactive analysis, they might be able to anticipate the type of location to be targeted next, respond proactively, and make a rapid apprehension. Unfortunately, law enforcement agencies generally do not receive information that is proactive and specific unless they are in the midst of a particular series. Regardless, “suspicious situation” reports of this nature should be analyzed whenever possible, as they frequently provide a window into the criminal planning process.
Preoperational or hostile surveillance generally is intended to be covert or to appear relatively innocuous to uninformed observers. Frequently, it is only when a larger pattern of suspicious behavior or presumptive preoperational surveillance activity has been identified, compiled, and characterized that the true nature of the activity is revealed. For example, reports in the media have suggested increased interest in facilities in northwest Washington state.1 These reports outline several incidents of unusual or suspicious behavior, including photo and video surveillance of sensitive locations and facilities as well as attempts to obtain regional survey materials. This repeated and ongoing occurrence of suspicious and unusual behavior in and around Anacortes, Washington, the Deception Pass Bridge, and Whidbey Island has particular relevance given the critical infrastructure and military assets located in that area. These assets include the Whidbey Island Naval Station and the Washington state ferry system, which provides critical access to many of the islands in the Puget Sound, as well as the neighboring oil refineries. This unusual behavior takes on added significance given the fact that the Millennium bomber was apprehended at the Anacortes ferry terminal. When reviewed in isolation, these reports might not be cause for concern. Analyzed as a larger pattern, however, these incidents suggest a coordinated effort to acquire information about a particular geographic region.
Terrorist groups, including Al Qaeda, historically have shown a preference for multiple, simultaneous, yet geographically distinct attacks. Examples of this behavior include the African embassy bombings, the 9/11 attacks,2 and the London and Madrid transportation bombings. Subsequent analysis in each of these incidents revealed extensive, long-term preoperational surveillance of the targets, including a “dry run” in London several weeks before the attacks. Similarly, the casing reports collected on financial institutions within the United States indicate increased activity on Wednesdays.3 Again, reviewed in isolation, these events might indicate nothing more than something idiosyncratic or unique to the facility, or even reporting bias. On the other hand, the finding of increased activity on Wednesdays across multiple facilities increases the value of that observation and supports the idea of coordinated activities and common planning.
Suspicious actions or behavior suggestive of preoperational planning or surveillance are both infrequent and subtle by their very nature. Trying to identify unusual or suspicious behavior indicative of something far more sinister often resembles looking for the proverbial needle in the haystack. Frequently, indications of these types of activities almost always occur only when the potential suspect makes a mistake, which further highlights their rarity. What would be helpful in revealing these activities, the “needle in the haystack,” would be some sort of magnet. In many ways, the technique of anomaly detection can serve that function.
Building on the concept of risk-based deployment described in Chapter 13, similar data mining strategies can be used to maximize surveillance detection resources.4 Like patrol deployment, the use of data mining takes advantage of the nonrandom or systematic nature of preoperational surveillance. Characterizing and predicting when and where this activity is likely to occur can guide proactive deployment of surveillance detection resources in a way that increases the likelihood that these personnel resources will be in place when and where the behavior of interest occurs. Moreover, this strategy also decreases the likelihood that resources will be deployed when and where they are not needed, a feature that supports the thoughtful allocation of resources.
14.2 Natural Surveillance
It is not unusual to interview witnesses after a major event and have them recount unreported suspicious behavior that indicated something bad was about to happen. In fact, Gavin de Becker in The Gift of Fear recounts cases of workplace violence in which the event was so anticipated that as soon as the shooting started people correctly identified the suspect before the actual nature of the event was even known.5 Similarly, during the 9/11 inquiries, reports surfaced outlining unusual or troubling pre-incident behavior that was not taken seriously, investigated, or linked. The challenge implicit in this public safety predicament, therefore, is threefold. First, the information needs to be reported and compiled. While this is not a challenge specific to analytical personnel, they can be greatly impacted by incomplete or inaccurate reporting. It is not possible to analyze what does not exist, so analysts have a vested interest in ensuring that suspicious situations and other indicators of preoperational surveillance are reported and compiled. Second, the information needs to be effectively analyzed. Compiling and storing suspicious situation reports in a three-ring binder is a waste of a potentially valuable resource. The information should be entered into a database, analyzed, periodically reviewed, and analyzed again. And third, the results of the analysis need to be used operationally. This extends beyond preliminary investigation of the suspicious situation reports. Preoperational surveillance is designed to look innocuous. Frequently, it is only when the larger pattern of suspicious activity or surveillance has been revealed that it becomes actionable. If suspicious situation reports reflect mistakes on the part of the potential bad guy, then those can be used to reveal the larger pattern of surveillance. Using a model of suspicious situation reports to guide additional surveillance detection efforts can maximize often limited personnel resources. By determining when and where the most activity is occurring, operational personnel can proactively deploy and increase the chances that they might identify additional, less obvious behavior. Moreover, it also increases the likelihood that specific individuals or vehicles will be identified, which further enhances the investigative effort.
Again, while increasing natural surveillance is not really a problem of data mining or predictive analytics, gathering information that is as complete as possible is essential to creating accurate and reliable models. In many ways, enhancing information collection is an essential first step in creating a program of surveillance detection and threat assessment.
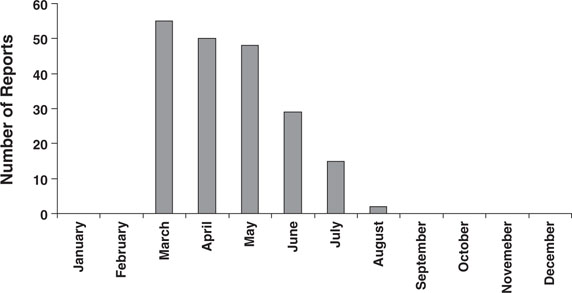
Plotting the total number of suspicious situation reports is a good first step in the process of using analysis to identify possible surveillance behavior. Therefore, it is very important to support consistency in reporting if at all possible. For example, in Figure 14-1, a marked increase in the number of suspicious situation reports was noted in March. The first question that should be addressed is: What happened in March? If employee personal safety training had been offered in March, or if there had been a major incident in late February that had heightened awareness, the increased number of reports received during the month of March would be viewed somewhat cautiously. However, if nothing obvious had changed, then it would be important to quickly assess the nature of these reports in an effort to determine whether there is cause for concern.
Similarly, the trend in the number of reports received appears to have decreased over time. Again, it is important to put this information into a context to determine whether this decline is real or something that needs to be addressed. For example, additional information indicating that each report had generated a rapid and aggressive security response would suggest that perhaps this location has become a difficult target. If this is the case, a more complete review of the specific reports would help to further define the nature of the potential threat and might even form the basis for a security-related after-action report. On the other hand, a decline in reporting with no obvious change in security might indicate apathy or frustration on the part of the staff. Again, it is important to thoroughly review the reports and possibly to conduct a survey to ensure that reporting is encouraged within the organization.
In a more complex example, we evaluate a series of reports of suspicious activity around a shopping mall. Several reports were received, but it was not clear whether this should be cause for concern. By creating a simple spreadsheet and graphing the data, it becomes apparent that most of the activity is occurring on Fridays and Saturdays (Figure 14-2). By further drilling down by time of day, it also becomes obvious that most of the activity is occurring when the mall is open and that the activity increases during the evening (Figure 14-3). Several questions come to mind at this point. For example, how does the mall activity differ on the weekend as compared to weekdays, and what is different about the evening?


More importantly, though, does this really mean anything? Is there anything of significant concern at this point? One could certainly argue that the mall population increases on the weekend. Is the increased reporting related to a transient increase in the mall population observed on Fridays and Saturdays? We also might expect more young people in the mall on the weekends because they are out of school. Is the increased reporting an artifact of an increased number of kids who have been sensitized to “stranger danger” and all of the other victimization-prevention programming that is available today? In other words, can this apparent increase in activity be attributed to reporting bias? While this might explain the increase noted on the weekends, it does not necessarily explain the increased number of reports associated with the evening hours.
On the other hand, the pattern of results could have nothing to do with anything special or unique about the mall. Rather, it could represent a convenient time or place or something unique about a potential suspect. It is not unusual for the timing and even location of crime to be related to the convenience or routine schedule of the criminals. In fact, this is referred to as their “comfort zone” and is not at all unusual with certain patterns of offending. We frequently focus on the location of the reports or some unique feature of the victim or location targeted. For example, a series of bank robberies was analyzed several years ago using regression analysis in an effort to determine the length of time between incidents. The results of the analysis revealed that the time between robberies was related to the amount taken in the previous robbery. The criminal in this case needed to maintain a certain cash flow to meet his expenses, so if he was able to obtain a large amount from one bank, the time to his next robbery was decreased. If, on the other hand, his take was relatively small, he would need to go back out and rob another bank sooner. The relationship between amount taken and the crime interval is relatively common among drug addicts. Due to the compulsive nature of drug use and/or the need to stave off withdrawal, many addicts commit economic crimes to support their drug habits. Consequently, the frequency with which they commit crimes might be related to the cost of maintaining their habit, or cash flow, and the monetary yield from each crime. While this might be the best explanation for the activity noted at the mall, it is generally a good idea to play the devil’s advocate and consider an alternate hypothesis for a particular set of data or information, because it is not at all unusual for the particular time, location, or the victim selection to be related to some unique but unknown feature of the suspect.
Even if nothing more is done analytically at this point, by compiling the information and conducting this quick analysis, operational deployment can be altered to respond specifically to the reported behavior. This results in three possible benefits. First, if there is something unusual going on, by specifically deploying operational personnel when and where it has been occurring, the likelihood is increased that they also will observe this behavior or be able to respond more quickly should it occur again. Second, increased deployment in the area might deter any additional suspicious or unusual behavior. Finally, targeted deployment in response to these reports visibly projects an increased presence, while concomitantly enhancing the perception of increased public safety in that area.
14.3 Location, Location, Location
Preoperational surveillance requires a certain amount of time for observation of the potential target, time during which the operator is vulnerable to detection. The ability to not only identify but also characterize and model this behavior has tremendous tactical and strategic value. Most frequently, this information arrives in the form of suspicious situation reports, which provide a general descriptive characterization of suspicious activity (e.g., photographing or videotaping a facility). Although suspicious situation reports rarely include specific information (e.g., exact location) in a standardized format, they can be thought of as spatial sets, which are particularly well suited for data mining and operational planning. For example, relatively general information characterizing what the subject of a suspicious situation report was observing can provide invaluable guidance regarding that individual’s likely intentions and the possible vulnerabilities associated with a particular location. Similarly, information pertaining to the individual’s general location or observation point can guide the placement of surveillance detection resources. Neither of these analyses requires specific information. Rather, spatial sets match the available data resources and are sufficient for not only analysis but operational action as well.
Let us assume that the increased number of suspicious situation reports at the mall is not related to any reporting bias and that the pattern of results is related to something associated with the mall itself. We could stop at this point and suggest that the mall increase patrol during the weekend, particularly during the evening hours, but there is some additional work that can be done to further refine the scope and add additional value to our understanding of what might be happening at the mall. Any additional trends or patterns that we can reveal in the data can provide additional insight into a possible motive for the unusual activity, which then translates into greater definition and refinement of the response options.
For example, it can add great value to an analysis to identify not only when, but where. To identify specific locations or areas that are associated with increased interest can greatly assist in the spatial refinement of surveillance detection efforts by further defining the true or active zone of unusual or suspicious activity. Providing a map of suspicious activity to the operational personnel for use in surveillance detection planning can be greatly appreciated and results in a much better operational plan by visually refining and depicting potential target areas. This can be particularly helpful with multibuilding facilities or complexes, like the mall in this example, by further refining the specific areas of interest. It also can begin to provide additional insight into the true nature of the suspicious activity, or the “why” of the behavior. Mapping or otherwise providing some sort of visual depiction of any identified spatial patterns or trends can be especially useful in conveying this type of information.
Sophisticated mapping software, although generally very beneficial and frequently used by most public safety agencies, is not entirely necessary for an analysis of this nature. Internet-based mapping tools, orthophotography images, or even line drawings such as the one shown here all convey the necessary information and can be more than adequate for this type of analysis. In many ways, a map can be viewed simply as a specialized figure or graph, a unique way to visually depict data or information. Although many mapping programs have sophisticated mathematical tools associated with them, in this situation, visually depicting the information so that the operational personnel can guide their efforts and begin to determine what is occurring and why is the most important aspect of this exercise and does not require any additional analytical software.
Mapping the data over time also can be especially valuable in determining whether the location associated with the greatest activity or most marked increases appears to move, change, or otherwise refine itself over time. In some cases it is more useful to think of a relatively fluid “cloud” of potential risk that has moved into or settled over a particular area, rather than struggling to identify and define discrete areas. Thinking of the edges as being somewhat fuzzy will limit restricting the area too much and missing potentially significant activity in the future.
By creating a map of the report locations throughout the mall, an obvious pattern emerges. The majority of the activity seems to be centered in the vicinity of the cinema (Figure 14-4). This finding also is consistent with the day and time of the reports. The cinema tends to be more active in the evening hours, particularly on Friday and Saturday nights.

Figure 14-4 Map illustrating specific locations associated with the situation reports from Figures 14-2 and 14-3.
The mall’s suspicious situation reports could reflect preoperational surveillance for anything from robbers to sexual predators surveying a target-rich environment for potential victims to an extremist group interested in calling attention to its agenda. Our analysis does not necessarily address the who or specific why of this activity. What is does, though, is characterize the behavior sufficiently that coordinated surveillance detection efforts and operational deployment can be targeted specifically to the time and location associated previously with possible surveillance activity. This limits the personnel resources required for formal surveillance detection and increases the likelihood that surveillance detection activities will be placed when and where they are most beneficial. Moreover, routine patrol can be concentrated when and where activity is greatest. Minimally, this increases the opportunity for rapid response should something bad happen. Ideally, placement of operational personnel when and where they are likely to be needed gives us the opportunity to anticipate and possibly even prevent crime.
In the shopping mall example, a series of suspicious situation reports create a very simple database. We were then able to characterize the data and drill down to extract additional details that could be used to create a focused surveillance detection plan while guiding additional public safety and crime prevention approaches. Sometimes, however, additional steps will need to be taken to further characterize the data, link possible associated events, identify potential transitions or escalation in surveillance activity, and make predictions about possible future behavior. This is particularly a challenge in high-profile sites or in locations where a variety of information has been compiled and needs to be culled for meaning.
In another situation, data mining and predictive analytics were used to characterize possible surveillance activity associated with a facility of interest. In this example, suspicious situation reports had been investigated and then compiled, although never analyzed. As can be seen in Figure 14-5, a quick review of the frequency of reports over time revealed increasing activity consistent with growing interest in the facility. Analysis of the activity by day of week further highlighted the nonrandom nature of this activity; 25% of the reported incidents occurred on Wednesdays (Figure 14-6).
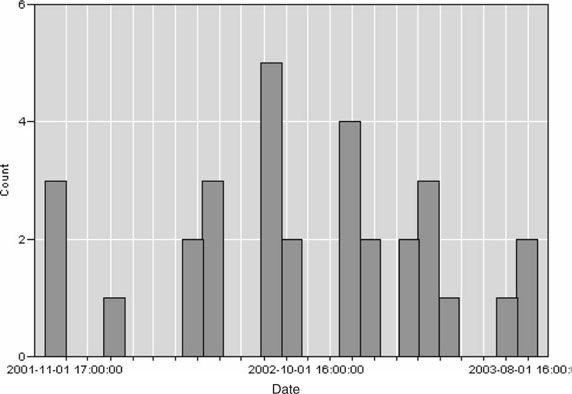
Figure 14-5 Frequency distribution depicting the relative occurrence of suspicious activity reports associated with a facility of interest. (Screenshot of output taken by the author is from Clementine 8.5, SPSS, Inc.)
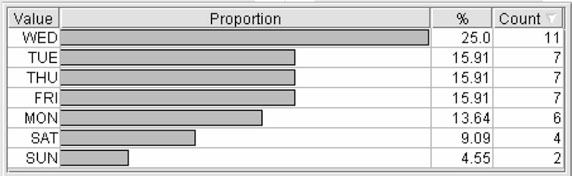
Figure 14-6 Distribution of suspicious activity by day of week. (Screenshot of output taken by the author is from Clementine 8.5, SPSS, Inc.)
The incidents were recoded into operationally relevant categories that more accurately described the suspect behavior. These included still photography (“photo”); video photography (“video”); any movement toward the facility, attempted interaction with the security personnel, or probing of the perimeter (“approach”); and all other behaviors not appropriate for inclusion in any of the previous categories (“suspsit”). These recoded incidents were plotted over time, but, as can be seen in Figure 14-7, any interpretation of these results was limited by the complexity of the graph created.

Figure 14-7 This figure depicts the distribution of suspicious behavior over time. “Approach” indicates that the suspect physically approached the facility or attempted to probe the security features or personnel, “Photo” indicates the suspect use of still photography, “Video” refers to the suspect use of video photography, and “Suspsit” includes all other behavior not included in the previous groups. (Screenshot of output taken by the author is from Clementine 8.5, SPSS, Inc.)
Moving beyond simple descriptive statistics and characterization, a clustering technique was used to determine whether the events could be grouped based on their time, nature, or location. This analysis revealed two different groups of suspicious situation incidents, which generally were associated with different types of observed behavior (e.g., still photography versus video and other operationally oriented surveillance). As can been seen in Figure 14-8, graphing these groups across time reveals a transition in the nature of suspicious activity from relatively simple behavior to more operationally oriented surveillance, suggesting an escalation in the nature of surveillance activity that paralleled the increase in frequency over time.

Figure 14-8 Pattern of suspicious behavior. This figure depicts an identified pattern of suspicious behavior over time, as revealed through the use of a clustering or unsupervised learning technique. Group membership was determined largely by the nature of the activity. Cluster 1 generally was associated with still photography of the facility, while the incidents in Cluster 2 tended to be associated with more operationally oriented activity, including video surveillance. (Screenshot of Two-Step output taken by the author is from Clementine 8.5, SPSS, Inc.)
Using relatively simple techniques, it was possible to generate operationally actionable output from the analysis. As illustrated in Figure 14-9, preparation of a crude facility map highlighted the relative spatial distribution of the incidents. Additional value was added to the map through the use of using different shades of gray to depict the nature of the activity and different intensities to convey relative differences across time. This simple technique also can serve to highlight the emerging geographic specificity of the suspected surveillance activity.

Figure 14-9 “Map” depicting the spatial distribution of suspicious activity around the facility of interest. Note that the shade of the icon is associated with the cluster membership, which visually highlights the spatial focusing of interest over time.
As outlined in this case study, the techniques do not need to be fancy or sophisticated. Rather, the key is to convey analytical output and information in a format that is relevant to the end user and immediately actionable in the applied setting. For example, the use of risk-based deployment maps6 or “schedules” provides operationally actionable analytical products that can be given directly to personnel in the field. The ability to integrate and analyze data from multiple, disparate locations can further enhance our understanding, particularly regarding those groups and organizations with a historical preference for multiple, simultaneous, geographically distinct attacks. In this situation, access to and analysis of integrated data resources can be used to identify infrequent events and reveal subtle trends or patterns. Moreover, determining “when” and “where” often can provide insight regarding “why.” Therefore, the identification and characterization of surveillance activity can not only refine surveillance detection planning and deployment but also can be used to highlight potential vulnerabilities and threats, which ultimately can be used to support the information-based deployment of countermeasures.
14.4 More Complex Surveillance Detection
At a minimum, the ability to characterize suspicious behavior provides invaluable guidance for those interested in establishing surveillance detection. Operational resources almost always are in short supply and must be deployed as efficiently as possible. The ability to take a series of suspicious situation reports and identify trends and patterns gives us the opportunity to deploy surveillance detection when and where it is most likely to gather additional information, but what happens when there are multiple potential locations of apparent interest? A multibuilding complex or facility with several layers of physical security is going to require more complex surveillance activity, and concomitantly more sophisticated surveillance detection to accurately detect, dissect, and convey the overall pattern of activity.
In this fictitious example, there is a multibuilding complex, which is depicted in Figure 14-10. The facility is surrounded by a six-foot perimeter fence (Figure 14-11). There is only one point of access to the facility, through the front sally port, which is continuously manned. Due to the nature of the complex, suspicious activity is aggressively reported and investigated. The reports are then compiled for historical archiving (Figure 14-12).


Figure 14-11 Six-foot fence surrounding the perimeter of the compound. (Staff Sergeant Tom Ferguson, USMC; used with permission.)

After an incident at a related facility, the security manager decides that the suspicious activity reports should be reviewed, characterized, and analyzed. Using data mining and predictive analytics, the reports were analyzed and classified into four separate groups. The analyst assigned to the task selected an unsupervised learning technique, which clustered the incident reports based on similar characteristics. In an effort to convey the information to the operational personnel in an actionable format, a facility map diagram was prepared in which the locations associated with the different clusters of activity were marked and highlighted.
The location indicators on the map were intentionally depicted as vague areas rather than solid areas in an effort to convey a general area of risk, rather than specific indicators or points, which might indicate specific locations. Again, using these “clouds” of risk conveys increased activity associated with this general location that might be associated with a concomitant elevation in associated risk. Similarly, size, color, and even relative differences in color saturation or intensity can be used to convey additional information, such as frequency of activity, or temporal variance. By using these techniques, the analyst can convey a relatively large amount of information through the use of a two-dimensional map.
The first cluster of activity, which is indicated by the number “1” on Figure 14-13, was characterized by activity outside the perimeter. This was frequent, as indicated by larger clouds of risk on the diagram. In particular, significant activity was associated with the front gate (Figure 14-14). Analysis revealed that the activity associated with this cluster not only increased in frequency over time but appeared to intensify as well. Additional surveillance activity was associated with the area outside the fence (Figure 14-15) in relative proximity to the dining hall. Further refinement associated with the time of this activity was noted, which initially appeared random and subsequently appeared to coincide with meals.

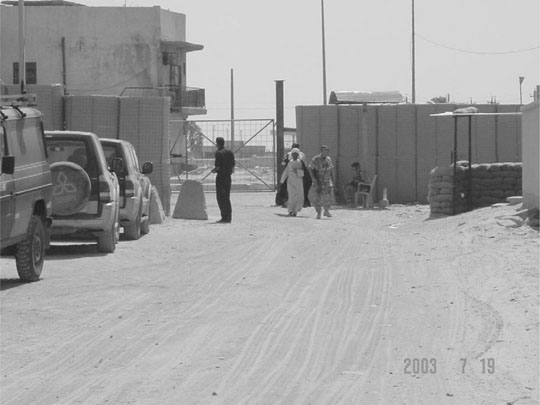

Figure 14-15 Area outside the fence near the dining hall. (Staff Sergeant Tom Ferguson, USMC; used with permission.)
The second cluster of activity was associated with the kitchen. This also was associated with relatively frequent reporting of unusual behavior, and even included one situation where an unauthorized person gained access to the facility in a delivery truck. The activity in the second cluster differed from the first in that it represented very little overt surveillance, but did include several suspicious telephone calls and inquiries regarding delivery and dining schedules.
The third cluster of activity was associated with the entrance. Again, there was not much overt visual surveillance of the facility. This cluster was associated with security probes, which included conversations and inquiries involving the personnel manning the entrance. This pattern of activity also distinguished itself in that it started to occur after the perimeter surveillance had already been operating for a period of time.
The fourth cluster of activity was by far the least frequent and the last to occur in the time series. In many ways, the incidents included in this “cluster” comprised such a diverse array of incidents that they were almost discarded as outliers or anomalies. They occurred much later than all other incidents, after a break in activity. They differed significantly in terms of the nature of the behavior and time of day, and included an unauthorized person who tried to gain access to the dining hall during a meal, as well as a triggered alarm at the entrance to the same dining facility one night. The only consistent factor was the location: the entrance to the dining hall. After the other clusters were mapped and evaluated, however, it was determined that this loose array of incidents might represent the final preoperational planning stage to an incident.
In response to this analysis, surveillance detection, physical security enhancements, and proactive deployment operational plans were developed. These were based on the specific decision rules associated with each identified cluster, which ultimately were linked to a particular set of vulnerabilities identified in the fictitious complex. This permitted the specific targeting of resources, as well as the development of additional security enhancements that were based on the associated risks related to each specific location within the complex.
By using operationally actionable mining and predictive analysis, force protection resources and strategies can be deployed in direct response to the analytical output. This includes the specific targeting of resources, as well as the development of additional security enhancements that are based on the unique constellation of associated risks related to each specific location within a multifacility base or complex.
Internet Surveillance: To Delete Information or Not
This is a relatively tough question that the analyst generally does not participate in, but there are benefits both ways. If the information truly has the potential to either create or contribute to serious threats to public safety, then prudence might dictate removal of the information. Unfortunately, electronic information that is deleted might still be available through Internet archives and other related sites. On the other hand, leaving the information intact, perhaps with a few modifications, offers unique opportunities for surveillance detection and strategic misdirection.
Of course, now that this subject has been reported in the popular press, the false sense of security that these Internet interlopers might have had, thinking that they were lost in the vastness of municipal weblog data, has been lost. This probably means that they will choose another way to assess our capacity and response systems, which highlights an important point in surveillance detection. Once the watchers realize that they have been discovered, the activity generally stops. Therefore, any surveillance detection, even at the analytical level, should be conducted surreptitiously in an effort not to alert the watchers that they also are being watched.
In their discussion of fourth-generation warfare, Lind et al.7 noted that, “Terrorists use a free society’s freedom and openness, its greatest strengths, against it.” Many organizations, agencies, and localities deploy a tremendous amount of sensitive information over the Internet in a misguided attempt to achieve the ideal of “transparent government.” For example, a cursory review of municipal websites reveals everything from specific details regarding emergency response equipment, including equipment model numbers, to detailed, high-resolution orthophotography images of sensitive locations. Similarly, while certain military facilities have been blocked (e.g., Navy facilities in the Tidewater area of Virginia), the surrounding localities deploy detailed information related to military facilities. As early as 2001, the Israelis reported that their adversaries were exploiting the increased availability of orthophotography images freely available over the Internet.8
Even information included in contractor solicitations can have value if it outlines direction, internal capacity, abilities, or vulnerabilities. Most local, state, and federal agencies have requirements for a competitive bid process associated with any major purchase or contract. Frequently included in these solicitations is sufficient information regarding the desired product or service specifications as well as anticipated deployment. This is meant to ensure that a potential contractor can generate a bid that is both responsive and competitive. One of the easiest ways to disseminate this information is through the Internet. Unfortunately, detailed bid solicitations for systems, equipment, and services, while essential for a fair and effective bid process, also sends a strong message regarding the current and future capacity of the organization. Moreover, requests for proposals such as these provide unique opportunities for cover, as individuals might request access to secure locations or request additional documents and specifications under the guise of attempting to prepare a competitive bid, something of great potential value to a surveillance operation.
A recent Rand report concluded that the U.S. government generally does not deploy enough information with operational value over the Internet to aid in terrorist planning.9 The report cautioned, however, that some nongovernmental agencies might. Therefore, the next question should be: Who else is releasing information about my organization or locality, and will they let me analyze the traffic, as well as future behavior? Keep in mind that the information pertaining to your community or location of interest probably is deployed over a variety of websites, few if any of which you have any control over or access to for security or analysis purposes. For example, at the time of this writing, detailed orthophotography images of Washington, D.C. were available through two academic institutions that were located outside of the District. Similarly, shared public safety and response information related to mutual aid agreements might be available through multiple websites. Vendors, consultants, and contractors might deploy information related to customers and projects. Tourism and public interest sites provide relatively detailed information, including photographs of locations of interest. At the time of this writing, the train bombings in Madrid were very recent. Despite the heightened level of alert in the travel industry as a whole after this brutal attack, it was still possible to locate a simulated “webcam” in a major transportation portal in this country. Although the images were not live, it was possible to scan the “camera” and view the entire area in tremendous detail, again from the anonymity of the Internet.
Another downside to the deployment of potentially sensitive information over the Internet is the high degree of anonymity associated with it. Just as child predators have been able to exploit the anonymity of the Internet; other individuals with malevolent intentions have been able to take advantage of the vast amounts of information available in relative anonymity. There is a tremendous degree of anonymity associated with movement throughout the Internet. By using anonymizers or spoofed IP addresses, it can be extremely difficult to identify a particular source or individual. This allows an individual or group to use the exploitation of readily available open-source material to conduct preliminary surveillance virtually undetected. On the other hand, these measures might not even be necessary given the tremendous amount of traffic currently on the Internet superhighway. The amount of information contained in weblogs alone can be staggering, and it is increasing continuously.
Articles and tutorials outlining military thinking, tactics, and strategy are also available over the Internet. Abu ‘Ubeid Al-Qurashi, one of Osama Bin Laden’s aides, has made specific mention of the concept of fourth-generation warfare when outlining the al Qaeda combat doctrine.10 Other reports have noted activity on the C4I.org site that was associated with Internet addresses linked to Iraq.11 A review of the activity suggested that most of their interest appeared to be related to psychological tactics, information warfare, and other military issues.
14.5 Internet Surveillance Detection
What does this have to do with data mining? Approaches and tools similar to those employed by online retailers to characterize online shopping behavior and create models of potential buyers, so-called web mining tools, can be exploited by analysts in an effort to identify and monitor possible Internet surveillance and protect critical infrastructure. Using these same web mining tools, Internet activity can be analyzed in a timely, comprehensive fashion. Integration of the data across multiple sites or reference points can provide additional value through the revelation of complex patterns of activity or behavior. Moreover, compilation and analysis of data from multiple sites provides the added benefit of comparison between sites. These data then can then be merged with additional surveillance detection information and used to support the integrated surveillance detection process outlined above.
Many localities have reported suspicious or unusual activity on their websites. In particular, IP addresses associated with locations in the Middle East have been noted searching pages related to local infrastructure and public safety.12 In one particular community, activity associated with the suspicious IP addresses frequently came in and out of the site through one specific page. While this particular web page was not noteworthy or unusual in and of itself, analysis of “normal” traffic patterns revealed that less than one-half of one percent of all page hits on this website were associated with this particular page. In other words, visits to this web page associated with “normal” or routine traffic were extremely rare. Yet it was unusual for a session associated with the suspicious IP addresses to not include at least one hit on this page.
Using this method of brute-force anomaly detection, this particular web page could be used as a screening tool or “magnet” for suspicious or unusual activity. By comparing screened traffic against known patterns of activity previously associated with suspicious IP addresses, additional IP addresses were identified. Ultimately, it was possible to create some simple filters to identify and capture potentially suspicious behavior on this website by screening for known IP addresses, as well as patterns of activity or particular page hits previously associated with suspicious addresses and behavior. Therefore, while many agencies and organizations have focused on intrusion detection, another potential vulnerability includes surveillance or misuse of information available through the Internet and other open-source venues. The ability to identify, characterize, and monitor unusual or suspicious Internet activity can provide additional insight regarding our adversaries’ interests and possible intentions, thereby increasing our battlespace awareness. Again, it is possible to gather a tremendous amount of information regarding potential surveillance activity on websites of interest by simply using a good understanding of “normal” behavior and anomaly detection.
Internet Surveillance Example
A fictitious local law enforcement agency identified regular, consistent activity on its website that was associated with an IP address linked to a particular terrorist group. Through data mining, the agency was able to identify one particular page that was visited frequently by the group of interest. By characterizing “normal,” the crime analysts were able to determine that this page was associated with limited activity beyond the terrorist group. In fact, less than 1% of all of the page hits on the entire website were associated with this page, and almost all of the visits associated with IP addresses not linked to the terrorist group came from one single referring site, the local chamber of commerce.
Initial review of the page did not offer any clues as to why this group might be so interested in it (Figure 14-16). The page was constructed in an effort to provide additional information for businesses considering relocating to the city, which we will call Main Street America. General information, including regional demographics, existing infrastructure resources, and emergency response capacity were provided. Further examination, however, provided some indication as to why the terrorist group might be interested in it.

The page in question made it clear that damage to the dam would cause loss of power and water to the region, as well as possible flooding to the homes surrounding the lake formed by the dam. The page also indicates that housing on the shores of the lake includes apartments. This high-density housing would increase the potential casualty estimates in the event of a disaster at the dam. The demographic information also provides clues as to who might appear unusual or out of the ordinary and what would be necessary to blend into that community. Information pertaining to the local population provides insight regarding local possibilities for recruitment. The existence of a nuclear laboratory in the region has value in terms of potential resources, including highly trained personnel, equipment, and raw materials, as well as potential target opportunities. In sum, the information provided innocently for potential recruiting, which did not seem critical when viewed simply as a page on a website, has significant potential tactical and strategic value to individuals with less than positive intentions.
This example combined data mining with some “brute force” techniques. Characterizing activity on a website is only the first step in the process. Again, domain expertise is essential to the accurate and meaningful review of weblog data. In most cases, it is extremely important to review the actual content of the pages visited, particularly those that are associated with unusual or repeated activity. In some cases, “brute force” manual review of the pages for key words, concepts, or other valuable information may be necessary. Text mining techniques, however, promise to automate this process further. Additional advantages of text mining include not only speed of analysis but also completeness and accuracy. The brain can only take in and hold a limited number of concepts. Expert systems, on the other hand, have almost unlimited capacity to identify and consider multiple concepts simultaneously without error, bias, or fatigue.
Going back to the “business opportunities” page, we noted that less than 1% of the hits on that particular website were to that page. Many of them involved the IP address that had been associated previously with a suspected terrorist group, and some others were associated with referrals from the local chamber of commerce website. What about the remaining IP addresses associated with hits to this page? In many ways, looking for suspicious activity on a website is like looking for a needle in a haystack. These generally are very infrequent events that can be extremely difficult to identify. In some cases, however, we can find a “magnet” that makes finding the needle a little easier. One obvious magnet is a list of IP addresses associated with known or suspected terrorist groups or locations. Another magnet is IP addresses identified by their involvement in unusual or suspicious activity. In the Main Street America example, the “business opportunities” page represents a possible magnet that could be used to identify other IP addresses worthy of additional review and analysis.
After initial data mining and characterization, browsing patterns can be characterized and modeled using sequence analysis techniques similar to those employed by online retailers for the analysis of consumer behavior. Special attention needs to be paid to prior probabilities, however, because the behavior tends to be extremely infrequent when viewed in light of the total volume of activity of a particular website. Failure to account for this could mask important details and seriously limit the ability to identify any unique trends or patterns.
Internet Honeypots
What happens once suspicious activity has been identified and characterized? One solution would be to remove the information from the website; however, this could be comparable to closing the proverbial barn door after all of the horses are gone. In addition, Internet archives exist that can hold information long after it has been removed from active web pages. An alternate solution would be to establish electronic surveillance detection. In many ways, electronic surveillance detection and countersurveillance has value that might extend beyond blocking access to the information.
Once suspicious activity has been detected, there are additional opportunities to evaluate the interest and intentions of the bad guys. For example, a particular pattern of activity might suggest interest in some areas. Deploying additional information provides an opportunity to engage in additional “hypothesis testing” regarding their true intentions. For this approach to work, actual information does not need to be deployed. The pages of interest might deploy generic information or be “under construction” indefinitely. In fact, the opportunities for disinformation abound with this arrangement. Through a specific series of new information and links, additional informational specificity can be identified and determined.
In terms of Main Street America, the analysts noted three potential areas of interest or concern associated with the web page. Figure 14-17 depicts a possible scenario that could help identify the specific area of interest associated with the suspicious activity.

14.6 How To
The first step in this process is to review and assess what information is available and what value it might have for someone with less than altruistic intentions. Why is this process important? First, as always, the key to effective and meaningful data mining is domain expertise. Knowledge of what information is deployed over the Internet, how it is organized, and what it might mean from either a tactical or strategic perspective is critical to understanding the information held in the weblogs. It also is important to consider how this information might be combined with other information on the same website or with other resources to add value. For example, patrol boundaries can be very helpful in extrapolating average response times. Information pertaining to workload, including crime rates or calls for service, would add value to the calculation of deployment and potential response times.
The second reason that a review or threat assessment of the information deployed over the website is important is because if you are reading this, then you probably have some responsibility for or involvement in public safety. Knowing what information has been deployed publicly and considering how it might be used against you, your agency, or locality can help guide possible surveillance detection efforts and response planning.
The analysis from this point on is not trivial. The amount of information contained in weblogs can be staggering, even for an analyst who has some experience wrestling with large complaint databases or telephone records. In addition, the information itself is ugly and can be very difficult to manipulate without the correct tools. Those choosing to tackle Internet data most certainly will want to bring power tools, rather than a hammer and chisel, to this battle.
Some very detailed materials and excellent software tools are available for the analysis of Internet data, but some tasks can be completed with standard data mining tools. Many public safety agencies are at a disadvantage in mining Internet data, however, because they do not set cookies. Briefly, session cookies are temporary and can be used to track movement through a website during a single session. Persistent cookies, on the other hand, not only track movement through your site, but follow the user out into the Internet, leaving a trail similar to electronic breadcrumbs. Without cookies, it is very difficult to link related page hits into a single session. This issue received some attention a few years ago after it was reported that the Central Intelligence Agency used cookies on its website.13 After they were criticized for this practice, they, as well as many other public safety agencies, made the decision to discontinue this practice. While this might limit analysis somewhat, it is still possible to presumptively link some activity based on IP address and other unique characteristics, particularly with some of the more sophisticated web mining tools. Additional “brute force” techniques can be used to characterize and analyze some of the activity on a website, particularly if the IP addresses of interest are not prevalent.
The first step generally involves an overview and characterization of routine activity on the website. As always, it is helpful to develop an understanding of “normal” behavior in an effort to create a baseline for future comparison. For example, where do people go, how to they normally enter the site, are there common referring pages, which pages are popular, and which are not? While we would like to think that every detail that is deployed over our website has value and interest, most of it is relatively boring. Thankfully, most of the information that has tactical or strategic value for those with bad intentions generally falls into the boring category, so almost any activity associated with those pages is worthy of note. For example, pages deploying critical infrastructure information generally do not appear on the list of top ten websites, but they have been some of the more popular ones associated with unusual or suspicious activity.
A second activity might include characterizing activity based on the user IP address. There will be some relatively common addresses; particularly those associated with local service providers, but some relatively infrequent addresses might be identified as well. These can be checked through reverse lookup mechanisms, similar to those used for telephone numbers. If suspicious activity or patterns are identified, then modeling algorithms can be created to further characterize the activity and generate rule sets that can be used to screen future behavior. Similarly, specific IP addresses or web pages associated with unusual or suspicious activity can be identified, and any future activity associated with those addresses or pages flagged for further investigation.
Unsupervised learning or clustering techniques also may be used to characterize “normal” patterns of Internet activity in an effort to identify possible surveillance activity. This method of anomaly detection frequently can reveal patterns of unusual behavior or potential misuse of open-source information. People often get tripped up and caught when they try to behave normally or “fly under the radar.” In many cases, however, they do not have a good sense of what “normal” truly looks like and get caught out of ignorance or because they stand out even more in their attempts to be inconspicuous. It is often difficult to completely understand what “normal” looks like until we characterize it and then analyze it in some detail. Similarly, language or cultural differences can impair an individual’s ability to melt into the background noise. Ignorance of cultural subtleties, nuances, or norms can serve as a spotlight, highlighting unusual or suspicious behavior. It is for this reason that characterizing normal trends and patterns can have value, as it provides a baseline against which unusual or suspicious behavior can be measured.
14.7 Summary
A good understanding of “normal” can be invaluable in the detection and identification of possible preoperational surveillance activities at the local level. Just as staging can be detected in violent crime because most criminals do not have a good working knowledge of “normal crime trends” and patterns, those unfamiliar with “normal” in other environments or those from other cultures also might reveal themselves when they fail to blend into the surrounding environment.
Again, identifying suspicious or unusual activity can be compared to finding a needle in the haystack. This is where anomaly detection, which is an very powerful, automated process that can be used to identify and characterize extremely low-frequency events, can have tremendous value. Once a single event has been identified and characterized, it can be modeled and used as a veritable data “magnet” to identify additional needles in the informational haystack.
As described above, characterization and analysis of suspicious situation reports can guide future surveillance detection operations by highlighting the times and/or locations that are generating the greatest apparent interest. It is always important to remember, though, there are the incidents that the analysts know about, and those that they do not. Suspicious situation reports generally reflect only a small percentage of all surveillance behavior. By identifying the times and/or locations associated with the greatest degree of apparent interest, as indicated by an increased number of suspicious situation reports, operational resources can be deployed. This has the potential to increase the amount of behavior that is documented through good, targeted surveillance detection.
It is always essential to review surveillance detection or suspicious situation reports within a larger context. Obvious changes, including surveillance detection training, reports that heighten awareness, or major incidents, can greatly impact natural surveillance and reporting and concomitantly influence the data. While high-profile events or recent training can increase awareness, apathy, complacency or frustration can decrease reporting. Efforts to maintain reporting and surveillance detection efforts can include reminders and refresher courses, particularly if personnel changes are frequent, to ensure that the information is valued and that attitude is conveyed to the frontline personnel.
Any analytical program, regardless of the sophistication of the analytical tools employed, will be severely compromised by incomplete, inaccurate, or unreliable reporting. You cannot analyze what you do not have, so it behooves the analyst to work with the larger team in an effort to ensure data quality to whatever degree possible. Finally, all results should be interpreted cautiously. Abundant domain expertise and a certain degree of caution is an asset to reviewing these data.
14.8 Bibliography
1. Carter, M. (2004). Why feds believe terrorists are probing ferry system. The Seattle Times, October 10. http://seattletimes.nwsource.com/cgibin/PrintStory.pl?document_id=2002058959&zsection_id=2001780260&slug=ferry10m&date=20041010
2. The National Commission on Terrorist Attacks Upon the United States, T.H. Kean, Chair (2004). The 9/11 Commission Report. www.9-11commission.gov/.
3. Joint DHS and FBI Advisory. (2004). Homeland security system increased to orange for financial institutions in specific geographic areas. August 1. www.dhs.gov/interweb/assetlibrary/IAIP_AdvisoryOrangeFinancialInst_080104.pdf
4. McCue, C., Parker, A., McNulty, P.J., and McCoy, D. (2004). Doing more with less: Data mining in police deployment decisions. Violent Crime Newsletter, Spring, 1, 4–5; McCue, C. and McNulty, P.J. (2003). Gazing into the crystal ball: Data mining and risk-based deployment. Violent Crime Newsletter, September, 1–2; McCue, C. and McNulty, P.J. (2004). Guns, drugs and violence: Breaking the nexus with data mining. Law and Order, 51, 34–36.
5. De Becker, G. (1997). The gift of fear. Little, Brown and Company, New York.
6. McCue, C. and McNulty, P.J. (2003). Gazing into the crystal ball: Data mining and risk-based deployment. Violent Crime Newsletter, September, 1–2.
7. Lind, W.S., Nightengale, K., Schmitt, J.F., Sutton, J.W., and Wilson, G.I. (1989). The changing face of war: Into the fourth generation. Marine Corps Gazette, October, 22–26.
8. Shapira, R. (2001). We are on the Palestinians’ map. Maariv (Tel Aviv), May 18.
9. Baker, J.C., Lachman, B., Frelinger, D., O’Connell, K.M., Hou, A.C., Tseng, M.S., Orletsky, D.T., and Yost, C.W. (2004). Mapping the Risks: Assessing the Homeland Security Implications of Publicly Available Geospatial Information, Rand Corporation.
10. Papyrus News. (2002). Fourth-generation wars: Bin Laden lieutenant admits to September 11 and explains Al-Qa’ida’s combat doctrine. February 10; https://maillists.uci.edu/mailman/listinfo/papyrus-news
11. McWilliams, B. (2003). Iraq’s crash course in cyberwar. Wired News, May 22.
12. Gellman, B. “Cyber-attacks by Al Qaeda feared.” Washington Post, June 27; http://www.washingtonpost.com/wp-dyn/articles/A50765-202June26.html
13. CIA caught sneaking cookies. (2002). CBSNews.com, March 20.