
13
Deployment
In many ways, the goal of force deployment is similar to most resource allocation decisions: try to do the most work possible with existing, or even fewer, resources, and try to have staff in place when and where they are needed. The deployment challenges facing police executives and command staff include maintaining public safety, efficiently allocating increasingly scarce personnel resources, and responding to citizen needs for appropriate police presence in their community.
Effective deployment of police resources can address all three challenges. By placing police units when and where they are likely to be needed, public safety can be increased. This can be achieved by the deterrent effect associated with police presence, as well as by the ability to respond quickly and rapidly apprehend criminals. Concomitantly, deploying police personnel when and where they are likely to be needed decreases the likelihood that they will be deployed frivolously or inefficiently. The inappropriate allocation of public safety resources can have tragic consequences if poor deployment decisions delay a timely response to an emergency. When crime is increasing, the first response can be calls for increased personnel resources and heavy deployment; however, many public safety agencies do not have the luxury of addressing rising crime with the indiscriminate use of resources, particularly given shrinking law enforcement budgets and diminishing personnel resources.
Unfortunately, police deployment decisions often are made based on historical precedence, gut instincts, citizen requests, or decisions made by uniformed policy makers. But addressing the need for police presence can be achieved with effective deployment strategies. Frequently when crime is escalating, the citizen outcry is for increased visibility. The quickest solution often seems to be increased deployment in those areas, increased foot patrols and a reemphasis on “community policing” in an effort to ensure that the citizens know that the police are there for them. It is interesting to note, however, that when things are going well, citizen interest in a strong (i.e., visible) police presence is not as great. In fact, a highly visible police presence might even be perceived as intrusive when crime is low. Therefore, reducing crime frequently addresses police visibility issues by reducing the perceived need for an additional police presence. Ultimately, this results in an actual decreased need for resource deployment in these areas, which further supports an overall plan of cost-effective resource allocation and savings.
Deployment can be divided grossly into patrol and tactical deployment, depending on the desired goal and associated tasks for these specific units.
13.1 Patrol Services
The general goals of police patrol deployment are to place officers in locations where they can respond rapidly to citizen-initiated work, or calls for service, while engaging in proactive policing. This could include everything from crime deterrence through police presence to routine patrol and participation in community policing initiatives. So, the ideal patrol deployment plan would place resources when and where they are likely to be needed, while simultaneously reducing deployment where the need is more limited. Because personnel resources, especially patrol resources, are the single largest expenditure in almost any public safety agency, appropriate allocation of this resource through effective, proactive patrol deployment can reap numerous benefits from both a personnel and fiscal standpoint.
13.2 Structuring Patrol Deployment
In reviewing the timing of citizen-initiated complaints, we noted that most agencies experience a typical cycle. On weekdays, calls might be steady throughout the day, picking up to a brisk pace in the evening, and then slowing down after midnight. This pattern might be altered somewhat on the weekends, particularly if the community has an active entertainment district or special events. For example, calls might continue after midnight, spiking for a period around the time that the various nightspots close and the patrons begin flowing out into the streets.
Complicating the model, however, is the fact that the specific nature of these calls frequently differs throughout the day. For example, there might be more commercial robberies during the day; an increase in domestic complaints when people return home from work in the evening; and more street robberies and vice complaints in the later evening. Activity after midnight might be confined almost exclusively to alarm calls. Moreover, the time required to clear a call and the personnel requirements for a malfunctioning alarm as compared to a highly charged domestic situation will differ greatly, so we cannot rely exclusively on call numbers. The nature of the complaint must be included in any analysis.
Seasonal fluctuations might bring an increase in the number of street robberies related to a large, transient tourist population, while bad weather can alternately suppress some types of crime while increasing others, and special events will bring unique issues all their own. The number of variables that can affect patrol deployment requirements is almost limitless, and each community will have its own unique array of issues and circumstances that impact police workload. It is easy to see that we have quickly exceeded the computational capacity of a pocket calculator or a simple spreadsheet program for determining demand for police services and related deployment strategies.
By using data mining and predictive analytics tools, analysts are able to consider multiple factors simultaneously and drill down to determine and characterize further the unique constellation of risk or activity associated with a particular area, location, or time period. It often can be interesting to see how the manifest patterns of activity and risk flow throughout time and space as the analyst drills down further, revealing additional detail and added refinement. This can be particularly true for relatively arbitrary distinctions like day of week. For example, what might appear to be unusual activity associated with a particular day of the week could merely reflect the continuation of activity from the previous day. Ultimately, through the use of classification models or scoring algorithms, decision rules can be created for the specific pattern of risk or deployment needs, which can guide the development of effective deployment strategies.
13.3 Data
There are some obvious data that should be included in a deployment model. For example, citizen complaint data frequently are the most direct representation of citizen-initiated police work. Beyond absolute numbers of calls, though, it also is important to include the number of officers required for each call, as well as the estimated time to clear a call. Any additional crime-related data also should be included in the model. For example, illegal narcotics or vice-related arrests might further enhance a deployment model by incorporating underlying crime that might not be manifest in citizen complaint data. This can be particularly true in areas where the issues associated with open-air drug selling pale in comparison to high rates of violent crime and might not be included in complaints.
This also is an opportunity to think outside of the box regarding what types of additional information might have value with respect to crime prediction. These resources have been mentioned previously but are worth repeating, as they can add considerable value to our analysis of crime data and ultimately result in more accurate, complete predictive models.
Weather and Climate Data
It was conventional wisdom in one police department that any sort of major weather event that restricted travel and confined people to their homes would be followed by a sharp increase in random gunfire. This point was mentioned to a new chief during preparation for a hurricane. Incredulous, he told the analysts to document this effect and report back to him when we had the numbers. Sure enough, the period during the storm was relatively quiet, save for a few folks trying to buy drugs, while the period immediately after the storm must have looked something like the OK Corral, based on the number of citizen complaints for random gunfire in the community.
While I could speculate regarding the true meaning behind the association between inclement weather and random gunfire, the truth is that I have absolutely no idea why this occurred in that particular community. The important thing is, however, that the relationship was noted and documented and could be anticipated and effectively responded to in the future. New Orleans, Louisiana, noted similar, unanticipated changes in criminal activity in the aftermath of Hurricane Katrina. Some of this was likely related to dramatic changes in geography, including the fact that large sections of the city were under water. Similarly, Houston, Texas, noted significant storm-related changes in its crime patterns and trends, including marked increases in some patterns of offending associated with the large numbers of displaced persons.
One advantage associated with some of the more powerful data mining and predictive analytics tools is their speed and agility. This gives the analyst the ability to crunch large, rapidly changing data sets quickly in response to rapidly changing situations like those associated with large manmade and natural disasters and the associated recovery and rebuilding periods. These new tools also allow for flexibility in recoding variables, including spatial data, which can be critical when the existing geography has been changed dramatically by a natural or manmade event.
Weather data usually are readily available and can add considerable value to a deployment strategy. For example, inclement weather might suppress some types of criminal activity that require that potential victims continue to engage in their routine activities. A severe winter snowstorm that significantly limitstravel would be expected to decrease the number of street robberies, since fewer potential victims will be out on the streets. On the other hand, the number of traffic wrecks associated with bad weather or hazardous driving conditions might place additional demands on traffic units and patrol. The ability to anticipate these changes in demand can facilitate a fluid transition from one operational plan to another, and from routine patrol deployment to a more reactive deployment mode that flexes residential patrol units to major thoroughfares in support of increased traffic workload.
A specific example illustrating how weather can affect crime trends and patterns is shown in Figures 13-1 and 13-2. A software tool that uses past criminal activity to predict areas in which crimes are most likely to occur generated the results in Figure 13-1, which illustrates the probability of crime by dispatch zone. The tool was developed by SPSS and Information Builders and is based on an analytical framework developed by RTI International. Lighter areas are associated with a greater probability of crime, while darker areas reflect a probability of little to no criminal activity. Using operationally actionable analytical products like these, command staff and managers can make information-based decisions regarding the allocation and deployment of patrol resources.
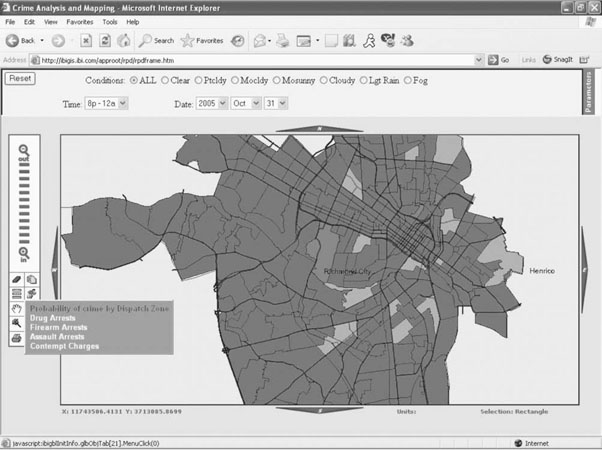
Figure 13-1 Map visually depicting the probability of crime by dispatch zone in Richmond, Virginia. (Screen image of the Information Builders’ Law Enforcement Application.)

Figure 13-2 Map highlighting the reduced probability of crime by dispatch zone, as compared to Figure 13-1, in response to a forecast of fog. (Screen image of the Information Builders’ Law Enforcement Application.)
As can be seen in Figure 13-2, adjusting the parameters to change the local weather conditions to “fog” results in a dramatic reduction in the probability of crime throughout the city. Commanders can use images like these to structure patrol deployment and resource allocation. Ultimately, these approaches can be used to develop fluid deployment models that can accommodate up-to-the-minute information regarding conditions and allow public safety and security organizations to assume proactive rather than reactive approaches to deployment.
Seasonal changes also can be associated with changes in demand in police services. Particularly cold weather might be associated with an increased number of vehicle thefts from residential areas as people preheat their cars in the morning, and very hot weather might be associated with a similar increase in stolen vehicles from convenience store parking lots or daycare centers as citizens leave their cars running in an effort to keep them cool. These and other trends can be identified, characterized, and modeled using data mining and predictive analytics. The associated scoring algorithms can be deployed with triggering mechanisms that would prompt an immediate modification in a deployment plan in response to changing conditions that are predicted to be associated with changing needs for police services. Personnel resources then can be flexed proactively, rather than being placed in a reactive position in response to changing conditions, which can significantly impair the efficient use of resources and result in poor service provision to the community. The weather department associated with the local news station almost certainly maintains archival weather data in an electronic format that would be suitable for inclusion in deployment modeling and analysis.
Census Data
Information related to population density, relative wealth, and other population-based measures can guide deployment strategies. For example, some patterns of larceny and economic crimes are more likely to occur in wealthier environments. On the other hand, increased population density will require heavier deployment, just based on the sheer numbers of people living in a particular area. Criminals frequently will search for a “target-rich” environment in which to commit their crime, whether a known open-air drug market or a residential area with an abundance of high-end electronics and vehicles. Therefore, while “target rich” might be defined as population density in one community and relative affluence in another, census data can provide a valuable addition to crime modeling.
Other information to consider when creating deployment models includes changes associated with transient population fluctuations. For example, resort communities or college towns can experience extremely large population fluctuations. Tourists often make easy targets for pickpockets and robbers, while college student populations might be associated with increases in illegal narcotics trafficking, alcohol and other vice-related offenses, and sex offenses, including date rapes. Anticipation of these population fluctuations could trigger associated modifications in patrol deployment plans, as well as proactive crime prevention strategies targeting these anticipated crime trends. Similarly, special events can create transient increases in patrol demand. Concerts or sporting events that are associated with disorderly crowds can be characterized and modeled, creating deployment strategies to target specific issues and challenges known to be associated with these particular events.
Domain expertise, as always, is critically important in the creation of deployment strategies. For example, communities with a thriving entertainment district or seasonal trends in tourism will require very different deployment strategies when compared to locations with rampant drug-related crime. There is no “one size fits all” deployment strategy that will have value and meaning for every locality. Even within the same city, crime might flex and flow around different areas during different times and be based on very different factors. Therefore, it is essential that all deployment-related data mining and predictive models be viewed and reviewed within the context of prevailing community issues and needs, or domain expertise. Resource deployment represents one of the most critical functions within any public safety organization, not only due to the personnel and economic assets involved, but because it can have such a critical impact on public safety.
13.4 How To
The first task when examining issues related to patrol deployment generally includes characterization of the data and information through the use of exploratory graphics,1 which allows the analyst to drill down into the data and convey relative differences visually. The use of graphics permits visual review and analysis of the information in a format that is inherently actionable from an operational standpoint.
Figure 13-3 shows that there were 266 citizen calls for service during the week selected for analysis. More than half of the calls (58%) were confined to the three-day period between Friday and Sunday. This initial analysis already adds some value and specificity to the understanding of the differential distribution of police work throughout the week, which has implications for deployment. By looking at this distribution, the command staff or supervisors can determine that three days out of the week accounted for more than one-half of the citizen-initiated police work during this week. Further analysis of the types of complaints, the number of units required, and the time to clear each call would add additional value to this analysis, although each of those factors would add another level of complexity to the analytical task and model, which would require increasingly powerful analytical resources. At a minimum, though, this analysis has value from a deployment perspective.

Figure 13-3 Frequency distribution depicting citizen calls for service by the day of week during a one-week period.
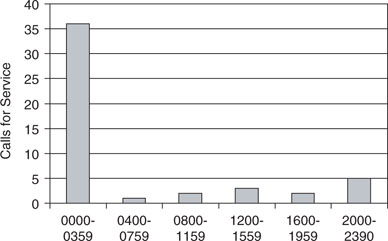
To further refine the specific deployment strategy, the information can be subdivided by time of day (Figure 13-4). For example, drilling down into the service calls reported on Sunday reveals that most of them occurred between midnight and 0400 hours. In other words, they represented a continuation of activity from Saturday night. This information, which indicates that the complaints are not distributed uniformly throughout the day in many cases, would have significant implications for deployment strategies. It also would be worthwhile to examine what specific types of calls were associated with different periods throughout the day, and what implications this might have for deployment. For example, alarm reset calls that occur in the middle of the night generally do not require extensive personnel resources and can be relatively quick to clear. A disorderly disturbance call associated with closing time at a nightclub, however, might require multiple units and take a considerable amount of time to clear, particularly if arrests are involved. Again, a specific analysis of time is important to ensure that adequate police resources are available when and where they are needed and that deployment is limited during times when the need for police presence is less.
Determining deployment requirements across day of the week and time of day certainly puts more science and less fiction into resource allocation, but a good deployment model also needs to take into account spatial differences in the need for a police presence. Figure 13-5 depicts a hypothetical police deployment schedule, which was extracted from a self-organizing network called a Kohenen network, that includes time of day and police district for a particular day of the week, in this case Friday. This model has been created through the use of an algorithm, which associates a relative degree of risk for crime associated with a particular time and location for the day of interest. Relative levels of risk for crime have been depicted visually as relative densities to fill in the various time blocks.

Figure 13-5 This figure illustrates a hypothetical police deployment schedule that includes time of day and police district for a particular day of the week, in this case, Friday. This schedule was created using the results of a self-organizing network called a Kohenen network.
As can be seen in the figure, Third District is associated with the greatest need on Fridays, from 1200 to 1359 hours. Examination of the data revealed that Gotham High was located in Third District, and that there had been a large fight during a football game with their uptown rivals, the Spartans from Groverville East. Further review indicated that this was a regular challenge associated with this time and location, and that heavier proactive deployment and some collaboration with the schools probably would address this issue.
The increased demand in Second District was linked to a regular after-work party each Friday near the business corridor, while the increased demand in First and Fifth Districts was associated with a large block of nightclubs that transcend the boundary between those two districts.
By incorporating time and space into a deployment schedule like the one illustrated in Figure 13-5, the analytical team was able to deploy the results of their data mining analysis into a format that was inherently actionable for the operational command staff. While additional options were available for further enhancements to the models by the inclusion of additional call-related details, this deployment model represents an information-based schedule that has considerable value over what had been used previously.
Figure 13-6 depicts a heat map (see Chapter 9) of different crimes over four-hour time blocks. These results indicate an increased likelihood of larcenies between 1600 and 2000 hours, while burglaries are more likely to occur between 0800 and 1200 hours.

Figure 13-6 This type of graph is referred to as a heat map, because relative differences in intensity depict relative differences in frequency or probability, similar to the relative differences used in temperature gradients. In this illustration, higher intensity conveys an increased likelihood of the particular type of crime (B. Haffey, SPSS, Inc.; used with permission).
This example was created to be relatively simple in an effort to highlight specific points. In the applied settling, a sampling frame longer than one week almost certainly would be used unless there were very specific reasons for choosing otherwise, such as the creation of a focused, short-term deployment model or initiative that was linked to a specific time period, similar to the New Year’s Eve initiative described previously. In addition, deployment models should be evaluated and refreshed periodically to ensure that they continue to address requirements for police-related work appropriately. In many ways, it can be a sign of success that the models need to be adjusted periodically. As crime patterns are addressed, suppressed, or displaced, the model needs to be refined and redeployed to accommodate the successes as well as new or rapidly emerging trends.
13.5 Tactical Deployment
Many agencies have tactical units that supplement standard patrol deployment. These units are not necessarily anchored to any particular geographic areas, like patrol units, which allows them to be rapidly mobilized and respond to crimes quickly and aggressively. Placing these tactical units when and where they might be needed serves two functions. First, response time is decreased, which increases the possibility of rapid identification and apprehension of the suspect. Second, and perhaps even more preferable, heavy deployment of these units in areas anticipated to be at greater risk for trouble might provide deterrence. As nice as it is to get bad guys off the streets, it is even better in many situations to prevent crime.
Identifying the Problem
One area where these units can be particularly effective is with narcotics-related or violent crime, which are linked in many situations. The basic approach to guiding tactical deployment with data mining and predictive analytics bears many similarities to the approaches used with traditional patrol deployment. The first step in the process generally involves the use of exploratory graphics in an effort to characterize the problem and drilling down in an effort to identify patterns of associated risk and possible solutions.
Several years ago, review of the homicide data from Richmond, Virginia, showed an extremely high homicide rate that placed it repeatedly in the top ten in the nation for its per capita murder rate. Several initiatives were created in an effort to address this problem, including a federally funded homicide reduction program. Research into the homicide rates confirmed what everyone knew to be true: that the homicide rate in Richmond was increasing rather dramatically when rates in other locations were decreasing.2 In and of itself, however, the overall homicide rate in a community generally contributes little value to a thoughtful understanding of the possible causes, nor are aggregate numbers likely to be associated with the development of any meaningful or long lasting solutions. Further inquiry was necessary.
Drilling down into the data, it became rapidly apparent that almost all of the increase noted over the examined time period could be attributed directly to increases in the drug-related homicide rates. This indicated that proactive measures designed specifically to address drug-related homicides would go a long way toward reversing these trends. Further parsing of the data indicated that at the same time that the drug-related homicide rate was increasing rapidly, the average age of the victims and suspects was decreasing. In other words, if violence is a disease, as it has been characterized so frequently, then drug-related violence is a disease that differentially impacts the young.3
Why is this important from a tactical deployment standpoint? If the goal of a particular initiative is violence reduction, then it is important to understand in some level of detail what is driving the trends and who is involved. In this example, the rapid increase in the murder rate could be attributed directly to an increased prevalence of drug-related homicide. Drugs, violence, and drug-related violence can be addressed with relative efficacy through the use of strategies and initiatives that incorporate the use of tactical patrol units. Therefore, characterization of the problem provided some direction regarding possible solutions. Had the increases in the homicide rates been associated with the activity of a serial killer or with domestic violence, different strategies would have been indicated. So, characterizing the problem is frequently the first step in identifying a meaningful solution.
13.6 Risk-Based Deployment Overview
More recently, the Richmond Police Department has been exploring the use of “risk-based” deployment strategies as part of their role in the Project Safe Neighborhoods initiative with the United States Attorney General’s Office in the Eastern District of Virginia.4 A detailed example of this approach is discussed later in this chapter, but the fundamental idea behind this approach is that if a model of relative risk can be created, personnel resources can be proactively deployed in response to this anticipated risk. In other words, if it is possible to characterize and anticipate violent crimes, tactical units can be deployed proactively and make rapid apprehensions due to their proximity in time and space to the predicted crime locations. Ultimately, increased use of this method provides an opportunity to move into proactive policing, whereby crime can be deterred or even prevented.
13.7 Operationally Actionable Output
As has been stated several times before, any analysis, no matter how elegant, sophisticated, or accurate, has no value in an operational environment if it is not actionable. The output shown in Figure 13-7 has limited value in an operational setting in its current form. In order for it to gain value it needs to be actionable; it needs to be apparent from looking at the analytical output which course of action would be best. This is particularly true with deployment. Outlined in the following sections are two possible mechanisms for deploying analytical output products directly into the operational environment in a format that can be used readily.

Figure 13-7 Some analytical output products, while accurate, can be very difficult to interpret and deploy with in an operational environment(B. Haffey,SPSS, Inc.; used with permission).
Web-Based Analytics
New improvements in the deployment of predictive analytics outputs and rule sets now allow the use of web-based analytics.5 With these systems, an analyst is able to analyze data and create rule sets or scoring algorithms that can be deployed remotely. The end users are then able to log on through a secure Internet or intranet connection. As illustrated in Figure 13-8, they are directed to a data entry screen, which prompts them to enter a few relevant details through the use of pull-down menus. For example, a supervisor can enter information relative to the time, day, and assigned location associated with her shift. Based on the calculated risk for each area within her purview (Figure 13-9), the supervisor then can proactively deploy resources in anticipation of likely activity or anticipated risk.

Figure 13-8 Web-based data entry screen that can be used for remote access to scoring algorithms. (Screenshot of web interface taken by the author is from Cleo, SPSS, Inc.)

Figure 13-9 Web-based output generated by a remotely deployed scoring algorithm in response to the input depicted in Figure 13-8. (Screenshot of web-based output taken by the author is from Cleo, SPSS, Inc.)
This system is no more difficult to use than making an online purchase. In many ways, it is much easier than using the remote data entry systems that many organizations have adopted, in that the amount of information required for this transaction has been limited significantly. The only data required by the model is the information determined to be relevant and necessary by the deployed algorithm. Additional nonessential data entry is minimized, which can be extremely important in an operational setting. After the information has been entered, the output is available quickly, with form and content that is relevant to the situational needs of the end user.
The advantages of a system like this are numerous. First, operational personnel gain access to analytical support on a 24/7 basis. Crime frequently occurs at times when civilian analytical personnel are not on duty. To wait until they return can create an unacceptable delay, particularly in fast-breaking cases or those requiring analysis in a timely fashion. In addition, these systems can be deployed remotely. For example, the data can be analyzed and the models developed in centralized areas far behind the front lines. Scoring algorithms can then be deployed directly to operational personnel in their environment. This maximizes analytical personnel resources, while diminishing associated analytical support requirements through the establishment of analytical fusion centers that can be used by multiple operational units. Crime analysis functions can be centralized and available to remote precinct locations and offsite specialized units, as well as centrally located command units. This analytical utilization model ensures that even remotely located operational units have access to the full analytical capacity of the organization, without unnecessary duplication of analytical personnel, resources, and support.
Furthermore, as can be seen in Figure 13-10, utilization of centralized analytical capacity and remote deployment of scoring algorithms and models also facilitates the integration of different types of data and information. Crime frequently transcends traditional offense definitions and arbitrary boundaries.6 Prostitutes use drugs, drug users rob convenience stores, and gang members commit violent crimes. While a certain degree of operational specificity often is required, a common analytical resource can integrate data and information on related crime patterns and trends. The resulting models will be significantly enriched through the use of these various related informational resources, which then can be deployed directly to the various operational end users through the use of these web-based deployment tools.

Figure 13-10 Centralized analytical capacity and the remote deployment of scoring algorithms and models can facilitate the integration and deployment of different types of data and information.
Web deployment of data mining models also permits the use of more complex scoring algorithms, because the scoring algorithms do not need to be interpreted directly to have value. This provides the opportunity to use relatively opaque or “black box” models with a greater degree of accuracy. The end user need only enter the limited amount of information for use in the predictive rule set. This arrangement affords a high degree of accuracy through the use of relatively sophisticated modeling techniques, while requiring limited end user training and data entry.
Mapping
The ability to effectively convey the results of data mining can determine whether the results are used operationally or not. If the command staff, operators, or other end users are not able to interpret the results, it significantly limits the utility of the analysis. The “generalizability versus accuracy” challenge has been addressed earlier; however, even a relatively simple predictive algorithm has limited value if it cannot be used as actionable information. One excellent tool that can be used to add value to the results of data mining is mapping. Maps can be thought of as specialized graphs that convey information within an operational context.
Deployment of data mining and predictive analytic products through mapping are highlighted throughout this text. From a deployment standpoint, however, there are few systems that even approach the effectiveness and functional utility associated with mapping. Through the use of color, shape, shading, and other options, a tremendous amount of information can be conveyed through a two-dimensional mapping product.
Many patterns of offending tend to be geographically dependent. For example, certain locations are associated with open-air drug markets, while others might be linked to an increased likelihood of robberies. This information has tremendous value from a deployment perspective because, at its most primitive, deployment generally involves placing personnel resources in time and space. Ideally, personnel are deployed in response to anticipated patterns of offending or calls for service, something that data mining and predictive analytics can facilitate. Through the creative use of mapping tools, meaningful differences in time and space can be conveyed in an actionable format to operational personnel.
Data mining and mapping tools are evolving at a rapid pace. At the time of this writing, data mining tools were being developed specifically to deploy generated algorithms directly into a mapping environment. While it is possible to do this with “brute-force” techniques now, this alternative approach will allow for a more detailed depiction of risk, as well as the inclusion of a larger number of parameters. For example, without these enhanced mapping techniques, the analyst would be required to develop one map for each four-hour time block during each day of the week; that amounts to 42 different maps to convey a week’s worth of information. This would be a tremendous amount of work and would severely limit the amount of detail in each map. Moreover, the necessary flipping between maps would be operationally cumbersome.
The ability to deploy data mining algorithms directly through mapping products would decrease the amount of work required for each map, shifting the focus to the value of the algorithm and increasing the amount of detail available with each map. Ultimately, using these techniques, it would be possible to create a dynamic map that could depict “clouds” of risk moving throughout the community depending on the time of day and day of week, similar to the weather maps that highlight changing patterns and trends that also change with time and day. Ideally, the command staff and other planners would be able to scroll fluidly through these maps, determining deployment while considering a variety of different scenarios. The use of touch-screen technology that could activate additional embedded models would further enhance this rapidly developing technology. The opportunity to develop the predictive algorithms in a centralized location with access to a range of data and intelligence would increase the value of these tools even more. Deployment of these maps directly into the field would provide actionable analysis directly into the theater of operations, thereby concurrently increasing situational awareness and informed decision making. These dynamic crime deployment maps would require a greater degree of deployment fluidity, but would maximize personnel resources in a manner not currently possible.
Figure 13-11 depicts a temporally compressed version of this type of map. This figure depicts three temporally distinct patterns of crime, associated with unique locations. By using different sizes of risk “clouds,” as well as differential shading, differing levels of risk or anticipated frequency can be conveyed within a two-dimensional representation of information. Review of this map highlights relative changes in expected criminal activity or citizen-initiated complaints. Specifically, a greater level of activity is associated with the nightclub area by the beach on weekend nights (A), while a need for increased deployment shifts to the business corridor during weekdays (B), and the associated residential areas on weekday evenings (C). Relative differences in intensity and area on the map correspond to relative differences in risk and indicate a need for greater police resources in the residential area, as compared to the business corridor, and finally the nightclub area.

Figure 13-11 These maps illustrate the distribution of crime over time and space. Relative differences in intensity and area on the map correspond to relative differences in risk and indicate a need for greater police resources in the residential area, as compared to the business corridor, and finally the nightclub area. Specifically, a greater level of activity is associated in the nightclub area by the beach on weekend nights (A), while a need for increased deployment shifts over to the business corridor during weekdays (B), and the associated residential areas on weekday evenings (C).
Ideally, this information would be depicted in a series of maps that would transition smoothly and further illustrate the relatively fluid nature associated with the movement of crime throughout a community across the time of day and day of the week. This kind of direct linking of data mining and mapping software further increases the amount of information that can be conveyed, as compared to the brute-force techniques that require manual entry of the various densities depicting risk.
Through the creative use of mapping and information-based deployment strategies, resources can be allocated to specific locations associated with increased activity or risk. They also can help further characterize the problem and guide additional targeted responses. For example, increased activity linked to a particular location within a multifacility complex might suggest the need for some environmental changes, such as increased lighting, in addition to heavier patrol in the area. On the other hand, activity associated with a single unit in the same building might suggest a different type of intervention, such as counseling or eviction procedures for the identified tenants, which would not necessarily require additional patrol.
Mapping need not be confined exclusively to traditional geographic boundaries. For example, “maps” can be generated for facilities or complexes, or even single buildings associated with differentially distributed risk. These maps can facilitate the identification of specific patterns of offending or risk associated with particular times and/or specific locations. This type of map can be extremely useful for personnel deployment or specifically targeted crime prevention strategies. For example, in Figure 13-12, police calls for service are concentrated on one end of the Happyland Apartments building. Additional investigation might indicate the need for increased lighting in this area or perhaps a review of possible problem tenants. Further refining the map by including a time of day or day of week dimension might reveal additional information regarding this citizen-initiated police work that would have direct implications for deployment, as well as possible proactive crime prevention work that could reduce the complaint burden associated with this particular location. Depicting information in a mapping format adds value to the information by placing it within a spatial context and facilitates information-based deployment decisions, as opposed to traditional reactive responses.
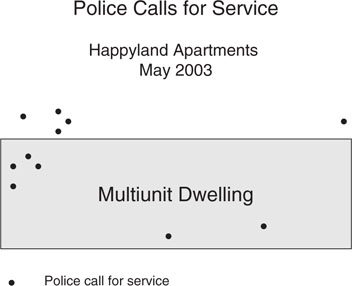
Figure 13-12 Police calls for service can be mapped in an effort to illuminate possible cause and support related crime prevention strategies.
Further enhancements with predictive algorithms might provide additional guidance regarding which approaches could be particularly well-suited to a particular challenge. Similar to treatment matching in medicine and psychotherapy, we now know that there is no “one size fits all” approach to crime reduction. These types of analyses are conducted regularly within the public safety environment; however, the combination of data mining and integrated mapping further automates this process, which reduces the amount of time and effort necessary to conduct these types of value-added, operationally actionable analyses. Therefore, in the Happyland Apartments example, evaluation of previous outcomes in similar situations might provide additional guidance regarding the approach or intervention most likely to succeed under this particular set of conditions.
13.8 Risk-Based Deployment Case Studies7
“Telling the future by looking at the past assumes that conditions remain constant. This is like driving a car by looking in the rearview mirror.”
Herb Brody
The idea behind the use of highly mobile tactical units is their ability to respond quickly to rapidly changing events. Unlike traditional patrol units, which tend to be anchored to a particular geographic area, tactical units can be deployed proactively to areas in anticipation of an increased need or a rapidly emerging situation. With this in mind, it would seem ideal to identify a way in which trouble could be anticipated. This would support the concept of proactive deployment, at a minimum permitting a rapid response to incidents. Ideally, heavy deployment in these areas would result in crime deterrence.
In many situations, “proactive” deployment decisions are based on a historical review of crime patterns, including pin maps. While these can be great for counting crime and depicting it within the context of geography, they do little to inform us of the future. By using data mining and predictive analytics, however, areas associated with an increased risk for certain types of crime can be modeled and mapped. This might seem like such a subtle distinction as to have no value in law enforcement, but read on.
The Richmond, Virginia, Police Department, as part of the Project Safe Neighborhoods strategy, began developing the use of risk-based deployment strategies in an effort to reduce gun violence. As the thinking goes, if armed robberies are bad, then an armed robbery where the victim gets hurt is worse.8 Is there a way to model this so that we can deploy our tactical units proactively and keep people safe? The challenge was that the created model had to be simple enough to be actionable. It also had to be confined to variables that had value from a deployment standpoint. For example, it might be that robbers who are verbally aggressive with their victims are more likely to assault them, but a police department cannot proactively deploy for aggressive robbers, so this particular variable had little value from a deployment standpoint.
Information pertaining to geography, time of day, and day of week were included in the analysis, while almost everything else, including type of weapon and suspect-related information, was excluded. The resulting model was relatively accurate, although not perfect. It should be noted that more accurate models were developed and deployed through the web-based analytics described earlier,9 but the associated algorithms were too opaque to be deployed directly into the operational environment.
At this point, some very good questions might be, “Does it matter that the accuracy is reduced?” or “How low can you go?” This issue has been addressed in much greater detail in previous chapters because it is extremely important. Briefly, in this case it was determined that anything that would increase the efficacy of the deployed resources above chance would be considered acceptable, because even a slight increase in public safety associated with the use of the model could potentially save lives. For that reason, the errors associated with the model were shifted toward being somewhat generous in terms of deployment. The consequences associated with missing a potentially high-risk circumstance were determined to be much more serious than deploying resources to an area where they might not be needed. So the model was adjusted to permit more “false positives” in an effort to increase the likelihood that the personnel would be in place when and where they were needed.
Another challenge associated with this deployment initiative was the fact that armed robbery-related aggravated assaults are relatively infrequent. While this generally is a very good thing for a community, particularly for potential victims, it can be a significant challenge from a modeling perspective. There were a relatively limited number of incidents of interest for use in the creation of the model. In addition, it was important to ensure that the number of incidents predicted were similar to the frequency of observed events. Many modeling algorithms are preset to a 50:50 distribution, which would be extremely inaccurate in the current situation.
For this same reason, close attention to the nature of the errors was extremely important. Because less than 5% of all armed robberies in our sample escalated into an aggravated assault, it would have been possible to create a very simple algorithm that was correct 95% of the time by simply predicting that an armed robbery would never escalate. While the accuracy associated with this model would be enviable, particularly in an applied setting like ours, it would do little to inform the deployment process, which would mean that it has no value.
Another challenge associated with such a low incident rate was the creation of separate training and test samples, which is addressed in detail in Chapter 8. In the current example, the sample was randomly split into training and test samples. These samples were then evaluated to ensure that the factor of interest, robbery-related aggravated assaults, was distributed evenly and that there were no unusual differences between the two groups. Because the samples were so small, these group assignments were subsequently maintained throughout the modeling process.
Because risk-based deployment maps are investigatively sensitive, the map depicted in Figure 13-13 does not include real data. Rather, it depicts how a possible distribution of robbery-related aggravated assault risk might look throughout a community.

Figure 13-13 This figure illustrates a fictional risk-based deployment map.The differential grades of shading used on this map highlights areas that are predicted to be at greater risk for a robbery-related firearms assault(B. Haffey,SPSS, Inc.; used with permission).
The differential grades of shading on this map highlights areas that are predicted to be at greater risk for a robbery-related firearms assault, based on a review of the armed robbery data for a six-month period. It is important to note, however, that the areas highlighted on the map are not predicted to be associated with an increased number of armed robberies; rather, the armed robberies in these areas are predicted to be more risky. This is an important consideration for the type of deployment and this particular strategy. Traditional deployment models generally consider only the frequency of crime and deploy accordingly. With specialized units, however, there is tremendous advantage in being able to deploy based on predicted risk of more serious crime, rather than relative frequencies of multiple patterns of offending. Therefore, by using a risk-based deployment strategy, areas predicted to be at greater risk for more serious patterns of offending are identified and highlighted for selected, tactical enforcement strategies, while patrol resources can be deployed in response to other types of crime and citizen-initiated work.
With even more advanced technology, time can be added as a dynamic feature in these maps. The supervisor or commander can scan through the various maps in a very efficient manner, easily seeing locations and times where heavier deployment might be required. This affords a tremendous amount of extremely fluid information that can be used for targeted troop deployment in direct response to anticipated risk or workload.
Finally, in our experience it has been necessary to periodically refresh the models. Conditions change in the community and criminals are apprehended, which can serve to diminish the predictive efficacy of the models. This can be a sign of tremendous success.
These models evaluated reasonably well using training and test samples; however, it was difficult to generate a measurable outcome, particularly given the nature of this relatively low-frequency event. The question inevitably is asked, “How has this improved public safety?” Therefore, a different type of risk-based deployment strategy was developed for the 2004 New Year’s Eve holiday; one that incorporated embedded outcome measures.10
The New Year’s Eve holiday frequently is associated with increased reports of random gunfire. Therefore, in an effort to increase public safety over New Year’s Eve, a risk-based deployment strategy was developed as part of the Project Safe Neighborhoods initiative with the United States Attorney’s Office in the Eastern District of Virginia. Briefly, Project Safe Neighborhoods is a violence reduction strategy that has been instrumental in supporting the use of data mining and risk-based deployment strategies in the development of innovated approaches to reducing gun violence.
To create this targeted strategy, random gunfire complaints from the previous year were examined. By drilling down into the data, a unique array of activity across time and space emerged that resulted in the development of a specific, targeted, risk-based deployment strategy. Examination of the activity patterns revealed that almost all of the increase in random gunfire complaints occurred between 2200 hours on New Year’s Eve and 0200 hours the following day. While this made intuitive sense, this was the first time that the temporal patterns of activity had been examined in this manner. As a result of this finding, the risk-based deployment initiative was confined to an eight-hour period bracketing the period anticipated to be associated with the most work.
Within this time period, activity across specific policing beats was analyzed further. The beats were rank ordered by relative activity during the previous New Year’s Eve holiday, and the top locations were selected for increased deployment. Recent trends and patterns also were analyzed in an effort to identify any areas that might be ramping up or experiencing significant increases in activity that might require more attention during the holiday. Through this approach, additional locations were identified and added to the list.
A final list was developed that included areas previously associated with increased random gunfire complaints during the New Year’s Eve holiday as well as additional areas showing recent increases in random gunfire. An operational plan was developed and implemented using a “beat-stacking” approach, which included heavy patrol and the deployment of additional tactical units in the areas determined to be at elevated risk for random gunfire.
The results of the initiative supported the use of this type of risk-based deployment strategy for targeted deployment. Random gunfire complaints were decreased by 47% on New Year’s Eve and by 26% during the entire two-day holiday. Moreover, the number of weapons recovered during the initiative was increased from 13 the previous year to 45 during the initiative—an increase of 246%. To ensure that the random gunfire reductions were specific to the initiative, the period immediately prior to New Year’s Eve was analyzed. A comparison between the random gunfire complaints revealed no differences between the two years.
Perhaps the most encouraging outcome measure involved the personnel resources used for the initiative. As a direct result of confining the initiative to an eight-hour period and the use of a risk-based deployment strategy, the number of required personnel was decreased significantly. By specifically targeting personnel resources, approximately 50 sworn employees were released from duty over the holiday, which resulted in a economic savings of approximately $15,000 in personnel costs and associated holiday pay during an eight-hour period. Further information related to the outcome evaluation associated with this very successful initiative has been addressed in greater detail in Chapters 6 and 8.
Homeland Security and Deployment
The war on terrorism has generated a variety of new challenges for law enforcement agencies attempting to protect our homeland, while addressing routine crime issues that generally defined their purview prior to 9/11. Perhaps one of the biggest challenges is stretching already diminished personnel and budget resources to accommodate the additional responsibilities associated with the war on terrorism. The concept of fourth-generation warfare and implications for local law enforcement is discussed in Chapter 12; however, the direct impact on resource allocation and deployment can be understood regardless of the cause.
Prior to 9/11, most agencies were in the unenviable position of doing more with less, particularly with diminishing economic resources. After that date, local agencies increasingly became responsible for collecting and compiling additional data and information, increased deployment related to sensitive or high-profile locations, and periodic escalation in readiness associated with heightened threat levels. Moreover, agencies already coping with limited troop strength lost additional personnel to military activation, federal hiring, and reallocated resources to homeland security tasks and task forces.
Doing more with less requires smart, data-based, results-driven deployment strategies. Personnel resources, in particular, need to be allocated judiciously to ensure complete coverage and maintain the ability to respond adequately. This is true not only for routine patterns of offending and enforcement but for rapidly emerging homeland security-related functions as well. Data mining, predictive analytics, and similar information-based deployment strategies facilitate the provision of more science and less fiction in personnel deployment. Similarly, further enhancements and integration of data mining and mapping software offer additional opportunities for the development of actionable deployment strategies that can move from the analysis unit directly into the operational environment.
13.9 Bibliography
1. Helberg, C. (2002). Data mining with confidence, 2nd ed. SPSS, Inc., Chicago, IL.
2. McLaughlin, C.R., Robinson, D.W., and Faggiani, D. (1998). Declining homicide rates in the 1990s: Not everywhere! Academy of Criminal Justice Sciences.
3. McLaughlin, C.R., Yelon, J.A., Ivatury, R., and Sugerman, H.J. (2000). Youth violence: A tripartite examination of putative causes, consequences and correlates, Trauma, Violence & Abuse, 1, 115–127.
4. McCue, C. and McNulty, P.J. (2003). Gazing into the crystal ball: Data mining and risk-based deployment. Violent Crime Newsletter, September, 1-2.
5. McCue, C. and Parker, A. (2004). Web-based data mining and predictive analytics: 24/7 crime analysis, Law Enforcement Technology, 31, 92–99.
6. Faggiani, D. and McLaughlin, C.R. (1999). A discussion on the use of NIBRS data for tactical crime analysis. Journal of Quantitative Criminology, 15, 181–191.
7. McCue and McNulty.
8. Ibid.
9. McCue and Parker.
10. McCue, C., Parker, A., McNulty, P.J., and McCoy, D. (2004). Doing more with less: Data mining in police deployment decisions. Violent Crime Newsletter, U.S. Department of Justice, Spring, 1, 4-5.