
7
Predictive Analytics
In their Worldwide End-User Business Analytics Forecast, IDC, a global provider of market intelligence, divided the market and distinguished between “core” and “predictive” analytics.1 Core analytics are described as those tools that “analyze a current or past state,” generally focusing on descriptive statistics, query, and reporting. Predictive analytics, on the other hand, “are used to determine the probable future outcome of an event or the likelihood of a current state where it is unknown.” These tools incorporate more sophisticated analytical strategies, and include data mining and modeling.
By using data mining, we can begin to characterize and describe trends and patterns that reside in data and information. While this might help us gain a better understanding of crime or intelligence data, it is limited in terms of the actionable intelligence or predictive models that can be obtained. To be able to anticipate, predict, and ultimately prevent bad things from happening in the world, we need to be able to develop accurate and reliable models. Predictive analytics encompasses a variety of model making tools or algorithms that can be employed to characterize historical information, which then can be used to predict the nature and likelihood of future events or occurrences. In other words, although the focus has been on “connecting the dots,” that is only part of the task. What we really need to do is to connect the dots and use the resulting picture to predict the next image or scenario so that we will have a chance to alter the future and prevent something bad.
7.1 How to Select a Modeling Algorithm, Part I
Although a complete understanding of exactly how these algorithms work is well beyond the scope of this text, a general understanding of the broad categories of modeling tools can help the analyst select the proper tool for the job. Just as you do not want to bring a knife to a gunfight, you probably do not want to use a neural net for a deployment model.
Selection should be a balance between availability and appropriateness of the particular modeling tool. It would be naïve to insist that the algorithm selected should be based exclusively on the best fit for the particular data set and desired outcome, because most agencies do not have unlimited access to modeling tools. But confining analysis to only what is available because it is available is probably just as inappropriate. Relegating analysis to last place and relying only on what is inexpensive or readily available is frequently the most expensive “cheap fix” in the public safety community. The best compromise is to anticipate routine tasks and purchase the necessary analytical software to address this work appropriately. The personnel savings associated with the use of data mining and predictive analytics in deployment strategies is documented in Chapter 13. Similarly, the emergence of regional fusion centers has highlighted not only the enhanced analytical capacity but also the critical need for powerful analytical tools given the increasing complexity of the data, as well as opportunities for cost sharing across jurisdictions and/or agencies. Therefore, the savings associated with information-based decisions and shared resources can be used to expand analytical capacity.
7.2 Generalizability versus Accuracy
Another important consideration in the selection of a specific modeling tool includes the anticipated or desired use of the results. The topic of accuracy versus generalizability was addressed in Chapter 1; however, it is worth revisiting within this context. Neural networks are truly amazing. That software engineers can even approximate human cognitive processing is a phenomenal achievement in the field of artificial intelligence. The fact that these networks can be used in a PC environment with limited analytical training, albeit abundant domain expertise, was unthinkable even a few years ago. Unfortunately, neural networks have somewhat limited utility in many of the necessary public safety functions because they are relatively opaque. In other words, it is not possible to just look at a neural net and understand the nature of the associations, which significantly limits their applicability in certain tasks. Therefore, in many situations it is important to compromise somewhat on accuracy in an effort to identify an actionable model that can be used in the operational setting. While it is possible to run a scoring algorithm behind the scenes using web-based or remote analytical applications, the balance between accuracy and generalizability frequently guides model selection.
On the other hand, rule sets or decision trees can be relatively intuitive, such as “If X happens, then Y is likely to follow,” “Indicators suggesting overkill generally imply anger or a personal relationship between the victim and perpetrator,” and so on. Even rule sets, however, can become extremely difficult to interpret as the number of variables and options increase and the associated model becomes progressively more complex. These rule sets often need to be relatively transparent to ensure that they will be actionable and have value for the end users.
There are numerous algorithms that can be used, some specific to their associated analytical tool sets or software packages. Those described in the following sections include only a sampling but should represent a good starting point for consideration of specific application, desired outcome, and what is likely to benefit each particular organization. Specific examples of these modeling algorithms are highlighted in other chapters throughout the text.
7.3 Link Analysis
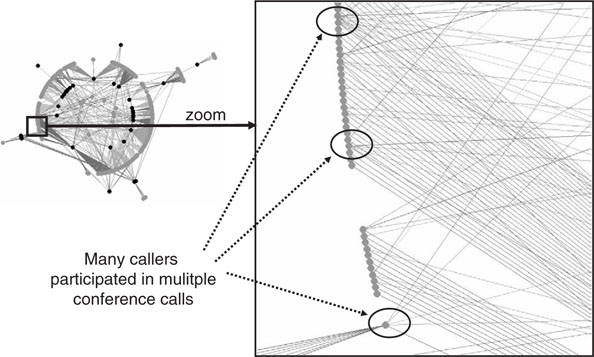
Link analysis tools can be used to identify relationships in the data. With a limited number of observations, association matrices and link charts can even be done by hand. As the number of observations increases, though, automated methods usually are required. These tools can be relatively inexpensive and may represent an economical point of entry into data mining. Given this particular benefit, many public safety agencies already use some sort of link analysis tool to analyze telephone call data. As can be seen in Figure 7-1, which illustrates an analysis of the conference call data covered in Chapter 6, associations or links can be depicted visually to help illuminate particular relationships in the data. As shown in Figures 7-2 and 7-3, expert settings in some packages allow the analyst to highlight different relationships or examine some associations in greater detail. There are some limitations to link analysis; however, domain expertise and a good understanding of the concept behind link analysis can help the analyst interpret the results. Some common pitfalls associated with link analysis and their remedies are outlined in Chapter 3.


7.4 Supervised versus Unsupervised Learning Techniques2
While this is somewhat simplistic, modeling algorithms can be divided generally into supervised and unsupervised learning techniques. Briefly, with supervised learning techniques, the goal is to develop a group of decision rules that can be used to determine a known outcome. These also can be called rule induction models, and they include classification and regression models. Supervised learning algorithms can be used to construct decision trees or rule sets, which work by repeatedly subdividing the data into groups based on identified predictor variables, which are related to the selected group membership. In other words, these techniques create a series of decision rules that can be used to separate data into specific, predetermined groups. The use of classification models in automated motive determination is described in Chapter 11. Some modeling algorithms are designed specifically for categorical data, while others can accommodate numeric as well as symbolic data. Rule induction models that can accommodate continuous data still end up parsing them into categories by identifying breaks, or establishing “cut points,” in the range.
7.5 Discriminant Analysis
Discriminant analysis is covered in more detail in Chapter 11. Briefly, one of the assumptions of this model is that the data are categorical. This assumption can be violated with a certain degree of confidence given the relative strength of the algorithm and the nature of the errors likely to occur. Specifically, the type of error more likely to occur if the assumptions are violated with discriminant analysis is a failure to find a relationship in the data even though one may exist, and it is almost always better for the analysis to come up empty than to identify a spurious or false relationship in the data.3 I mention this point not to suggest that the analyst should habitually violate rules and assumptions associated with modeling algorithms. Rather, I wish to highlight two key points about predictive analytics and the associated modeling algorithms. First, some of the rules and assumptions associated with these techniques are more important than others, and it is possible to exercise some discretion with the statistical algorithms. And second, these tools are designed to identify and model relationships in the data. The type of error most likely to occur is a failure to identify a relationship when one actually exists. While this may be frustrating and even limiting if the analyst is being asked to provide information-based support for a particular operation or investigation, unreliable, inaccurate, or spurious findings carry a far greater risk to public safety in most situations.
7.6 Unsupervised Learning Algorithms
Unsupervised learning algorithms are used to group cases based on similar attributes. These models also are referred to as self-organizing maps. Unsupervised models include clustering techniques and neural networks. Different algorithms use different strategies for dividing data into groups. Some methods are relatively straightforward, quickly dividing the cases into groups based on common attributes or some other similarity. The Two-Step clustering method differs somewhat in that an optimal number of clusters is determined in an initial pass through the data, based on certain statistical criteria. Group assignment is then made on a second pass through the data; hence the name “Two-Step.” Neural networks are more complicated than some of the other unsupervised learning algorithms and can yield results that are difficult to interpret.
Cognitive Neuroscience and Neural Nets
“My religion consists of a humble admiration of the illimitable superior spirit who reveals himself in the slight details we are able to perceive with our frail and feeble mind.”
Albert Einstein
For as long as I can remember, I have been fascinated by science and the wonders of the universe. From stargazing in the backyard with the homemade telescope that my father and I built to the absolute awe that I experience when contemplating the vastness of the cosmos and the subtle elegance of nature, I have been hooked on science from the start.
During college I began to focus my interest on neuroscience and the brain. What an incredible machine! As I sit here now I can recall the muffled quiet of my first snowfall at Dartmouth, the sound of a lawnmower running on a Saturday morning from my childhood in Downers Grove, Illinois, and the smell of fresh cut grass. I can see the windows steam up in our kitchen on Thanksgiving, and smell my mother’s turkey, which I never have been able to replicate. The truly amazing thing about all of this, though, is that all of these memories, including their associated sights, smells, and sounds, reside in a mass of biological material sitting between my ears that basically has two settings: on and off. Some might argue that neuromodulators and other similar entities complicate the situation somewhat, but the bottom line is that neurons, the basic components of our brains, are either on or they are off. Like a computer, it is this combination of “on” and “off,” the interconnectedness of these simple elements and the associated parallel processing, that gives us the complexity of what we know to be brain function.
While I do not necessarily hold the conviction with Descartes that the seat of my soul resides somewhere at the base of my brain, I do know that everything from unconscious activities like breathing to my preference for the color green sits up there with rarely a conscious thought from me. More to the point, I know that the individual differences that make the world so interesting, as well as the similarities both between and within humans and their behavior that allow me to do my job as a behavioral scientist, also reside in this neural computer.
Analysts spend a considerable amount of time trying to categorize and model the complexities of human behavior. This practice is complicated even further for crime analysts because the behavior being modeled differs in some way from “normal” behavior, if only for the reason that it is illegal. In additional, criminal behavior tends to be relatively infrequent and is something that most folks have limited experience with outside of the public safety and security worlds. The ability to reduce these behaviors to patterns and trends that can be not only described but even anticipated or predicted in some situations still amazes me because it says as much about human nature as it does about analysis. In many ways, predictive analytics and artificial intelligence are fascinating in their power and complexity, but perhaps the real wonder is the fact that human behavior can even be modeled and predicted at all.
The most incomprehensible thing about the world is that it is comprehensible.
Albert Einstein
7.7 Neural Networks
One of the most fantastic things about nature is her ability to create complexity with unique combinations of a few simple elements. With a few exceptions and some variation, the entire complexity of the human brain is created with two simple elements: neurons and synapses, the connections between neurons. All of our memories, our ability to engage in routine tasks like driving or playing a musical instrument, our capacity to think, even our sense of humor comes down to unique combinations of neurons or synapses.
As the field of cognitive neuroscience has developed and progressed, scientists have been able to replicate some elements of human cognition. The brain is composed of a relatively small number of common elements. It is the complex arrangement of these fundamental building blocks, the neurons, that achieves the tremendous complexity that we associate with the human brain and cognition. In some ways, the brain can be compared to the “Six Degrees of Kevin Bacon” game. Just as you can connect Kevin Bacon to any other actor with six or fewer links, neuroscientists often brag that they can connect any two locations in the brain with only a few synapses. It is these connections that add the complexity necessary to model complex processes and data. Figure 7-4 depicts a very simple neural network. This particular network includes an input layer with four neurons, a hidden layer with three neurons, and an output layer with two neurons. More complex models could incorporate additional hidden layers, which greatly increases the possible numbers of connections and associated complexity of the model. This ability to layer connections adds a tremendous degree of additional complexity using only a few common elements. Complexity is achieved through the nature of the relationships and the relative strength of the associations, which can result from repeated use or learning.

We see this repeated throughout nature and even behavior. Computer scientists have been able to replicate certain aspects of neural processing through the development of neural network algorithms. While perhaps simple in their basic elements, these sophisticated algorithms can be used to model extremely complex associations and relationships.
7.8 Kohonan Network Models
Kohenan network models are a type of neural network. The two unique features associated with Kohonen networks are unsupervised learning and competition. Unsupervised learning models do not create models based on preexisting groups, clusters, categories, or classification schemes. Rather, these pattern recognition tools seek to identify and characterize the underlying form and natural structure in a given data set, based on the attributes selected for inclusion in the model. In other words, the “correct” output is not known a priori, but is determined through the analysis. “Competition” refers to how the structure of the model is determined, which is based on how the human brain learns and is modified by the learning process. Also like the brain, which organizes similar or related functions in distinct and interconnected anatomical locations, Kohonen networks group similar clusters in close proximity and dissimilar clusters at greater distances. Therefore, unlike other pattern recognition algorithms, the relative position of the clusters identified in a Kohonen network have additional value in that clusters that are relatively close share more similarities than those positioned at greater distance on the map. Perhaps for these reasons, the Kohonen network, or self-organizing map, is one of the more popular neural network modeling techniques.
7.9 How to Select a Modeling Algorithm, Part II
With the increased availability of comprehensive data mining suites, there is a dizzying array of modeling algorithms available to the analyst. Even after decisions are made regarding analytical strategy and the numeric features of the data have been evaluated, there still may be more than one modeling algorithm that would be a good match. It is entirely appropriate to run the data more than one way in an effort to find the analytical approach or algorithm that works best. It is unlikely that one particular modeling technique will emerge as a runaway leader, but subtle differences are not only possible, they are expected. As can be seen in Figure 7-5, the Enterprise Miner includes a feature that allows the analyst to run the data using more than one tool and then to compare the results. While this automated approach makes direct comparison relatively easy, it is still possible for the analyst to run the data using several different approaches and expert settings and then compare the outcomes using the strategies for evaluating the results described above.
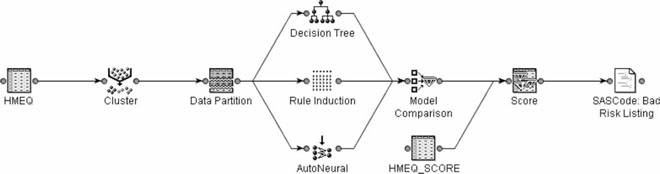
Figure 7-5 This figure highlights a model comparison feature that can be used to compare directly different modeling approaches or strategies. (Created with SAS software. Copyright 2006, SAS Institute Inc., Cary, NC, USA. All Rights Reserved. Reproduced with permission of SAS Institute Inc., Cary, NC.)
7.10 Combining Algorithms
Different modeling algorithms also can be used in sequence. For example, the analyst can use unsupervised approaches to explore the data. If an interesting group or relationship is identified, then a supervised learning technique can be developed and used to identify new cases. An example of this approach can be seen in fraud detection.
A similar combined approach includes the direct, sequential use of unsupervised and supervised learning algorithms in the same analysis. Using this approach, the unsupervised learning approach is run against the data. The group assignment generated by the clustering algorithm then becomes a variable that is used in the decision tree algorithm. A sample of this approach is shown in Figure 7-6.

7.11 Anomaly Detection
The subject of outliers was addressed briefly in Chapter 5. Within that context, outliers were seen as a hindrance—something that needed to be addressed or overcome. What happens, however, when these outliers have significance or meaning? In law enforcement and intelligence analysis, sometimes the most interesting aspects of the job are these outliers. These anomalies in the data can also be cause for significant concern.
7.12 Internal Norms
Seasoned investigators generally have excellent internal norms or gut instincts. It is not unusual when things are a little odd to have a group of detectives standing around a crime scene commenting on how something “just doesn’t feel right” or reviewing something in an offense report and getting second opinions. Frequently, what they are saying is that their anomaly detector has gone off, although they probably will use less delicate terminology.
Sometimes an investigator’s internal anomaly detector will point out that things are just outright strange. The investigative training process resembles case-based reasoning in many ways. Investigators come to understand a new experience or a new case based on their prior experiences.4 By accumulating a veritable internal database of previous cases and associated outcomes, they can attempt to match each new experience to their internal library. If an experience matches a previous case, they have an internal scenario that can be used to structure the current investigation. For example: A husband calls and reports his wife missing; wife found murdered with signs of overkill; previous cases indicate domestic homicide; interview husband. If something new does not fit into their past experiences in any sort of logical fashion, then they have encountered an anomaly, which requires further inquiry to either fit it into an existing norm or create a new category. In many cases, listening closely to these internal anomaly detectors frequently can highlight situations or individuals that bear further scrutiny.
7.13 Defining “Normal”
People often get tripped up and caught when they try to behave normally or “fly under the radar.” In many cases, however, they often do not have a good sense of what normal truly looks like and get caught out of ignorance or because they stand out by trying to be inconspicuous. It is difficult to completely understand what normal looks like until we characterize it and then analyze it in some detail. It is for this reason that understanding normal trends and patterns, as well as “normal” abnormal trends and patterns, can be a valuable component of public safety domain expertise.
How It Works
Briefly, there is a variety of clustering algorithms that group cases based on similarities between them.5 This clustering is something that is done in law enforcement and public safety on a regular basis. For example, homicides are grouped based on motive, while robberies can be grouped based on the location of the incident (e.g., street, commercial, bank), whether the suspect was armed, or the value of what was taken (e.g., petit versus grand). What happens, though, when something is outside the norm, when it does not fit into any of these predetermined categories? These cases fall into the category of outliers, which can have a significant impact on model construction and evaluation if they are not identified and addressed. As shown in the framed area in Figure 7-7, three cases do not fit into any of the larger clusters. These represent anomalies or possible outliers in the data, something that is difficult to evaluate until these cases have been examined in closer detail.
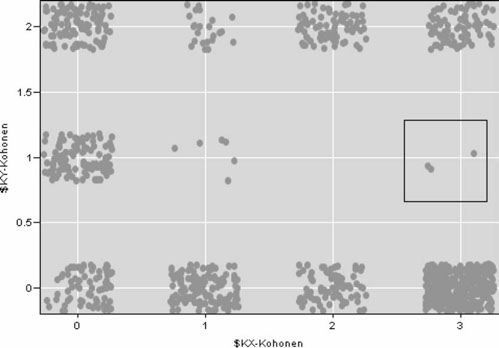
Figure 7-7 This figure illustrates the results of a clustering algorithm. The box highlights three anomalous cases in the data set, which do not fit into any of the other clusters. (Screenshot taken by the author is from Clementine 8.5; SPSS, Inc.)
Sometimes, however, an anomaly represents more than just statistical clutter. Particularly in law enforcement and intelligence detection, anomalies often are cause for concern because they frequently indicate that something is where it does not belong, is doing something unusual, or has a potential for escalation. In general, deviations from normal in law enforcement and intelligence analysis indicate cause for concern and further evaluation.
Anomaly detection can have significant value in law enforcement and intelligence analysis and should be included in the core analytical functions. While automated detection systems can be wonderful, those without access to sophisticated software resources are encouraged to at least develop some understanding of the “normal” crime within their purview. Many of the examples highlighted in other chapters were developed without access to sophisticated data mining software. Periodically running frequency distributions and characterizing crime trends and patterns using descriptive statistics can greatly increase an analyst’s ability to detect unusual or emerging patterns. These “brute force” techniques, while not terribly elegant, still get the job done when nothing else is available and should be included as an essential analytical function.
Outlined in the following sections are a few examples of the many potential uses for anomaly detection within the public safety setting. Again, knowledge of “normal” represents a very important component of the analyst’s acquired domain expertise because in the public safety environment almost any deviation from normal or expected is cause for concern and further investigation. Moreover, it is extremely important to have a valid baseline upon which these deviations can be characterized and evaluated.
7.14 Deviations from Normal Patterns
It is almost always easier and more effective to respond to an emerging trend or pattern than to one that is established. The Regional Crime Analysis Program (RECAP) developed by researchers at the University of Virginia includes automated control charting.6 Briefly, this control-charting function plots average frequencies of crime. Thresholds for unacceptable deviation from average frequencies can be preset. The analyst is alerted if the frequency transcends this preset threshold, which indicates that further inquiry into the change in frequency is warranted. This program can be set to run during the evening, providing any necessary alerts to the analytical personnel each morning.
The Cops & Docs program, developed by the Richmond, Virginia, Police Department in collaboration with local health care providers, has created a similar program for drug-related incidents.7 Although it is not automated at this point, local health care providers and law enforcement personnel share drug-related incident information in recognition of the fact that this type of information frequently transcends both professional domains. Some drug overdoses result in a telephone call to the local poison control center; others end up in the emergency department; others go directly to the morgue. Consequently, health care providers and law enforcement personnel have only limited access to the entire array of drug-related incidents. By sharing information within appropriate legal and ethical guidelines, even through informal communication routes, the ability to compile and monitor drug-related incidents in an effort to detect deviations from normal is increased significantly. Although involving brute force techniques, this method has proven to be relatively effective in identifying increases in drug-related incidents of potential concern to both health care and law enforcement providers.
7.15 Deviations from Normal Behavior
The relationship between property crimes and stranger rapes has been discussed in other chapters. The salient feature for anomaly detection, however, is that even criminal behavior is associated with normal trends and patterns. For example, if the primary goals of a burglary are economic gain and to escape without detection, breaking into an occupied dwelling and taking something of little or no value would be unusual and counter to the assumed primary motivations of the crime. Upon subsequent examination, there frequently is additional secondary gain associated with these crimes that indicates the potential for significant escalation into violent crime, particularly sexually violent crime.8
Staged Crimes
The subject of “normal” crime is addressed in Chapter 10. The following example illustrates how a good understanding of normal criminal behavior can reveal a possible staged crime or false allegation. Several years ago, a call came in advising that an older gentleman had shot and killed his caretaker. The suspect reported that he had to shoot his caretaker because she had grabbed a knife and attempted to stab him during an argument. Almost immediately the story was suspicious. As can be seen in Figure 7-8, the suspect was standing next to the door when he shot the victim. Not only was he close to an exit, but he had cornered the caretaker, effectively blocking her escape. People occasionally make unusual decisions when involved in a violent confrontation, but choosing not to flee the aggressor, as the caretaker was portrayed, would be unusual. This is particularly true given the proximity to the exit and the relative ease with which the suspect could have escaped this particular situation and gone for help. People lie, however, especially if they believe that it will cast them in a favorable light. Perhaps the suspect had not been completely honest regarding his role as an unwilling participant in the argument, fearing only for his life when faced with the attacking caretaker. In most situations, it takes at least two for an argument. It is entirely likely that the argument had been more reciprocal than the gentleman had originally conveyed in this statement; however, something still felt strange.

Further review of the crime scene was consistent with the story. There was a knife on the right side of the victim’s body, next to her left hand. Left-handedness is relatively infrequent within the population, and a relatively easy mistake in staging a crime is to take a knife in the right hand and drop it on the right side of the victim, not realizing that it would be next to her left hand—an error in logic. As it turned out, the suspect had staged the scene, planting the knife in a hurry without consideration for the handedness of the victim.
Sometimes things just look too good, too consistent, or too homogeneous. One tipoff to an embezzlement case was that the frequency of checks written for whole dollar amounts was extremely high. This was especially unusual given that the checks ostensibly were written to pay bills and reimburse other routine expenditures. When we ran a frequency distribution on the amounts, the pattern became even more unusual: The number of checks written for $100 was unusually high, particularly compared to what we would expect for usual expenses.
What Are the Odds?
Things that occur with unusually high frequency also can be suspect. In 2005, a college coed staged her disappearance shortly after she reported being the victim of a rather unusual abduction. Abductions by strangers are extremely rare. Therefore, one might ask what the likelihood is that the same individual would be abducted twice within such a short period of time—particularly abductions associated with unusual circumstances. In another example, we were able to trace several individuals involved in suspicious behavior around a critical facility to addresses that were within walking distance from one another. While not definitive indicators of wrongdoing, most investigators and analysts tend to become extremely suspicious when encountering coincidences like these.
7.16 Warning! Screening versus Diagnostic
In medicine, like many other professions, there is a difference between a screening tool and a diagnostic tool. A screening test highlights possible cases, while a diagnostic test provides confirmation. A screening test is not presumptive evidence of anything other than that further evaluation is warranted. Similarly, in crime and intelligence analysis, anomaly detection should be considered a screening process. While unusual or unlikely events often indicate something more serious, they are not infallible. They pick up a number of other things, including equipment malfunctions, data entry error, and garden variety outliers. As such, they need to be interpreted with extreme caution until additional information has been collected and evaluated.
7.17 A Perfect World Scenario
In a perfect analytical world, there would be a variety of scoring systems running that would automatically look at information presented (regarding a case, a medical claim, etc.) and analyze that information in terms of its deviation from the normal. In this perfect world, anomaly detectors also would be running quietly in the background, constantly “sniffing” for something unusual that might indicate that trouble is brewing. More and more we realize that criminals study our methods and techniques. It is not unusual to find books and papers outlining police methods and procedures among criminals’ personal effects. In one particular case, a teenage murderer was caught because the investigator was able to elicit a confession by manipulating the suspect’s knowledge of police procedures and forensic techniques. Subsequent search of the suspect’s bedroom revealed several books on serial killers and murder investigation. More recently, evidence has emerged indicating that Al Qaeda operatives have been studying the principles of Fourth Generation Warfare,9 while the Iraqis were researching psyops and related topics in the days prior to the most recent Gulf War.10 How do we accommodate this constantly evolving game of cat and mouse? By building a better mousetrap.
Many scoring algorithms are designed to detect known patterns of criminal offending or unusual behavior. When a new pattern of criminal or suspicious behavior is identified, it can be characterized and modeled. The resulting model can then be used as a scoring algorithm to evaluate each event for signs that indicate similarities with known patterns of criminal or suspicious behavior. If similarities are noted, the incident can be flagged and evaluated further. How likely is it, though, that we can anticipate every possibility for suspicious or criminal behavior? Generally, it is the ones that we do not know about or have not anticipated that catch us each time. Rather than trying to “connect the dots” after something has happened, would it not be better to develop some system that would alert us to patterns of behavior and activities that are unusual or out of the norm, particularly within the public safety setting?
If there is one constant in crime analysis, it is that the creativity of the criminal mind seems unbounded. It is often amazing to see what lengths some individuals will go to in an effort to break the law. Therefore, if detection systems are required to be based exclusively on known patterns of criminal or suspicious behavior, we are always going to be playing the game of catch-up. While it is not likely that all of the possibilities can be anticipated, there is another solution. Running anomaly detection in parallel with traditional scoring algorithms further increases the likelihood that we will identify criminal or suspicious behavior that we do not know about (Figure 7-9). Clearly, this system would not catch everything, but it would represent an analytical safety net for those patterns of activities or behaviors that we do not know about currently or have not anticipated.

Figure 7-9 This figure illustrates the concept of running anomaly detection in parallel with traditional scoring algorithms in an effort to further increase the likelihood that criminal or suspicious behavior will be detected.
Which Tools???
The META Group market analysis of data mining tools11 recently has identified market leaders and prepared a forecast of future market trends in data mining technology. The report advised that leadership positions for data mining vendors have been established by SAS, SPSS, and Oracle, and that market growth in this area is expected to occur in the development of tools specifically designed for use by less technical users in niche markets. This is consistent with the IDC analysis,12 which recommends that “users of analytics should look for individualized relevancy . . . and the ability to easily move from analytics to decision to action.”
Market share and success in other professional domains is an important consideration; however, other issues including flexibility, power, and a user-friendly interface can significantly affect the analysts’ ability to effectively use these tools and realize their potential in the applied setting. Even the most powerful tool will have limited value if the analysts cannot get their data into it, use it, and create operationally actionable output. There are several good reviews of data mining tools that cover these issues,13 and more products are being released and reviewed almost daily.
Another issue for consideration is what other agencies are using. As discussed in this chapter, the analytical processes can be captured, saved, and shared. This represents a unique opportunity for the applied public safety and security community to share knowledge without needing to share data. Criminals do not respect jurisdictional boundaries and even exploit them in many patterns of offending. Data sharing has been an issue fraught with technical limitations related to incompatibility between legacy systems and, perhaps more challenging, a general unwillingness or legal inability to effectively share data. By using analytical tools that can capture, save, and share analytical strategies, separate jurisdictions and agencies can share knowledge without needing to share data.
As of this writing, the “niche market” of less technical subject matter experts described by the META Group is already being exploited. SPSS and Information Builders recently teamed in the development of a law enforcement data mining application specifically created for use in the applied setting. Based on the research and analytical framework developed by RTI International, this tool was specifically created to support deployment decisions. Given the current interest in public safety, security, and intelligence analysis, other companies are sure to follow this example.
Regarding cost, there is no way around the issue; this is expensive stuff. Analytical software is not inexpensive and data mining software falls into the high end of the range. It is possible to do data mining without sophisticated software, although it really helps. Predictive analytics requires specialized software resources. This investment is what separates the men from the boys, so to speak. In contrast to even a few years ago, these products now are available for purchase “off the shelf” and can be used by mere mortals. Many in law enforcement will experience sticker shock when considering the purchase of these products. While it is true that the software purchase price will not compare favorably with the cost of ballistic vests, radios, or even cruisers, the amount of money saved through effective deployment of personnel resources can pay for these products quickly. The increased public safety achieved through effective deployment and enhanced investigative efficacy can be difficult to quantify. Suffice it to say that a safe community attracts business, residents, and visitors, which can greatly enhance the economic health of any location and pay for additional software upgrades.
Ultimately, it is important to remember that these tools support the data mining process and incorporate the mathematical algorithms necessary but not sufficient for some of the data preparation and modeling. As outlined in Chapter 4, it is the domain expertise and ability to create operationally actionable output that is the priceless element in the applied public safety and security analytical process.
7.18 Tools of the Trade
Some specific modeling algorithms and approaches were covered earlier in this chapter, and specific strategies also are suggested in each chapter. The following section will go through the general layout and use of two popular data mining tools: Enterprise Miner (SAS) and Clementine (SPSS).
Figure 7-10 depicts a sample analytical “stream” that was used to analyze the conference call data reviewed in Chapter 6. This example was generated with the Clementine suite of predictive analytics (SPSS Inc.). Figure 7-11 depicts a similar analytical pathway that was generated using the SAS Enterprise Miner™ data mining solution. Enterprise Miner and Clementine are increasing in popularity among law enforcement and intelligence professionals, particularly in light of the powerful analytics and ease of use.
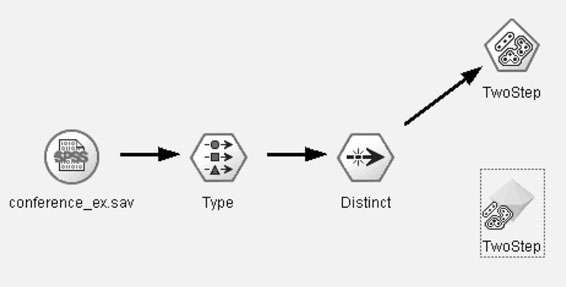
Figure 7-10 Sample Clementine Stream. Not all analytical packages use the same tools or format for cleaning and recoding data; this illustration has been provided to depict the analytical process. (Screenshot taken by the author is from Clementine 8.5; SPSS, Inc.)

Figure 7-11 Sample Enterprise Miner analytical process. (Created with SAS software. Copyright 2006, SAS Institute Inc., Cary, NC, USA. All Rights Reserved. Reproduced with permission of SAS Institute Inc., Cary, NC.)
Moving from left to right, the first icon indicates the source of the data. This source node specifies the location of the data to be analyzed in this particular analytical stream. Although not depicted in this example, there are times where it is useful or even necessary to merge data sources, which would require the inclusion of more than one source node.
The next node in the Clementine stream is the “type” node, which specifies the nature of the data to be analyzed. Different analytical packages address data specification in different ways, some with greater degrees of flexibility than others. Data definition is important in modeling because certain analyses require specific mathematical properties of the data.
The node that follows is a distinct node. As discussed in Chapter 6, there was unnecessary duplication in the data set that would potentially compromise the analysis. Therefore, the data were culled to remove the unnecessary duplication within the data set.
The next node in the stream is the modeling node. In this particular example, a clustering algorithm was used to create groups of similar cases. This also is referred to as an unsupervised learning approach because it does not start with a predetermined outcome or classification system.
The Enterprise Miner process includes a segmentation icon, which randomly assigns the data into training and test samples. This analytical process also incorporates the use of multiple modeling algorithms, and includes an icon that later will be used to evaluate and compare these different modeling tools.
7.19 General Considerations and Some Expert Options
Some packages will “read” the data and identify preliminary numeric properties. Additional steps include selection of the target variables and the identification of which variables should be included for further consideration and modeling. While it might seem foolish to leave anything out, most data sets generally include information that would be inappropriate or irrelevant for modeling (e.g., case ID numbers). Figure 7-12 illustrates the Enterprise Miner dialog box that allows the analyst to select variables for inclusion in subsequent analyses.

7.20 Variable Entry
Stepwise entry of data allows the inclusion of only those variables contributing to an increase in accuracy, in order of importance. Once the preset accuracy is achieved, no additional variables are included. There are other options that allow the analyst to select additional strategies for variable inclusion, but the stepwise entry method is the most common.
7.21 Prior Probabilities
The issue of prior probabilities and its particular relevance in modeling rare or infrequent events was mentioned in Chapter 1. Figure 7-13 illustrates a sample dialog box that supports this particular function. As can be seen, the program automatically determines the prior probabilities of the target and accordingly sets the expected probabilities in the model. The analyst can adjust these probabilities in this dialog box in an effort to alter the predicted occurrence of the target; however, this usually is not necessary. In some modeling packages, the prior probabilities are preset to 50:50 and the analyst must determine the frequency of the target and adjust the prior probabilities manually to accurately model and predict rare events. This generally is not a problem unless the analyst forgets to do it. In these packages, the prior probabilities are automatically determined and used in the modeling and prediction.

7.22 Costs
Costs were also mentioned in Chapter 1. Figure 7-14 illustrates the sample dialog box. As much art as technology, the analyst simply adjusts the costs of certain types of errors and then reviews the accuracy achieved to determine the best trade-off for the particular analysis. It frequently takes a series of successive approximations before the “sweet spot” is found and the most favorable distribution of errors achieved.
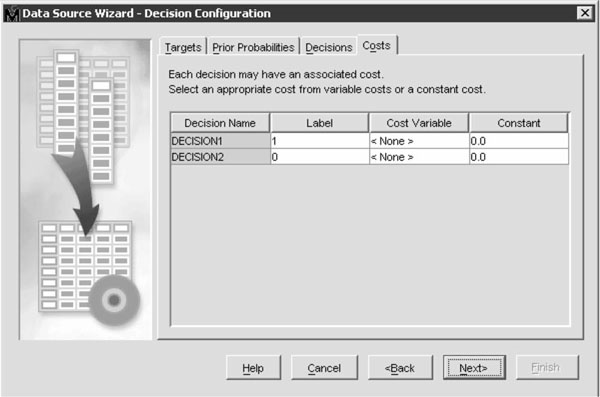
Figure 7-14 Sample dialog box illustrating options for adjusting the cost of errors. (Created with SAS software. Copyright 2006, SAS Institute Inc., Cary, NC, USA. All Rights Reserved. Reproduced with permission of SAS Institute Inc., Cary, NC.)
As can be seen from the examples above, the new technology greatly facilitates analysis. Moreover, the inclusion of some of the expert options, including the abilities to determine prior probabilities and adjust costs, can help the analyst construct models that directly address some of the unique challenges and needs associated with applied public safety and security analysis. These tools are very likely to improve even further between the time of this writing and the actual publication of this text, as each new release of a data mining tool or suite includes greater functionality and capacity packaged in a more intuitive interface. All that being said, domain expertise always will be the essential ingredient in applied public safety and security analysis. A quick review of the Applied Mining and Predictive Analysis model outlined in Chapter 4 underscores the fact that analytical tradecraft and domain expertise are key—all the math in the world cannot save something without solid domain expertise.
7.23 Bibliography
1. IDC (2004). Worldwide end-user business analytics 2004-2008 forecast: Core versus predictive; http://www.marketresearch.com/product/display.asp?productid=1073540
2. Helberg, C. (2002). Data mining with confidence, 2nd ed. SPSS, Inc., Chicago, IL; and Two Crows (www.twocrows.com), which is an excellent source of accurate, yet easy to understand information on data mining and predictive analytics.
3. Klecka, W.R. (1980). Discriminant analysis. Quantitative Applications in the Social Sciences.
4. Casey, E. (2002). Using case-based reasoning and cognitive apprenticeship to teach criminal profiling and Internet crime investigation. Knowledge Solutions; www.corpus-delicti.com/case_based.html
5. Helberg (2002).
6. Brown, D.E. (1998) The Regional Crime Analysis Program (RECAP): A framework for mining data to catch criminals. University of Virginia.
7. McCue, C. (2001). Cops and Docs program brings police and ED staff together to address the cycle of violence. Journal of Emergency Nursing, 27, 578–580.
8. McCue, C., Smith, G.L., Diehl, R.L., Dabbs, D.F., McDonough, J.J., and Ferrara, P.B. (2001). Why DNA databases should include all felons. Police Chief, 68, 94–100.
9. Papyrus News. (2002). Fourth-generation wars: Bin Laden lieutenant admits to September 11 and explains Al-Qa’ida’s combat doctrine, February 10; https://maillists.uci.edu/mailman/listinfo/papyrus-news
10. McWilliams, B. (2003). Iraq’s crash course in cyberwar. Wired News, May 22.
11. METAspectrum Market Summary(2004). Data mining tools: METAsprectrum evaluation.
12. IDC (2004).
13. For specific product reviews, see Elder Research, Inc. at http://www.datamininglab.com, or KDnuggets.com.