
15
Advanced Topics
I have attempted to outline some of the more common public safety and security challenges in the preceding chapters; however, these topics represent only a limited glimpse of the potential for data mining and predictive analytics in law enforcement and intelligence analysis. Therefore, the goal of this chapter is to provide an overview of additional work in this area and to whet the reader’s appetite for further study.
The following list, while not complete, highlights several areas in which analysts are actively using these techniques with considerable success.
15.1 Intrusion Detection
People tend to move through the world in predictable patterns. Generally when they show up where they should not be, they are either lost or have some other purpose for being there. Intrusion detection is a rapidly growing industry in the information technology world. Within the field of intrusion detection, unacceptable behavior has been further subdivided into intrusion detection, which generally looks for outside intruders, and misuse detection, which evaluates threats from within.1 It is well beyond the scope of this text to delve into all of the intricacies of intrusion detection systems, which often change rapidly in response to industry requirements and novel ways to access a system without authorization. Briefly, intrusion detection can be used to identify unusual activity or access patterns that might indicate someone has breached or has attempted to breach a system. These can be set to identify common patterns of attempted access or unusual behavior that warrants additional review.
Similarly, misuse detection looks for unusual patterns of behavior or attempted access within a system. For example, someone from the mailroom trying to access executive salaries or a disgruntled employee logging on late at night from a remote location in an effort to secure some intellectual parting gifts prior to resignation would be cause for concern within an organization. These tools work not only on intranet servers but also on automated access control systems. Again, most individuals will move though the physical structure with predictable, readily identifiable patterns associated with their function and routine activities. Deviation from these normal patterns can indicate almost anything from industrial espionage to a budding romance between someone in maintenance and a member of the secretarial pool. Either way, unusual movement throughout or activity within a facility generally warrants additional analysis.
Another pattern of unusual activity that can be detected within a system is vanity checks. While not presumptive evidence of criminal behavior or intent, checking one’s internal records and who might have accessed them is certainly unusual behavior that often indicates that one has something to hide. Robert Hansen, the FBI agent involved in espionage, was found to have engaged in periodic vanity checks within the FBI’s computer systems.
In some situations, people might have a legitimate reason for browsing a particular system; however, their movement through the system highlights their behavior as unusual. Recently, it was reported that individuals from the Middle East had been accessing municipal websites, apparently in search of public safety infrastructure information. In this case, the origin of the activity as well as the activity itself was unusual and worthy of further investigation. This particular subject was addressed in greater detail in Chapter 14.
15.2 Identify Theft
Identity theft is not a new problem. In fact, my own grandfather, to whom this book is dedicated, assumed the identity of a deceased older sibling so that he could go to work in the central Illinois coal mines before he was old enough. More recently, however, many consumers have had their financial lives ruined by thieves who assumed their identities in an effort to commit economic fraud.
This problem escalated in importance when the 9/11 attacks were investigated and it was determined that the highjackers were able to obtain false credentials necessary to move throughout our country with relative ease. Underscoring the breakdown in our ability to identify and prevent identity theft, 7 of the 19 terrorists involved in the attacks were able to obtain valid Virginia state ID cards, although they lived in Maryland hotels. Subsequent investigation uncovered a group of individuals who had provided hundreds of false ID cards to individuals with questionable documents.
Detection of identity theft frequently occurs only after something bad has happened, either fraud or some other misuse of a person’s identity. Proactive efforts involving manual searches of credit records and personal data in an effort to proactively identify cases of identity theft or misuse, however, are not only difficult but also very inefficient, given the extremely large amount of information involved. Searching public records for duplicate social security numbers or birth dates would be extremely laborious and inefficient using existing methods. Alternatively, automated searches of these databases using data mining and predictive analytics could not only flag invalid, suspicious records but also could create models associated with common patterns of identify theft or fraud. Additional information exploitation for illegal purposes, including the use of aliases and fraudulent addresses, could be identified with data mining tools. Ultimately, this approach would facilitate the development of proactive strategies in an effort to identify identity theft before serious consequences occur. While it is not likely that even automated methods will identify every case of identity theft, it might detect enough identity theft and fraud to make this type of illegal activity more difficult, deterring some illegal use of valid credentials in the future.
15.3 Syndromic Surveillance
Syndromic surveillance systems have been developed for the detection of disease outbreak and bioterrorism. By using anomaly detection, these automated systems are able to identify unusual clusters of symptoms or unanticipated changes in normal disease rates. There are many challenges associated with this type of monitoring, including similar signal-to-noise issues discussed previously, that might be associated with an isolated or unevenly distributed outbreak occurring within a large association of monitored facilities.2 By enhancing standard anomaly detection with decision rules, the performance of these screening algorithms can be increased.3
15.4 Data Collection, Fusion and Preprocessing
The topic of surveillance detection is addressed in Chapter 14, but it is worth revisiting it here. Methods of physical surveillance detection are very good; however, large categories of information might be overlooked if surveillance detection is confined exclusively to physical surveillance. Increasingly, terrorists and extremist groups are utilizing Internet resources for preoperational surveillance and information collection.
“Correlation” in surveillance detection frequently refers to seeing the same person or vehicle in space or time. Given the interest in technology, though, it might be time to extend this definition to include correlation between physical surveillance and surveillance activities on the Internet. For example, what happens if physical surveillance has been detected, and vigorous correlated activity is noted on a related website? Data mining tools have the analytical muscle necessary to combine these relatively disparate and unrelated data resources, integrate them, and analyze them in the same environment. By combining web mining tools with analysis of the products of traditional physical surveillance detection, a more complete model of surveillance activity can be developed. Similarly, concurrent surveillance of multiple, geographically isolated targets also can be detected through the use of data mining algorithms on combined data resources (Figure 15-1).

Figure 15-1 Data mining tools can be used to correlate physical surveillance with Internet surveillance and suspect interviews.
An overview of anomaly detection was provided in Chapter 7, which included a “perfect world” scenario that employed a two-pronged monitoring and detection approach. The monitoring component utilized predetermined decision rules or scoring algorithms based on previously identified, characterized, and modeled bad behavior; the detection part of the process incorporated the use of anomaly detection in an effort to identify behavior that had not been previously observed or anticipated. In many ways, surveillance detection offers a great opportunity for deploying this type of analytical approach. Suspicious situation reports often reflect only a small fraction of the ongoing surveillance activity. Moreover, as the example above highlights, a certain degree of preliminary analysis and classification can significantly enhance the analytical products and overall understanding. These initial analyses can represent the first component of a multilevel analysis of unusual or suspicious activity, while concomitantly guiding additional collection efforts.
A possible integrated surveillance analytical model is depicted in Figure 15-2. This model incorporates the use of predetermined scoring algorithms that are based on a known behavior of interest, with anomaly detection running in the background, as described previously, in an effort to identify any unusual or unanticipated activity. Information inputs would include suspicious situation reports as well as other complementary information, including access control systems, sensors, the agency intranet, and even their website. Ongoing analysis of suspicious situation reports would guide additional surveillance detection and information collection efforts, which also would be included in the analysis. In this model, the analytical outputs would be used to further guide and refine additional collection efforts, highlighting the potential intelligence enhancements that can occur when data and analysis are viewed as dynamic components of the analytical–operational continuum, rather than static commodities in the collection process.

Figure 15-2 Integrated surveillance analysis model, which incorporated dynamic feedback within the model to further enhance surveillance detection efforts.
Again, certain types of space, including those associated with transportation (e.g., trains, airplanes, trucks), are not easily linked to absolute spatial indicators such as longitude and latitude, center lines, patrol regions, or assessment boundaries. Rather, relative indicators may have far greater value when characterizing movement and identifying a potential risk or threat.
It is also worth considering the fact that the space in and around a facility is not homogenous. For example, unusual or suspicious behavior around a facility frequently is informally weighted. Different types of activity are given greater or lesser value. The value given to a potential behavior is an interaction between the location, existing rules, norms, and boundaries, and the specific attributes of the behavior itself. Some movement is of more consequence than others. For example, forcing through a checkpoint would be an obvious transgression. Any incursion into this area would be cause for concern. Other behaviors are not as obvious. For example, photographing or videotaping a facility might not raise as much suspicion, but repeated activity or focus on a particular facility or specific aspect of a facility might be cause for concern.
Perhaps more subtlely, buildings and facilities also are associated with normal flow patterns and boundaries. Delineation of these spatial boundaries might be explicit through signage or implicit through group norms and behaviors. Similar to “personal space,” some buildings or facilities have an invisible buffer. Also like “personal space” violations, transgressions of these spatial rules and norms can attract attention. Therefore, by creating spatial sets associated with the facility of interest, it is possible to look for possible focusing or spatial specificity. Similarly, by weighting different locations within the created spatial sets, as well as the behaviors, it is possible to identify and document potential escalation.
On the other hand, the exact physical location of a possible incident of surveillance generally is not as important as where the person was and what he or she was looking at. Extending this, five different individuals could occupy five slightly different locations, but if they were all observing the same person, building, or specific aspect of a facility, then it is important. In fact, it could add even greater value to know that the same facility, person, or location was observed multiple times in multiple locations or from several different vantage points. Correlations in behavior across time and space can be powerful indicators of coordinated surveillance efforts.
15.5 Text Mining
Text mining tools are increasing in capacity and in value to the analyst on an almost daily basis, particularly as the software developers continue to expand the capacity of these tools.
Figure 15-3 illustrates the inclusion of a text mining process in an analysis. In this particular example, related narrative information has been included in an analysis of truck crashes. By using text mining, key concepts can be extracted from this unstructured information and used to enhance the modeling process.
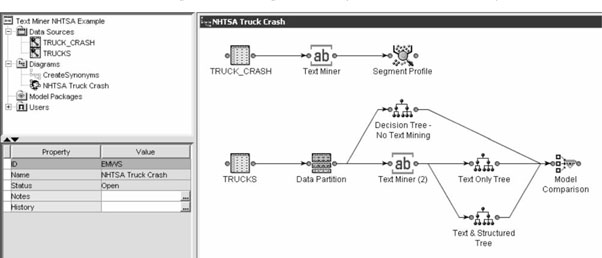
Figure 15-3 Example of a text mining tool and its use in the analysis of truck crash data. (Created with SAS software. Copyright 2006, SAS Institute Inc., Cary, NC, USA. All Rights Reserved. Reproduced with permission of SAS Institute Inc., Cary, NC.)
Figure 15-4 illustrates the type of narrative information that was used in the text mining process. Figure 15-5 demonstrates the key concepts extracted, as well as the frequency with which they occur. These frequency estimates can help the analyst identify concepts and terms that will be used in the analysis by identifying very frequent or extremely rare terms and concepts. The parts of speech have been identified and labeled here. As can be seen in the highlighted portion, “driver” and “drive” have been correctly identified as noun and verb, further highlighting the capacity of this tool.

Figure 15-4 Sample of the narrative portion used in the text mining example. (Created with SAS software. Copyright 2006, SAS Institute Inc., Cary, NC, USA. All Rights Reserved. Reproduced with permission of SAS Institute Inc., Cary, NC.)

Figure 15-5 Example of the concepts extracted from the narrative. The highlighted section illustrates the ability to identify and differentiate different parts of speech. (Created with SAS software. Copyright 2006, SAS Institute Inc., Cary, NC, USA. All Rights Reserved. Reproduced with permission of SAS Institute Inc., Cary, NC.)
The results of the text mining process then can be used in the creation of the model. As illustrated in Figure 15-6, “crash” has been selected as the target or outcome variable. Those variables selected as inputs are available for inclusion in the created model. The ability to use the terms and concepts identified during the text mining process allows the analyst to tap into the vast potential associated with unstructured narrative data and increase the fidelity of the models created.

Figure 15-6 This dialog box demonstrates the use of concepts identified using text mining as variables in a modeling algorithm. The highlighted record illustrates the selection of the binary variable “crash” as the target or outcome variable selected. (Created with SAS software. Copyright 2006, SAS Institute Inc., Cary, NC, USA. All Rights Reserved. Reproduced with permission of SAS Institute Inc., Cary, NC.)
Finally, as can be seen in Figure 15-7, additional language options further increase the capacity of these tools to incorporate narrative data captured in languages other than English.

15.6 Fraud Detection
This topic is so large that an entire textbook could be devoted to it; however, it is important to note that data mining and predictive analytics represent the most effective approaches to addressing this pattern of illegal behavior. Specifically, modeling algorithms that incorporate clustering techniques and anomaly detection can be used to identify patterns of behavior or activity that deviate from established patterns and trends. Data diverging or deviating from “normal” can be identified for further evaluation.
On the other hand, rule induction models capitalize on the fact that people frequently are not creative or unique when they commit fraud. Although there are important individual differences in this type of criminal behavior, the secondary gain or desired goal generally structures the approach somewhat, which may limit the options for committing fraud. Therefore, rule induction models can be used to characterize and model known patterns of fraudulent behavior that can be applied to new data in an effort to quickly identify these patterns.
Finally, the use of integrated approaches that utilize both scoring algorithms and unsupervised learning models can allow the analyst to exploit knowledge regarding previously identified or otherwise known or suspected patterns of criminal behavior, while remaining open to discovering unknown or unanticipated patterns of suspicious behavior. This combined approach of confirmation and discovery represents one of the more powerful aspects of data mining.
15.7 Consensus Opinions
Although the DARPA FutureMAP program was cancelled due to public outrage over government-sponsored wagering on future terrorist attacks and assassinations, consensus opinions have been used with some success. In a unique application of Bayes’s theorem, naval scientist John Craven used consensus expert opinions to locate the U.S. nuclear submarine Scorpion.4 Bayesian inference is particularly appealing for applied public safety and security analysis because it supports the incorporation of tacit knowledge and domain expertise from experts representing diverse backgrounds, potentially bringing the “best of all worlds” to the analytical process.
15.8 Expert Options
Several expert options, including prior probabilities and costs, have been discussed earlier. While it would be impossible to address every option available with each tool, two additional options are worth mentioning at this point given their potential value and relatively common use.
Boosting
Boosting methods can be used to address extremely small sample sizes or infrequent events. These methods confer additional weight or emphasis to infrequent or underreported events. While these frequently can yield greater overall accuracy, like the limitations associated with the data imputation techniques described in Chapter 6, the heterogeneous nature of many patterns of criminal activity can limit the ability to use approaches like this, particularly if they magnify unusual or spurious findings.
Data Partitioning
The important of using training and test samples was covered in Chapter 8. Different approaches to training and validating models exist, however, which use slightly different partitioning techniques. A three-sample approach to data partitioning is illustrated in Figure 15-8. The three samples include training, validation and test. Like the partitioning method outlined in Chapter 8, the training sample is used to train or build the model. The difference between this approach and the one described earlier resides in the inclusion of a validation sample. The validation sample is used to provide the first estimate of the accuracy of the model created using the training data. These results frequently are also used to fine-tune the model. Finally, as described earlier, the test sample is used to evaluate the performance of the model on a new set of data.

Figure 15-8 Example of the inclusion of data partitioning in the analytical process. The dialog box illustrates a three-sample method for partitioning data, which includes training, validation, and test samples. (Created with SAS software. Copyright 2006, SAS Institute Inc., Cary, NC, USA. All Rights Reserved. Reproduced with permission of SAS Institute Inc., Cary, NC.)
Additional approaches to data partitioning include the use of different percentages of data to the training and test samples. For example, a model can be trained on 80% of the data and tested on 20%, rather than the 50:50 approaches outlined earlier. This approach to data partitioning can be particularly useful when modeling infrequent or rare events, as it results in an increased number of cases of interest from which to create the model, without over representing unusual or spurious findings, which is a limitation with boosting methods.
The topics listed above represent a small sampling of the additional work that has been done using data mining and predictive analytics in the applied public safety and security setting. Work in this area is developing at a rapid pace, which underscores its value to the law enforcement and intelligence domains, as well as to the analysts who benefit directly from the enhanced capacity that these approaches provide.
15.9 Bibliography
1. Phung, M. (2000). Data mining in intrusion detection. SANS Institute Resources (10/24/2000).
2. Reis, B.Y. and Mandl, K.D. (2003). Integrating syndromic surveillance data across multiple locations: Effects on outbreak detection performance. Proc AMIA Symp, 549–553.
3. Wong, W.K., Moore, A., Cooper, G., and Wagner, M. (2002). Rule-based anomaly pattern detection for detecting disease outbreaks. American Association for Artificial Intelligence.
4. Sontag, S., Drew, C., and Drew, A. (1999). Blind man’s bluff: The untold story of american submarine espionage. HarperCollins, New York.