
9
Operationally Actionable Output
Albert Einstein is quoted as saying, “most of the fundamental ideas of science are essentially simple, and may, as a rule, be expressed in a language comprehensible to everyone.” Everything that comes before means nothing in applied data mining and predictive analysis unless it can be translated directly into the operational setting and used for decision support. The ability to translate the analytical products from the data mining process directly into the operational environment holds the promise for significantly enhancing situational awareness, guiding information-based decisions, and ultimately changing outcomes. Unfortunately, analytical output, particularly output generated by advanced modeling techniques, generally does not translate well into the applied setting, which significantly limits its operational value. The ability to create visual representations of the analytical results in an operationally relevant format holds tremendous potential for bridging the gap between analytical science and operational practice. Therefore, one of the hallmarks of the Actionable Mining and Predictive Analysis model is the use of operationally actionable visual representation of the data that can significantly enhance the knowledge discovery while guiding operational strategy and tactics. Ultimately, effective visual output should say to the end user, “Go here now and look for this.” “This” should be immediately obvious, allowing the end users to build on their tacit knowledge, while enhancing their ability to “know it when they see it.”
9.1 Actionable Output
It is important to remember that an analyst may see things not readily apparent to others, given their experience with the data. Graphical representations can help them share their vision of the patterns and trends in the data with others. What follows is a brief overview of some novel visualization techniques.
Heat Maps and Schedules
A heat map can be a relatively intuitive visual representation of the data. Basically, the more intense the color, the greater the number represented on the figure. These can be used to depict simple frequencies or risk. In Figure 9-1, different types of crime (INCDGRP) are depicted over different four-hour time blocks (SHIFT). It is very easy to identify the most frequent crimes and when they occur. In this analysis, larcenies were the most frequent pattern of offending, which is not surprising, given their relative frequency in most communities. Examining the chart further, however, reveals that larcenies were most frequent during the 1200–1600 and 1600–2000 hours time blocks. Similarly, assault and battery (A & B) offenses were more frequent during the evening time blocks.

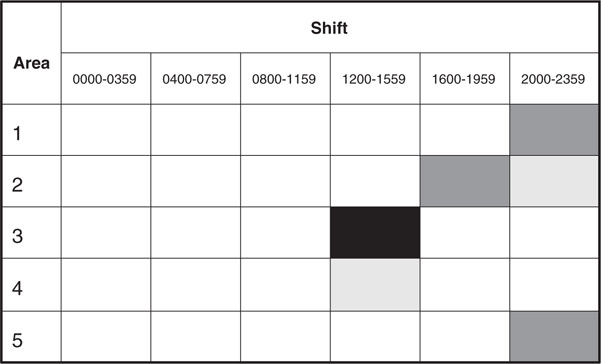
Recalling that deployment represents the allocation of resources across time and space, a very simple deployment schedule was created to represent the occurrence of crime in five different areas during six four-hour time blocks (Figure 9-2). We can see opportunities for fluid deployment strategies, in which resources are proactively deployed to a particular location and then moved or flexed to accommodate anticipated changes in activity. In this particular example, we can take advantage of the sequential increases and fluctuation in activity. For example, we can anticipate the greatest amount of activity in Area Three during the 1200–1559 hours time block and respond by deploying most of our resources to that location before the anticipated increase in activity. Review of a map could provide additional insight regarding Area Four, helping us determine whether this activity is contiguous with Area Three and represents possible risk for displacement in response to the planned suppression in Area Three. Anticipating an increase in activity in Area Two at 1600 hours, we could then plan to flex our resources to that area.
Identifying ways to translate data mining output into a format with direct relevance to operational personnel has greatly increased optimization of analytical resources. As illustrated in Figure 9-3, a scoring algorithm created by an analyst can be made directly available to field-based personnel, providing access to an agency’s analytical capacity when and where it is needed most. The end user can enter a few relevant details and receive a risk assessment, automated motive determination, or some other analytical output without direct access to an analyst. Figure 9-4 illustrates the relevant, easy-to-understand output generated in response to the input illustrated in the previous figure.

Figure 9-3 By using web-based deployment of data mining models, the investigator can benefit from 24/7 crime analysis, which means that analytical capacity will be available when and where it is needed, even at the crime scene. (Cleo, SPSS, Inc.)

Using these web-based tools and a secure Internet connection, analytical capacity can be made available to operational personnel when and where they need it, providing increased situational awareness and investigative support on a 24/7 basis. Whether in an officer’s car during a tour of duty (Figure 9-5) or at a crime scene (Figure 9-6), analytical support is just a keystroke away.

Figure 9-5 Scoring algorithms can be pushed out into the field through web-based interfaces through mobile computers . . .

The particular example in Figure 9-7 is covered in Chapters 12 and 14; however, the novel strategy of depicting the results of an unsupervised learning algorithm in a mapping environment, albeit crude, highlights the analyst’s ability to convey the necessary information to the end user, ultimately converting relatively complex analytical output into something both intuitive and immediately actionable.

Figures 9-8 through 9-11 illustrate the domain-specific tool developed by SPSS and Information Builders, which was based on the RTI International analytical framework. Figure 9-8 depicts the probability of crime by dispatch zone under specific conditions. This information can be used directly by operational personnel for deployment planning purposes. As seen in Figure 9-8, a specific area has been captured within the square. Figure 9-9 includes the captured area and provides additional detail through the use of an orthophotography layer. This image gives additional detail about the area, allowing the end users to incorporate their own knowledge to identify particular environmental features, landmarks, or physical attributes in the interpretation of the results, as well as any operational planning.
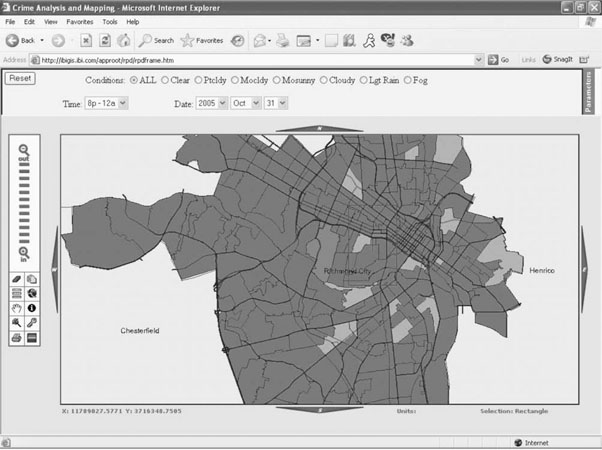
Figure 9-8 Map depicting probability of crime by dispatch zone. (Screen images of the Information Builders’ Law Enforcement Application.)
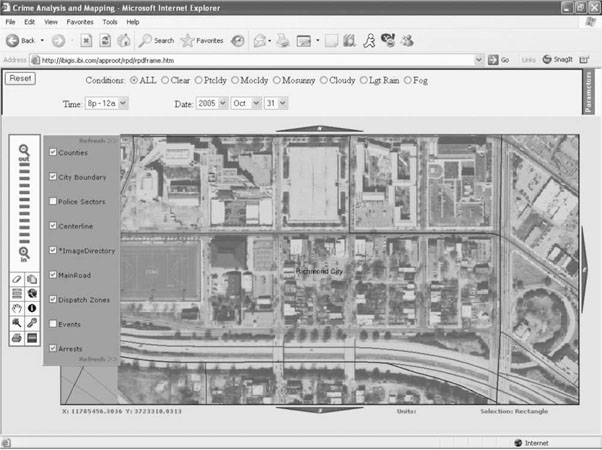
Figure 9-9 Orthophotography detail of area highlighted in box from previous figure. (Screen images of the Information Builders’ Law Enforcement Application.)
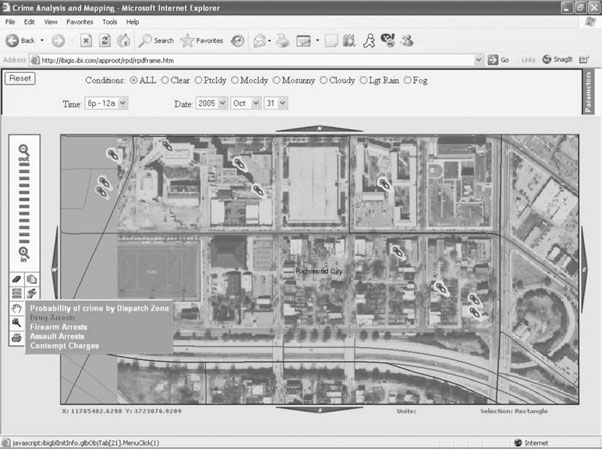
Figure 9-10 Overlay illustrating the direct link between the visual image and the underlying data. “Needle” icons represent locations associated with drug arrests. (Screen images of the Information Builders’ Law Enforcement Application.)
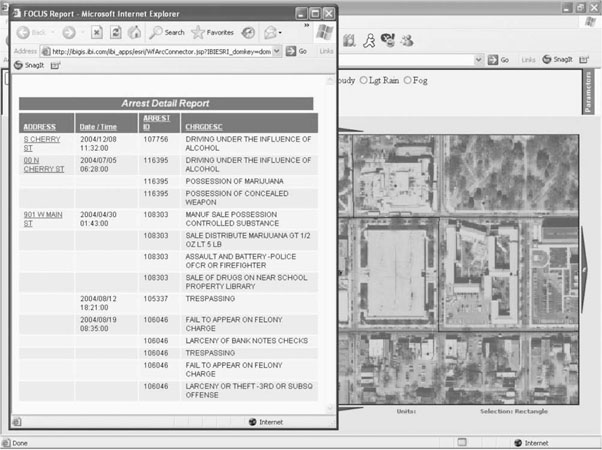
Figure 9-10 adds specific information pertaining to drug arrests through the use of icons overlaid on the map. Again, the end users can exercise their knowledge of the area and domain expertise as they add value to the interpretation and operational use of these images. Finally, Figure 9-11 illustrates the direct link between the data and the image. By using this feature, the end user is able to call up additional information about a specific incident portrayed on the map, providing even more value to the analysis.