
CHAPTER 19
Quality Management
In this highly competitive world, quality is a very important component in the strategy of any enterprise. It is one of the three most important drivers of any business, called collectively as the QCD (Quality, Cost, Delivery) parameters. Oracle Quality provides sophisticated support for capturing data, analyzing data, and finally implementing corrective actions when quality problems arise.
This chapter is broadly organized into two topics: data collection and data analysis. All the data-collection features such as collection plans, collection elements, and specifications are covered in the first part. The data-collection part also talks about quality actions, which help you in putting short-term solutions in place. The latter part of the chapter talks about the various features that allow you to analyze the data that is collected.
Collection Elements
Collection plans and collection elements constitute the data-collection mechanism of Oracle Quality. Collection elements are the basic building blocks of collection plans (covered in the “Collection Plans” section later in this chapter), the data structures that you use to collect quality results. If you are familiar with tabulating data, you can imagine the collection plan to be the table and each column in the table to be a collection element.
Before you can collect data with Oracle Quality, you must first create a collection plan. You begin by creating collection elements, which define the characteristics of the product or process that you want to monitor, record, and analyze. You can create an unlimited number of your own collection elements (which are referred to as userdefined collection elements), or you can use any of the predefined collection elements.
To save you time and to automate data entry, Oracle Quality provides you with several predefined collection elements that are available on a list of values when you set up collection plans.
NOTE
If you are collecting quality data during transactions, and your collection plan uses predefined collection elements that also are on the parent form, their values are automatically entered for you.
Collection-Element Types
Collection elements are categorized by type for easy searching and reporting. You assign collection-element types to collection elements when you define them. You can create your own collection-element types and add them to collection plans, or you can use any of Quality’s predefined collection-element types. If you create your own collection-element types, you must define them before you define collection elements. There are three predefined collection-element types: attribute, variable, and reference information.
Attribute Collection-Element Type
Attributes are data that represent discrete characteristics, for example, characteristics of an object, or the possible outcomes of an experiment. The collection-element type attribute identifies collection elements with these characteristics. These collection elements often have a limited list of acceptable values.
Variable Collection-Element Type
The Collection-element type variable identifies collection elements that are used for numeric measurements. They often have a range of acceptable values or specification limits expressed as preferred values with an acceptable degree of tolerance.
Reference Information Collection-Element Type
The collection-element type reference information identifies collection elements that reference common objects defined in Oracle applications.
Defining Collection-Element Types
In addition to the three predefined types—attribute, variable, and reference information—you can create your own collection-element types in the Collection-Element Type QuickCodes window. You specify the name, meaning, description, and effective dates and enable the collection-element type. If you do not check this box, the collection-element type will not appear on the list of values when you define collection elements. You can disable, but you cannot delete, collection-element types. Disabled collection-element types are not available for future assignments. Existing collection elements that use the disabled type will still continue to work properly.
Defining Collection Elements
You can define an unlimited number of collection elements, which you can then add to collection plans to determine what quality results data will be collected and tracked. You can add, change, and delete collection elements as your requirements change.
You define new collection elements in the Collection Elements form. The collection element name can contain alphanumeric characters, spaces, underscores (_), and single quotation marks (’).
NOTE
There are some reserved words that are used by Oracle Quality for column names in collection plans. For example, NAME, OCCURRENCE, ORGANIZATION_ID, and CREATED_BY are all reserved words and cannot be used as collection element names. A complete list of the reserved words can be found in the product documentation.
The Enabled check box activates the collection element. Only enabled collection elements can be added to collection plans and specifications. The collection-element type helps in searching and reporting. The prompt is displayed as the name of the collection element field while entering quality results. Prompts also become the column headings on reports and online inquiries. The default prompt is the name of the collection element, but you can overwrite it. Hints appear in the message line as the user enters quality results. Figure 19-1 shows the Collection Elements form.
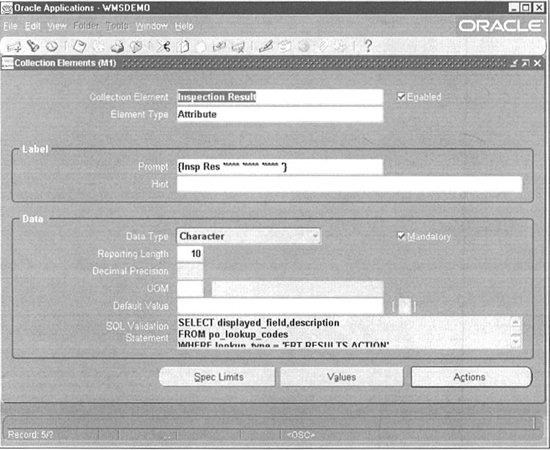
FIGURE 19-1. The Collection Elements form allows you to define collection elements
The available data types are numeric, character, and date. You can select any data type; however, it’s not updateable. The Mandatory check box indicates if a value must always be entered for this collection element when entering quality results. At the collection plan level, you can override this mandatory setting.
The reporting length specifies the display length for this collection element. The reporting length does not determine the amount of space used to store quality result values in the quality data repository. Values can be up to 150 characters in length.
If the data type is number, enter the decimal precision. The decimal precision here controls the decimal precision of the specification limit values that you can define and the results data. Units of measure can be entered for any collection elements regardless of data type. When you set a default value for the collection element, it is automatically entered when the user enters quality results. You can override this value. Collectionelement default values can be copied to any collection plan that contains that collection element.
The SQL Validation Statement is used for validation when you enter quality data. You can base a collection element’s data validation on any table in the database. To do this, you can define a SQL validation statement that is used for validation when you collect quality data.
NOTE
If you define both a SQL validation statement and a list of collection element values (covered in the “Collection-Element Values” section), only the list of values is used for validation; the SQL validation statement is ignored.
Collection-Element Values
If you want to ensure that the data capture process uses a limited set of values, you define a list of values for them when you create collection elements. When you use a collection element in a collection plan, however, the values are not copied into the plan, and you therefore must reassign some or all of them to the collection-plan element or create new values for it.
NOTE
You can delete collection-element values only if they have not been copied to a collection-plan element.
You define collection-element values in the Values window, which you can access by clicking the Values button in the Collection Elements window. The short code generally is an abbreviation of the value and is used to speed data entry. The short code must match the data type of the collection element. For example, if the data type is number, the short code must be numeric.
NOTE
The table QA_CHARS stores information about collection elements. QA_CHARS also stores information about the collection-element type and context.
Collection-Element Specification Limits
Specifications are useful in representing the product specifications against which the various measurements are compared during quality inspections. Specification limits establish the acceptable values and tolerances for collection elements and include a target value (the preferred value) and three sets of upper and lower range limits, which can be changed without restriction. Specifications are covered in detail in the “Specifications” section.
You define specification limits in the Specification Limits window, which you can access by clicking the Spec Limits button in the Collection Elements window. The Target Value represents the preferred value. The user-defined range limits can be used to represent a process control limit. Your user-defined limits can be inside, be outside, or overlap your specification range limits. The specification range limits can represent engineering tolerances. The reasonable range limit ensures that you collect values that make sense. The upper limits must exceed the lower limits in all cases.
NOTE
During data collection, you cannot collect data that is outside the reasonable range limits.
Quality Actions
Once a problem has been detected, corrective actions need to be taken. Often, you can take short-term corrective actions. For example, you might simply want to stop the production line from producing more defective products. Another simple example is to send an e-mail to all the appropriate parties if a test result on a critical component is entered as “Failed.”
Oracle Quality can issue alerts and electronic notifications, launch workflows created in Oracle Workflow, as well as place jobs, repetitive schedules, items, suppliers, and purchase-order lines on hold. An action rule consists of two parts: a condition that needs to be tested and the corresponding action that needs to be invoked if the condition evaluates to true. Action rules are evaluated and executed during the quality data collection process. You can copy actions and action rules to other collection plan elements. Figure 19-2 shows the Quality Actions window.

FIGURE 19-2. The Quality Actions window allows you to define the various actions
Message Actions
Message actions either display a message or post it to the Quality Action Log. You can use message actions to prompt an operator to take immediate action. Message actions provide immediate feedback and help resolve problems at the source but require action details. There are three message action options:
![]() Display the message entered to the operator.
Display the message entered to the operator.
![]() Display the entered message and reject the input. Before you can continue with quality data collection, you must reenter an acceptable quality results value.
Display the entered message and reject the input. Before you can continue with quality data collection, you must reenter an acceptable quality results value.
![]() Post the message entered to the Quality Action Log. For example, you can post an entry each time a critical part is found to be defective so that the source of the problem can be determined and eliminated. This creates a quality results audit trail.
Post the message entered to the Quality Action Log. For example, you can post an entry each time a critical part is found to be defective so that the source of the problem can be determined and eliminated. This creates a quality results audit trail.
Alert Actions
Alert actions can launch various processes, as well as send electronic mail notifications to users. Alert actions include the following:
![]() Execute an operating system script
Execute an operating system script
![]() Execute a SQL script
Execute a SQL script
![]() Launch a concurrent request
Launch a concurrent request
![]() Send an electronic mail notification
Send an electronic mail notification
Application-Specific Actions
Actions are classified into two types: application-specific and non-application-specific. Application-specific actions act on database objects associated with that product. There also are dependencies between some application-specific actions and context elements. Non-application-specific actions do not have any restrictions.
In Oracle Work in Process, there is an application-specific action to assign shop-floor statuses. This action assigns the specified shop-floor status to the assemblies that you are moving into the To Move intraoperation step of the operation. Shop floor statuses were covered in Chapter 16. There are also application-specific actions for placing a job/schedule on hold.
Action Rules
Action rules define conditions that are evaluated before invoking actions during the data-collection process. You can define more than one action rule for a collection element or collectionplan element. You can also define one or more related actions per action rule.
Some actions require that you supply details, such as the text of a message or the number of a particular step. For example, when you associate the Assign a Shop Floor status to the Intraoperation Step action with an action rule, you must specify the shop-floor status that is to be assigned when the action is invoked during data collection. Other actions, such as the Place the Job on Hold action, do not require action details.
Action-Rule Sequencing
Since you can define more than one action rule for a collection element or collection-plan element, the sequence number establishes the order in which each action rule is evaluated. If the action rules are mutually exclusive, you must assign each a unique sequence number. If the action rules are not mutually exclusive, you can assign more than one action rule to a sequence. Figure 19-3 illustrates the rule evaluation and action invocation process.

FIGURE 19-3. The process of rule evaluation and action invocation
As you can see from the figure, once a rule evaluates to true, all the rules with the same sequence are executed; rules with a different sequence number are not executed.
Collection-Element Actions
You define collection-element actions in the Quality Actions window, which you can invoke by clicking the Actions button in the Collection Elements window. In the Action Rules region, enter the Sequence number for the action rule. The sequence number can be from 0–99999.
Select the condition that must be met to invoke the action. Choose either the Value or Spec Limit option to specify the evaluation method. Value allows you to compare your result with a prespecified value, whereas Spec Limit allows you to check if your result is within a range.
If you choose Value, as quality data is collected, the action rule is evaluated using the results value and the value or values entered here. If you have defined values for the collection element, you must choose a value from this list. If you have not defined values for the collection element, you can enter any value. If you choose Spec Limit, as quality data is collected, the action rule is evaluated using the quality results value and the specification limit target value, the upper or lower user-defined range limits, or the upper or lower specification range limits.
If the selected condition requires a range of values, enter both the From and To values. If the selected condition requires only a single value, enter only the From value.
NOTE
Some conditions do not require values. Examples include Is Entered and Is Empty. These conditions result in Boolean values (true or false) themselves, without needing a comparison.
For each rule you can associate one or more actions. Some dependencies exist between collection plan elements and actions. For example, you can define an Assign a Shop Floor status to the Intraoperation Step action only if you have first created the To Operation Sequence and To Intraoperation Step collection elements.
Collection-Element Alert Actions
Alert actions are special types of actions that are based on the Oracle Alert technology. Quality alert actions often require action details such as recipients (for electronic mail notifications), arguments, and filenames (for SQL and operating system scripts). Further, you can customize alert action details using output variables. Output variables represent quality results values and are dynamically defined as action rules are evaluated. All the alert actions are also defined in the same window as the collection element actions—the Quality Actions window.
E-mail Alert Actions
In the Actions This Rule Invokes region, select the Send an Electronic Mail Notification action. In the Action Details tab, choose the Action Details button to complete the action details in the Actions: Send Electronic Mail window. In the To field, enter the electronic mail IDs of the mail message recipients, separated by spaces or commas. You can enter many mail IDs—up to 240 characters. You can dynamically distribute mail messages by including output variables in the recipient fields. For example, you could define and use an output variable for an Inspector ID collection-plan element if Inspector IDs are equivalent to electronic mail IDs. Specify the Subject, Cc, and Bcc fields of the mail notification.
Define your message source by selecting either File or Text. If you specified file, enter the filename including the full path. If you specified text, enter the text in the text area. You can include output variables in the text, and this is covered in detail in the upcoming “Associating Output Variables with Actions” section.
Concurrent Request Alert Actions
In the Actions This Rule Invokes region, select the Launch a Concurrent Request action. In the Action Details region, click the Action Details button and complete the action details in the Actions: Concurrent Program window. Specify the concurrent program and enter the arguments, separated by spaces.
Operating System Script Alert Actions
The Execute an Operating System script action should be selected to define this action. In the Action Details region, click the Action Details button and complete the action’s details in the Actions: Operating System Script window. The source of the operating system script can be either a File or Text.
If you selected File, you can enter the filename in two ways: as a relative path from an application top directory or as the absolute (complete) path. If you have placed your script in an application’s top directory, select the application and enter the relative path of the file. If the file is not in any application top directory, enter the full path and filename of the operating system script source file. Enter the arguments to pass to the operating system script file, and separate them by spaces.
If you choose to enter the text for the operating system script, enter the script in the text area. You can include output variables in the text. You cannot select an application or enter arguments if you choose to enter a text script. You can include output variables in the text, and this is covered in detail in the “Associating Output Variables with Actions” section. If these output variables select character or date data, place single quotes around the output variable to correctly pass the argument.
SQL Script Alert Actions
In the Actions This Rule Invokes region, select the Execute a SQL Script action. In the Action Details region, click the Action Details button and complete the action details in the Actions: SQL Script window. Choose the source of the SQL system script by selecting either File or Text. The action details of the SQL script and the OS script are essentially the same and, therefore, are not explained here in detail. In SQL script, however, you can use only the Insert and Update statements.
Launch a Workflow Action
The technology for executing these actions is Oracle Workflow. You create a workflow that performs all the tasks that you want as a part of implementing your corrective actions. Select the Launch a Workflow action from the list of values. In the Action Details window, select the corrective action workflow that you defined for this purpose.
You can dynamically pass quality results values to the workflow during data collection. You must create output variables for the collection plan elements for which you want to pass values and assign them a token. The token that you assign is the internal name for the workflow attribute that corresponds to the collection element. Associating output variables is covered in detail in the “Associating Output Variables with Actions” section.
CAUTION
For the output variables to work, the token name must be entered exactly the same as the workflow attribute’s internal name.
Associating Output Variables with Actions
You can incorporate quality results values into the action details using the output variables feature for various types of actions. Output variable tokens are defined by entering an ampersand (&) followed by a token name that represents a results value. For example, you can define a token called &ITEM_NUMBER to represent the item number.
You define output variables from the Action Details windows of the various actions that allow output variables. Examples of these actions are Actions: Send Electronic Mail, Actions: SQL Script, Actions: Operating System Script, Assign a Value, or Launch a Workflow. In these windows, navigate to the Output Variables window by clicking the Variables button.
Enter the token name. The token name should not contain the ampersand in this window. The ampersand is required only when this variable is referenced in the action details. Associate a collection element with the token name. You can associate token names with any collection element, including common collection plan elements. For example, you can associate the item collection element with the &ITEM_NUMBER token name. Figure 19-4 shows all the entities and relationships that support the data collection functionality in Oracle Quality. Some of these entities are covered in the following sections.
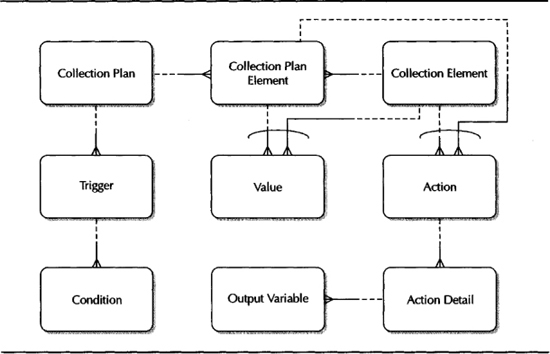
FIGURE 19-4. Logical data model covering the data collection entities in Oracle Quality
NOTE
The table QA_ACTIONS stores action definitions. Action logs are stored in the table QA_ACTION_ LOG. The actions associated with collection elements are tracked using the tables QA_CHAR_ ACTIONS, QA_CHAR_ACTION_OUTPUTS, and QA_CHAR_ACTION_ TRIGGERS.
Specifications
Specifications define product requirements. In other words, they define what is expected from an item for it to be usable. You can define specifications for the key characteristics of the products that you produce or for the materials that you receive from suppliers. You can attach documents to specifications. These attached documents can be used to document processing instructions as well as inspection and disposition procedures.
Specifications are normally defined in terms of nominal (+/–) tolerances or ranges (low to high). A specification for a piston ring, for example, might specify that the diameter be 74mm +/– 0.05mm. The upper specification limit (USL) is the top limit of the defined range. Similarly, the lower specification limit (LSL) is the bottom limit of the defined range.
Specification Types
There are three types of specifications in Oracle Quality: item, supplier, and customer. The specification type that you can select is determined by your business application. For example, item specifications can be used to define requirements for items without regard to the customer or supplier who might purchase or sell them. Customer and supplier specifications define the requirements for items sold to or purchased from specific customers or vendors. When you define a customer or supplier specification, you also select the customer or supplier to which the specification applies.
Specification Subtypes
Specification subtypes further qualify specification types. For example, if you want to use different specifications with respect to supplier location, you can use supplier location as a subtype of supplier.
Defining Specifications
You define specifications in the Specifications form. Enter the specification name and effectivity date and choose a specification type. The available specification types are Item, Supplier and Customer. Each type of specification can be based on either an Item or Item category. If your specification is based on an Item, you must assign an item and, depending on the item, an item revision. If you intend to base your specification on an Item category, you must have specified a default category set using the profile option QA: Quality Category Set. You can then select one of the Item categories within this set from a list of values. Figure 19-5 shows the Specifications form.

FIGURE 19-5. The Specifications form allows you to define specifications and spec limits
Specification Elements
You create specification elements by adding collection elements to your specifications. Collection element specification limits are defaulted to these specification elements. For example, if you create a specification element by adding the Frequency collection element to a specification, the target value of 20.0000 and user-defined, specification, and reasonable range limits—19.7800–20.2200, 19.7600–20.2400, and 19.7400–20.2600, respectively—are defaulted to the specification element.
NOTE
The tables QA_SPECS and QA_SPEC_CHARS store information about specifications and specification elements.
Collection Plans
Collection plans are composed of collection elements, their values and specifications, and any actions that you want to initiate in response to quality results. Collection-plan elements are the building blocks of collection plans. You can create collection-plan elements by adding individual collection elements to your collection plan. In addition to the collection elements that you explicitly add to a collection plan, there are a number of common collection-plan elements that are added to every collection plan. For example, item is a typical collection-plan element that can appear in all the collection plans in which you want to collect information about items. You create collection plans in the Collection Plans form, which is shown in Figure 19-6.
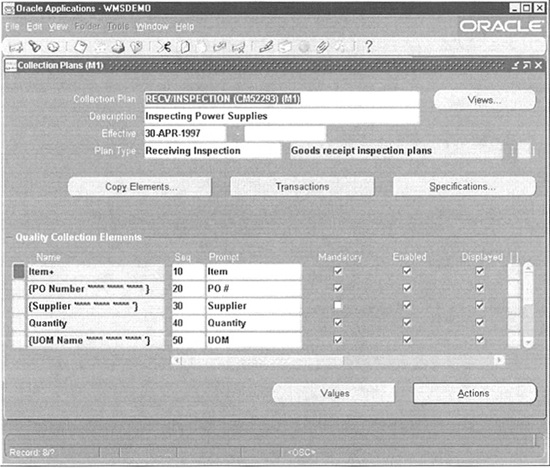
FIGURE 19-6. The Collection Plans form allows you to define collection plans and associate collection-plan elements
Specify the name, description, and effectivity dates. Once a collection plan expires, you cannot enter quality results using the plan, but you can query records that already use it.
The collection-plan type allows you to categorize your collection plans. You can define your own collection-plan types, or you can use any of these five predefined collection-plan types: WIP Inspection, Receiving Inspection, FGI Inspection, Field Returns, and Service Requests. Collection-plan types are only informational; they do not affect a collection plan’s association with transactions.
NOTE
The table QA_PLANS stores information about collection plans.
Collection-Plan Elements
Collection elements are generic until you use them in collection plans. Whenever you use collection elements in collection plans, they are associated with the plans and thereafter are referred to as collection-plan elements. Collection-plan elements can have different actions, specifications, and values that make their use specific to that collection plan.
You can define the collection-plan elements by selecting them individually or by copying from another collection plan. You can also define the collection-plan element values and actions similarly. Some actions are independent of the collection-plan elements they are associated with. For example, you can define message actions, such as Display a Message to the Operator, or alert actions, such as Send an Electronic Mail Notification, for any collection-plan element. Some other actions, however, require the existence of a context element. For example, the action Place the Job on Hold can be selected only if Job is present.
NOTE
The table QA_PLAN_CHARS stores information about collection-plan elements.
User-Defined Formulas Using Assign a Value Actions
You can dynamically assign values to collection-plan elements as you enter quality results. Values are assigned when action rules associated with Assign a Value actions are evaluated and found to be true. When you assign a value to a collection-plan element, its current value is overwritten.
CAUTION
Formulas and SQL scripts might fail to process if the value represented by an output variable token is null.
In addition to the normal action details, you specify the mode in which a value is assigned and the appropriate details. Choose the appropriate check box to define the value using either a Formula or SQL script.
Use the formula option to define arithmetic expressions. Arithmetic expressions can include the following:
![]() Operators - +, −, *, /
Operators - +, −, *, /
![]() Specific values −3, A
Specific values −3, A
![]() Functions
Functions
![]() Output variable tokens that represent quality results values
Output variable tokens that represent quality results values
Use the SQL option when data must be read from database tables. You can include specific values and output variable tokens in your SQL text as well. If you have included output variable tokens in your Formula or SQL Text, click the Variables button to associate these output variable tokens with the action.
Associating Collection Plans with Transactions
Once you define a collection plan, you must associate it with the transaction and enable it, so that the collection plan is available on the transaction’s list of values during quality collection. Integrating quality data collection with standard manufacturing transactions provides the following benefits:
![]() You can combine the data recording and data entering steps into one.
You can combine the data recording and data entering steps into one.
![]() You can enforce mandatory data collection if required.
You can enforce mandatory data collection if required.
![]() You can collect quality results automatically in the background without user intervention.
You can collect quality results automatically in the background without user intervention.
You associate collection plans with transactions in the Collection Transactions window, which you can invoke by clicking the Transactions button. In the Quality Collection Transactions region, select a collection transaction and indicate if quality data collection is mandatory when the transaction is entered using the Mandatory check box. The Mandatory check box also ensures that all the conditions specified in the collection triggers must be met. If you do not check the Mandatory box, you can skip quality result entry for this transaction.
NOTE
The complete list of transactions supported for quality data collection can be found in the documentation.
The Background check box enables background data collection that allows you to collect quality results without invoking the Enter Quality Results window. Inspection collection transactions and self-service transactions cannot be set to background. Finally, check the Enabled box to indicate that data collection for this quality collection plan is enabled.
Collection Triggers
Collection triggers consist of conditions, which if evaluate to true, trigger the results entry process. You define triggers in the Collection Triggers region. The trigger name specifies which context collection element is used to define the trigger. The condition entered determines when quality data collection is triggered. For example, for the WIP Move transaction you might choose to trigger data collection when assemblies are moved from the To Move intraoperation step of Operation Sequence 20 to the Queue intraoperation step of Operation Sequence 30. Based on the condition, enter a value or range of values for the specified trigger.
NOTE
The table QA_PLAN_TRANSACTIONS stores the association between collection plans and transactions. The collection triggers associated with a plan and a transaction are stored in the table QA_PLAN_COLLECTION_TRIGGERS. QA_TXN_COLLECTION_TRIGGERS contains all the collection elements that can be used as collection triggers for a specific collection plan associated with a transaction.
Collecting Data
When the data collection framework (consisting of collection elements, specifications, and collection plans) is in place, you can start collecting data. You can enter quality results into the quality data repository directly as you perform transactions or by using Collection Import. When you enter quality data using a collection plan that has been associated with a specification type, you are prompted to find and assign a specification before you can enter quality results.
Direct Data Collection
You can enter quality results directly in stand-alone mode. You can then update, view, report, and chart these results as required. When you enter results in stand-alone mode, the data entered is validated, using acceptable values and valid data types, and actions are executed per the collection plan used.
You use the Enter Quality Results window to enter quality results directly. When you enter quality results for collection-plan elements with specifications, the Spec Name, UOM, Target, Upper Limit, and Lower Limit fields are displayed at the bottom of the window. If you do not want the specifications to be displayed, set the QA: Blind Results Entry profile option to On.
Data Collection During Transactions
You can collect data during transactions, and you can specify that it be mandatory or optional. You must create a collection plan specific to the transaction, and in the plan, you can indicate whether or not quality results are to be collected automatically or in the background as you transact. If you indicate that quality results are not to be collected in the background, you use the Enter Quality Results window to enter them. As with direct data collection, the data that you enter is validated, and actions executed, per the collection plan. This was covered in detail in the “Associating Collection Plans with Transactions” section.
Collection Import
You can load quality results data from external systems into the quality data repository using the Collection Import Interface. This allows you to feed data directly from testing devices and measuring instruments. For example, if you use infrared systems for inspecting incoming goods, you can use the collection’s import functionality to directly feed the data into Oracle Quality.
You use SQL or PL/SQL to load the Collection Import interface table. From the Launch Collection Import Manager window, open the Collection Import Manager. This process validates records in the Collection Import Interface, and then imports the data into the quality data repository. Results data that fail validation or processing are marked. You can use the Update Collection Import window to view, update, and resubmit this information.
NOTE
The tables QA_RESULTS and QA_RESULTS_UPDATE_HISTORY store the data that is captured during transactions. You can use the QA_RESULTS_INTERFACE to populate data programmatically.
Mobile Quality Applications
Oracle Mobile Quality Applications are part of the suite that enable companies to extend the benefits of their mobile supply chain applications. The following data entry pages are provided in mobile quality:
![]() Enter Quality Results
Enter Quality Results
![]() View Specifications
View Specifications
![]() Transactional Data Collection—WIP Move, WIP Return, WIP Scrap/Reject, WIP Completions, WIP Workorderless Completions, WIP Material Transaction, and Flow Manufacturing Completions
Transactional Data Collection—WIP Move, WIP Return, WIP Scrap/Reject, WIP Completions, WIP Workorderless Completions, WIP Material Transaction, and Flow Manufacturing Completions
Analysis Tools
Popular statistics texts say that there are three types of lies: lies, damned lies, and statistics. Statistics can be very misleading. Care should be taken every step of the way—data collection, data analysis, and verification of solution. Your analysis can be only as good as your data. Oracle quality supports the generation of Pareto charts, histograms, trend charts, and control charts. These charts can be very useful in different conditions to analyze your data. This section talks about these charts in detail.
Copying Settings
You can view the same subset of data in different ways using the Copy Settings function. Copy Settings copies the saved settings from a source chart to a destination chart. The settings that are copied include the collection plan and the record selection criteria, and, depending on the source chosen, might also include the primary collection element, specification limits, or both. You can change all the settings that are copied except the collection plan.
Copying settings is explained as a part of explaining the various analysis tools. A general point to remember is that there might be data losses when you copy data between the various tools. For example, if you create a Pareto chart by copying the settings from a trend chart, information about the specifications are lost, since Pareto chart doesn’t require specifications. If you create a control chart from the Pareto chart thus created, which requires specifications, you should manually include the specifications information after copying the settings from the Pareto chart.
Pareto Charts
In 1897, the Italian economist Vilfredo Pareto showed that the distribution of income is uneven; 80 percent of the income was in fact earned by 20 percent of the population. Quality management guru Dr. J. M. Juran extended this theory to classify problems into the vital few and the trivial many. Pareto’s Law, named after the Italian economist, states that 80 percent of the effects can be attributed to just 20 percent of the possible causes. The Pareto chart, which is based on Pareto’s Law, allows you prioritize the list of possible causes and focus on the most important ones.
TIP
Use Pareto charts in the problem-identification phase of your problem-solving methodology.
You can chart quality results for any collection plan element. For example, you can chart the top defects entered for a particular production line during a week. You can create Pareto charts from scratch, or you can create them by copying settings from another chart, descriptive statistic view, or custom report. You can save your chart settings so that you can re-create charts using the same settings. Only those results that are to be charted can be selected. When you are satisfied with your settings and record selection, you can view your chart. You can optionally export chart information for further analysis.
Chart Settings
Enter the chart name in the Pareto Chart window. This allows you to save your chart parameters. You can select any collection plan, even those that are no longer effective. The collection plan cannot be modified during subsequent chart generations. The chart title, if specified, is displayed at the top of the chart. Figure 19-7 shows the chart settings for the Pareto chart.

FIGURE 19-7. Use the Pareto Chart form to define the settings for your Pareto chart
The X-axis of the chart represents the problem classification scheme. If you are generating the top defects, the list of defect codes should be chosen as the collection element for the X-axis. If you are analyzing the causes of a particular defect, the list of causes should be chosen as the collection element for the X-axis.
The Y-axis of the chart usually represents a quantity or count of occurrences. If a numeric collection element is selected, you can choose to plot the sum, count, minimum, maximum, or average of the values associated with that collection element. If a nonnumeric collection element (character or date) is selected, you can select only count.
Enter the maximum number of groups to display on the chart. For example, enter 5 to chart the top-five defect codes. The chart description is displayed at the top of the chart, under the chart title. Select the quality results to chart in the Show Results Where region of the Pareto Chart window. If you do not select which quality results to chart, all results associated with the collection plan are used.
Generating and Viewing the Pareto Chart
If you want to copy the settings from another chart, click the Copy Settings button in the Pareto Chart window. You can change all copied settings except the collection plan.
Click the View Chart button to view the Pareto chart (see Figure 19-8). Click the Save Settings button if you want to save the inquiry settings. To export the chart, choose Tools I Export Results.
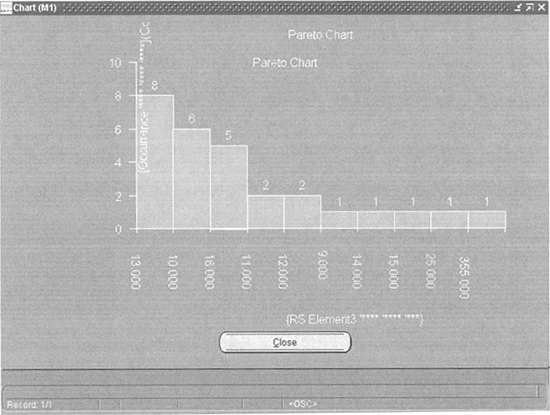
FIGURE 19-8. Pareto Chart generated by Oracle Quality
Histograms
Histograms provide a graphic summary of variations in a set of data. It is an objective way of looking at the population at a glance. The diagram is constructed by partitioning the range of data into several intervals of equal length, counting the number of points in each interval, and plotting the counts as bar lengths. Typically, the shape of the distribution should be bell shaped. Any significant deviation from this normal pattern has one or more assignable causes, which can shed light on the variability in the process.
You can graphically display, in histogram form, quality results for any collectionplan element with a numeric data type. You can select and graph a subset of the quality results values. You can create histograms from scratch or by copying settings from another chart, descriptive statistic view, or custom report. You can save your chart settings so that you can re-create charts using the same settings.
Chart Settings
Enter the chart name in the Histograms window. This allows you to save your chart parameters. You can select any collection plan, even those that are no longer effective. The collection plan cannot be modified during subsequent chart generations. The chart title and chart description, if specified, are displayed at the top of the chart.
Select any collection element on the collection plan with a numeric data type. The X-axis of the chart represents the computed intervals of the selected collection plan element. You can influence the interval by specifying the number of bars that you want in the histogram. If you do not specify the number of bars, it is calculated as the square root of the number of data points. The number of points represents the total number of data points to be included. If you do not enter a specific number of points, all the points are used. If you enter a specific number, the most recently collected results are used.
The Y-axis of the chart represents the count or sum of occurrences of the primary collection element on the X-axis. You can specify whether you want your histogram to be based on count or sum using the Group By field.
You can select only specifications that have specification elements in common with the selected collection plan element defined. You can find and select any specification, even specifications that do not have the selected collection element as a specification element. If this is the case, upper and lower specification limits and the target value are defaulted from the collection element.
Select the quality results to chart in the Show Results Where region of the Histograms window. If you do not select which quality results to chart, all results associated with the collection plan are used.
Generating and Viewing the Histogram
If you want to copy the settings from another chart, click the Copy Settings button in the Histograms window. You can change all copied settings except the collection plan.
Click the View Chart button to view the histogram. Figure 19-9 shows a histogram. Click the Save Settings button if you want to save the inquiry settings. To export the chart, choose Tools I Export Results.
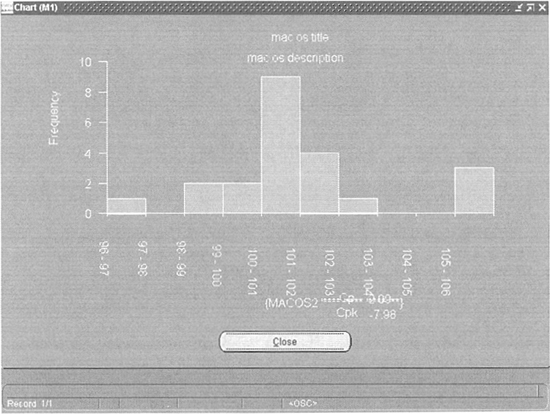
FIGURE 19-9. Histogram generated by Oracle Quality
Trend Charts
You can use trend charts to analysis data collected over a period. By observing trends, you can identify the pattern of problem occurrence over time. You can then analyze the causes that are associated with the unfavorable trends and develop solutions to overcome them.
Chart Settings
Enter the chart name in the Trend Chart window. Select the collection plan to chart. If you are creating a chart, you can select any collection plan, even those that are no longer effective. If you are changing a chart, you cannot change the collection plan. The chart title and chart description will be displayed at the top of the chart.
The X-axis of the chart can be any collection plan element that usually represents time or groups of quality results collected consecutively over time. You can view results by any one of the following three options:
![]() Occurrence Plots individual quality results consecutively over time, from the oldest occurrence to the most recent occurrence
Occurrence Plots individual quality results consecutively over time, from the oldest occurrence to the most recent occurrence
![]() Collection Number Plots a group of individual quality results or readings, grouped into a collection and identified by a collection number
Collection Number Plots a group of individual quality results or readings, grouped into a collection and identified by a collection number
![]() Entry Date Plots a group of individual quality results or readings, grouped by the date in which they were entered
Entry Date Plots a group of individual quality results or readings, grouped by the date in which they were entered
For the collection number and entry date options, you must select an appropriate grouping function such as average or sum.
The Y-axis of the chart represents the variable that is studied with respect to time. If the X-axis represents a grouping, you must select a grouping function for the Y-axis. For example, if the X-axis is Entry Date, you can select a function such as Average to display average values for the collection element for each day.
Select the quality results to chart in the Show Results Where region. If you do not select which quality results to chart, all results associated with the collection plan are used.
Generating and Viewing the Histogram
If you want to copy the settings from another chart, click the Copy Settings button in the Trend Chart window. You can change all copied settings except the collection plan.
Click the View Chart button to view the trend chart. Click the Save Settings button if you want to save the inquiry settings. To export the chart, choose Tools I Export Results.
Control Charts
Control charts help gauge the stability of a process. The main purpose of control charts is to detect the existence of assignable causes.
For some types of control charts, the data that is collected to construct a control chart needs to be grouped into subgroups. Selection of a subgroup is extremely important when defining these types of control charts. Improper subgroup selection can lead to misleading results and false corrective actions.
Prior to subgrouping, consider the variation that you want to eliminate. Construct your subgroups in such a way that the variation by permissible factors alone constitutes the variation within the subgroup. If these variations are unknown, a control chart cannot be used effectively.
Control Chart Types
Control charts are typically pairs of charts. The first chart plots a measure that represents the within-subgroup variation or individual data points, while the second chart plots a measure that represents the between-subgroup variation, such as range or standard deviation. Oracle Quality has three types of control charts: Xbar-R, X-mR, and Xbar-S.
Xbar-R Chart
An Xbar-R chart is a pair of line graph charts that plot subgroups of data collected over a continuous period. The Xbar chart plots the average value for each subgroup. The R chart, or range chart, plots the range of values within each subgroup.
X-mR Chart
The individual X chart simply plots individual data points. The moving range chart plots a specified range of the data points up to and including the current data point. For example, if a subgroup size of five is specified, then the tenth point on the Moving Range chart is plotted, using the range of 6–10 points. These charts are commonly used when the process results do not fall into subgroups, for instance, when the process is slow and data does not form clusters over time.
Xbar-S Chart
This pair of line charts is similar to the Xbar and R charts except that when the S chart is plotted, the standard deviation is used instead of the range. This pair of charts is commonly used instead of the Xbar and R chart when the subgroup size is large (more than 10) because it mitigates the effects of outliers.
Chart Settings
Enter the chart name in the Control Charts window. Select the collection plan to chart. The chart title and chart description are displayed at the top of the chart. Select the chart type—Xbar-R, X-mR, or Xbar-S. If the subgroup size is greater than 10, Xbar-S is recommended. Select the collection element that you want to analyze. It must have a numerical data type. Select the quality results to chart in the Show Results Where region. If you do not select which quality results to chart, all results associated with the collection plan are used.
Control limits can be defined based on collection results, saved limits, or manual entries. To define control limits based on collection results, click the Control Limits button in the Control Charts window. Enter the control limit name and description. You must enter a subgroup size that is between 2-25. If you change the subgroup size, you must recalculate control limits. The number of subgroups allows you to specify the number of subgroups to be used by Oracle Quality in the calculation of control limits. The Compute New button calculates the control limits. Figure 19-10 shows the Control Charts form and the Control Limits window.

FIGURE 19-10. Control Chart Settings and the Control Limits window
If you want to base your control limits on saved limits instead of defining a new control limit, select the control limit name of the saved set of control limits. You can also select saved limits from other charts; however, the selection is limited by the chart type and the collection element.
Generating and Viewing the Control Chart
If you want to copy the settings from another chart, click the Copy Settings button in the Control Charts window. You can change all copied settings except the collection plan.
Click the View Chart button to view the histogram. Choose the Save Settings button if you want to save the inquiry settings. To export the chart, choose Tools I Export Results.
How to Read Control Charts
Points outside the control limits clearly indicate process instability. Even when the points are inside the control limits, the process is not stable if you can detect one or more runs. Run is a state in which points occur continually on one side of the control line. The number of points in a run is called the length of the run. A seven-point run is considered abnormal.
Trend represents a state of instability. When the points have a continuous upward or downward sequence of points, they are said to be in a trend. Periodicity occurs when you see the upward and downward trends forming a repeating pattern.
If two out of three points fall outside the two sigma lines, then this condition is referred to as approaching the control limits.
Precontrol Charts
The tools in Statistical Process Control (SPC) significantly improve the ability to detect and prevent potential problems, but they do not function in real time. They are still a part of offline quality control. Precontrol charts are a variant of control charts, and they allow you to implement online quality control, by which the operator can check the status of the process every half-hour and gauge the stability of the process. Figure 19-11 shows an example of a precontrol chart.
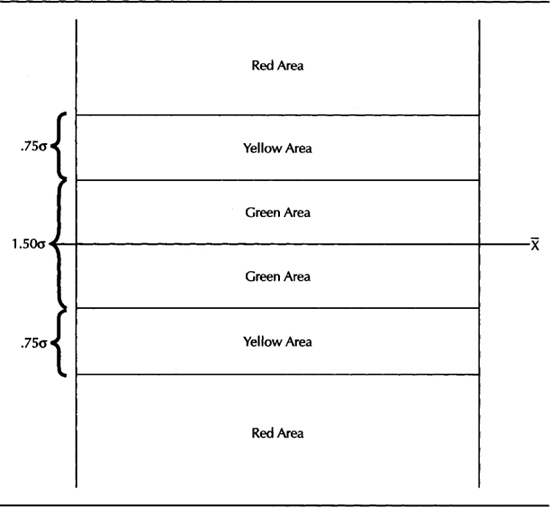
FIGURE 19-11. Implement online quality control using precontrol charts
After identifying the critical process parameters using the various tools including control charts, you can develop precontrol charts for these critical parameters to make sure that the process is continually monitored. Since it is an online quality control tool, this is plotted by the operator. Typically, a measurement is taken every half-hour or every batch of five to 10 parts. The simple rules are as follows:
![]() If you get a point in green, continue with the process.
If you get a point in green, continue with the process.
![]() If you get a point in yellow, take another measurement. If the next measurement also falls in yellow, stop the process and inform the appropriate authority.
If you get a point in yellow, take another measurement. If the next measurement also falls in yellow, stop the process and inform the appropriate authority.
![]() If you get a point in red, stop the process and inform the appropriate authority.
If you get a point in red, stop the process and inform the appropriate authority.
Descriptive Statistics
Once you collect data, you can generate descriptive statistics on the collected data using the Descriptive Statistics form. The statistics generated are as follows:
![]() Sum
Sum
![]() Mean
Mean
![]() Minimum value, maximum value, range, standard deviation, and variance
Minimum value, maximum value, range, standard deviation, and variance
![]() Total occurrences and null occurrences
Total occurrences and null occurrences
![]() USL, LSL, Cp, and Cpk
USL, LSL, Cp, and Cpk
Along with the appropriate charts, these descriptive statistics are very useful in studying quality problems.
Statistical Process Control (SPC)
SPC is the application of statistical tools and methods to evaluate important process parameters for continuous improvement. Quality assurance departments have inspectors who measure the quality of products after they are made. The tools of SPC allow you to detect potential problems ahead of time and implement corrective actions.
The most important aspect of SPC is the splitting of variability into two types: variability due to chance causes and variability due to assignable causes. Chance causes are present inherently in the process; they cannot be controlled, at least not without substantial investment. For example, you don’t have a lot of control over the atmospheric temperature, unless you move the process into a controlled environment.
Assignable causes, on the other hand, represent deviations from the process specification or process design flaws. For example, using the wrong coolant is an assignable cause. If the coolant that is used is in fact the specified coolant, then this is a process design issue; you have to change the process specification. If this was an error on the part of the operator, this nonconformance needs to be addressed. Control charts are excellent tools for studying a process. They are covered earlier in the “Control Charts” section.
Process Capability Studies
Process capability studies are performed periodically by quality engineers to make sure that a particular production process is capable of producing a certain dimension, with an acceptable level of repeatability. The two indices Cp and Cpk are commonly used in the process capability studies to measure the health of the production process that is being investigated.
A sample size is established prior to the study. When the samples are ready for analysis, the process characteristic is measured for all the samples. The arithmetic average of this group of values is denoted by the mu character (μ), and the standard deviation of all the values from the calculated average is denoted by the sigma (a) character. Standard deviation is a measure of variability in a process. Defined as the root mean square (RMS) deviation from average, it indicates how much a process can be expected to vary from the average.
The focus of a process capability study is to understand two aspects of the process: variability and centering. Variability is the inherent variation that occurs in the process around the average, and centering represents the ability of the process to adhere to its target value. The approach to improving process capability is to reduce variability first, and once variability is under control, concentrate on centering.
Cp
The index Cp is calculated using specification limits and the standard deviation of the process. This index indicates, in general, whether the process is capable of producing products to specifications. The specifications are denoted by LSL and USL for lower specification limit and upper specification limit, respectively. The formula for Cp is shown here:
![]()
The recommended value for Cp is 1.67 or greater. Since it doesn’t include the mean in its calculation, it is not a very reliable index and can be very misleading if used in isolation. Figure 19-12 explains this.

FIGURE 19-12. How reliable is Cp if used in isolation?
In the two scenarios shown in Figure 19-11, the Cp is exactly the same—a value of 1.75 that is greater than the recommended value of 1.67 and so would seem normal.
Although, as you can understand from scenario (b), the process is operating way off its target value, and approximately 40 percent of its output will be defective.
This shortcoming of Cp notwithstanding, the index gives meaningful insights on the variability of the process.
Cpk
Cpk is calculated using specification limits, the standard deviation, and the mean. The index indicates whether the process is capable of producing within specification and is also an indicator of the ability of the process to adhere to the target specification. The formula for Cpk is shown here:
![]()
The recommended value for Cpk is 1.33 or greater. When the value is lesser than 1.33, you have to work on both reducing the variability of the process and also focus on improving centering. The usefulness of Cpk is illustrated by Figure 19-13.

FIGURE 19-13. Usefulness of Cpk in improving the process capability
As you can see from the figure, there is no ambiguity that when you improve the process—either variability or centering—the improvement is indicated by an increase in the value of the index.
Conducting a Process Capability Study
Before venturing into the process capability study, you must make sure that the process being analyzed is under statistical control. Only after a process is under statistical control can one safely assume that the mean and standard deviation to have stable values over time. You must make sure that the sample size is adequate.
The data should be tested for normality before you can use the data in the study. Histograms are very useful for this purpose. After satisfying all these conditions, you can calculate Cp and Cpk. Both Cp and Cpk are calculated with the generation of descriptive statistic views and histograms (as shown in Figure 19-8).
Summary
Quality is everybody’s business. Assuring quality depends on how controlled your processes are. Keeping your processes under control depends on the analysis methods and the accuracy of your data.
Oracle Quality provides a sophisticated data collection framework comprising collection elements, specifications, and collection plans. Collection elements identify the characteristic that you want to measure or some reference information. Specifications represent the target and permissible upper and lower limits.
Collection plans are a collection of collection elements. You can associate actions with collection elements and collection plan elements. Actions allow you to put short-term corrective actions in place. You can also implement long-term corrective actions using the workflow actions. You can implement and assign value actions at the collection-plan element level. You also associate transactions and the corresponding collection triggers at the collection plan level.
Oracle Quality supports the generation of four graphical tools: Pareto Chart, Histogram, Trend Chart, and Control Chart. These charts allow you to conduct your problem investigation meaningfully. The process capability indices Cp and Cpk are generated when you construct a histogram or when you generate descriptive statistics.