
2. Financial Statement Analysis
2.1 Introduction
Before you value a project, such as a firm, you must conduct some basic financial due diligence to assess the financial position of the firm. The financial position of a firm determines its success or failure. If its debt gets too high, its cash balances fall too low, its operating margins are too low, and so on, it will not likely survive much longer. Financial health provides the firm with more flexibility in dealing with unexpected developments. All firms use a fairly standard way of reporting on their financial positions. Understanding these standard ways in which firms report is a powerful tool for analyzing the performance of an organization. Three particular statements—income statements, balance sheets, and cash flow statements—are the key to understanding financial reporting. Although separate statements, these three are intricately linked to each other, as discussed throughout this chapter.
2.2 Financial Statement Analysis
Balance sheets, income statements, and cash flow statements together provide a summary of a firm’s financial position. Each provides a separate set of information, but they are all also linked to each other and jointly determined. Figures 2.1 and 2.2 illustrate how the linkages work. Very broadly speaking, the balance sheet is a static statement (a “snapshot”) of a firm’s position at a given point in time, usually the end of a quarter or a year. The cash flow and income statements record the way in which a firm moves from the balance sheet at the end of one period to the balance sheet at the end of the next period. In other words, the cash flow statement and income statement provide “links”1 between one period of time and the next.

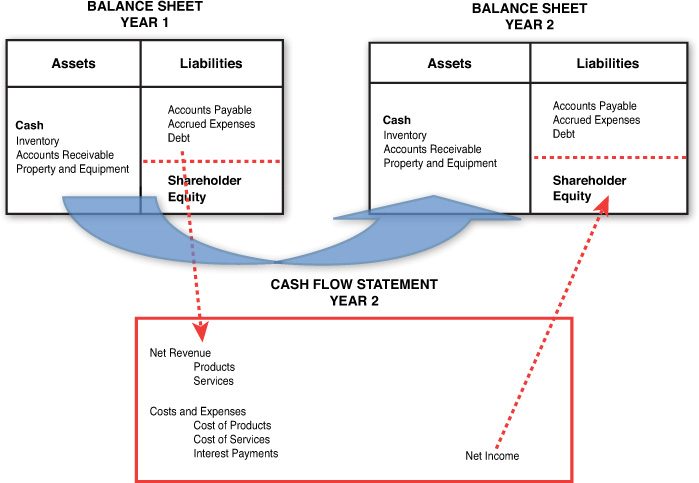
For example, as Figure 2.1 shows, cash at the end of the year shows up on the asset side of the balance sheet in Year 1, and also as Cash at Beginning of Period in the cash flow statement for Year 2. Within the cash flow statement, as explained in more detail later in this chapter, activities that generated or used cash during Year 2 are recorded. What’s left at the end of the year (Cash at End of Period) shows up as Cash in the balance sheet for Year 2. As another example, the change from accounts receivable at the end of Year 1 and accounts receivable at the end of Year 2 will result in cash being generated or used. This amount will then show up in the cash flow statement for the end of Year 2. Similarly, as shown in Figure 2.2, the income statement provides a link between the balance sheets for two consecutive periods. For example, part of the change between inventory at the end of Year 1 and inventory at the end of Year 2 will show up as revenue in the income statement as well as cost of products (sometimes referred to as cost of goods sold, or COGS) in the income statement. Net income generated during the year (shown in the lower-right side of the income statement in Figure 2.2) flows into shareholder equity in Year 2’s balance sheet. In this chapter, we provide more details on each of these financial statements, as well as on the linkages among them.
2.2.1 Balance Sheets
Balance sheets provide a snapshot of a firm’s financial position at a point in time. They record the assets and liabilities of a firm at a specified time. Figure 2.3 provides the balance sheet for ABC Company for 2011, 2012, and 2013. Balance sheets are divided into three major categories. Assets entries represent property, intangible assets, and other items that a firm owns and that have value. Within assets, individual entries may be either “current assets” or other assets. Current assets are those that are relevant to the near term (that is, the period of the financial statement, in the sense that they could be converted into cash fairly quickly). For ABC Company, these current assets include cash ($670 million), accounts receivable ($1.52 billion), and inventory ($624 million) at the end of 2013. ABC’s total current assets are $4.25 billion at the end of 2013. (Figure 2.3a provides definitions of the individual items in the balance sheet.)


Noncurrent assets are those that are less readily transferable into cash or have a longer life. Examples for ABC include property, plant, and equipment ($1.02 billion at the end of 2013) and long-term financing receivables ($896 million). Clearly, converting a physical plant into cash takes longer than, for example, converting inventory into cash; this distinction between the two is the reason why inventory is placed under current assets and why property, plants, and equipment are placed within other assets. The distinction between current and other assets is important because it gives some idea of a firm’s access to cash within a relatively short time horizon. As discussed later in this chapter, the value of current assets is also critical in thinking about a firm’s ability to cover its short-term liabilities. Adding together ABC’s current and noncurrent assets, its total assets for 2013 are $13.1 billion.
The second major category of the balance sheet—liabilities—lists amounts that a firm owes to others. As with assets, liabilities are often divided into current liabilities and other liabilities. ABC’s current liabilities include notes payable ($674 million at the end of 2013), accounts payable ($1.23 billion), and employee compensation ($333 million). Current liabilities represent an obligation to pay in the relative near term. In contrast, noncurrent liabilities include longer-term obligations, such as long-term debt ($1.88 billion at the end of 2013). For ABC, total liabilities, both current and noncurrent, in 2013 were $7.5 billion.
Shareholders’ equity represents the third major category on the balance sheet. Shareholders’ equity essentially measures the net worth of a firm. It is the cumulative result of profits produced by the firm plus any inflows and outflows of cash to shareholders. It is an important indicator of a firm’s financial health and, as discussed later, provides a buffer against negative results in the business. Another term for shareholder equity is equity capital.2
These three categories—assets, liabilities, and shareholders’ equity—are linked to each other, in the following way:
This relationship must always hold and provides important information about the linkages among all of a firm’s activities. If any asset category increases in value, either liabilities or shareholder equity must also go up. In other words, balance sheets must always balance. Turning again to ABC’s 2013 results, we see that Total Assets = $13.1 billion = $7.5 billion + $5.6 billion = Total Liabilities + Total Stockholders’ Equity.
2.2.2 Income Statements
In contrast to the snapshot nature of the balance sheet, the income statement shows changes during the reporting period. The income statement records the flows in and out of income over the course of a year. Figure 2.4 shows ABC’s income statement for the years 2011, 2012, and 2013. (Figure 2.4a provides definitions of the entries in the income statement.)

Note: Entries in parentheses represent negative numbers. All figures are in millions of dollars.
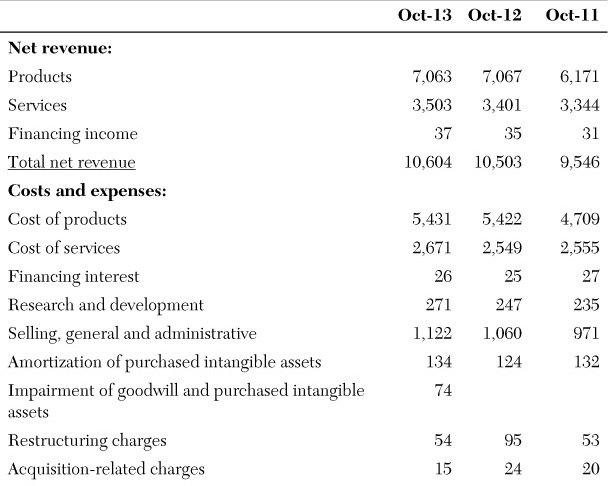
Figure 2.4 ABC Co. Income Statement

In the broadest sense, the income statement is divided into two categories: activities generating positive income (net revenue in Figure 2.4) and activities that generate negative income (costs and expenses in Figure 2.4). Within these broad categories fall specific types of activities that either increase or reduce income. For example, in the case of ABC, in 2013 the firm generated $7.06 billion in product revenue and $3.50 billion in revenue from selling services. Activities that subtracted from revenue included the costs incurred in producing the goods sold ($5.43 billion) and research and development costs ($271 million). To calculate the total earnings from operations, you subtract the total operating expenses from the total net revenue. As shown in Figure 2.4, ABC had earnings from operations of $806 million in 2013. (Of course, if operating expenses are greater than total net revenue, earnings from operations will be negative.)
After listing income and expenses and calculating earnings for operations, two additional nonoperational categories are accounted for before calculating the final net earnings for the year. The costs from interest payments are subtracted out ($58 million for ABC). The cost of paying taxes must also be accounted for ($159 million). After netting out these last two categories, the end result is net income. In 2013, ABC’s net earnings were around $590 million. In other words, the cumulative results of income generating activities and income losing activities for ABC in 2013 were about $590 million. Again, this number could be negative, in which case ABC would have had a net loss for the year.
You can also think about the income statement as keeping track of the ways in which a balance sheet changes from year to year. It records the operational factors that affect a firm’s income, or profits, from year to year. The value of net income (that is, the net result of all activity recorded in the balance sheet) over the course of a year then feeds directly into shareholders’ equity for that year. For example, net income for ABC for 2013, $590 million, is equal to the change in retained earnings between 2012 and 2013, as shown in the balance sheets for those two years, where the level changes from $3.86 billion to $4.45 billion.3 Ultimately, an income statement may be used to reconcile shareholders’ equity between one year and another.
2.3 Cash Flow Statement
As with the income statement, the cash flow statement records flows. It keeps track of flows of cash into and out of a company’s accounts. In essence, it illustrates how a firm goes from its cash balances in one year to its cash balances in the next year. It records the ways in which a firm brings in cash and spends it.
Before discussing the cash flow statement itself, it is useful to introduce another important financial record: the sources and uses of cash statement. The sources and uses statement records the sources and uses of cash by a firm over the course of a year. These changes could fall within just about any area of the balance sheet. To put together the sources and uses statement, you must compare balance sheets between two points in time (for example, ABC’s balance sheets for 2012 and 2013).
In Figure 2.5, we construct a sources and uses of cash statement for ABC for 2013. Figure 2.5 shows the 2012 and 2013 balance sheets, along with a column that represents the difference between the 2012 and 2013 numbers. The sign (with negative numbers in parentheses in Figure 2.5) in the column showing the difference indicates whether cash was used or generated. Thus, a negative entry represents cash used up by that account, and a positive entry represents cash generated by that account. The various entries illustrate the ways that cash is generated or spent by the firm.

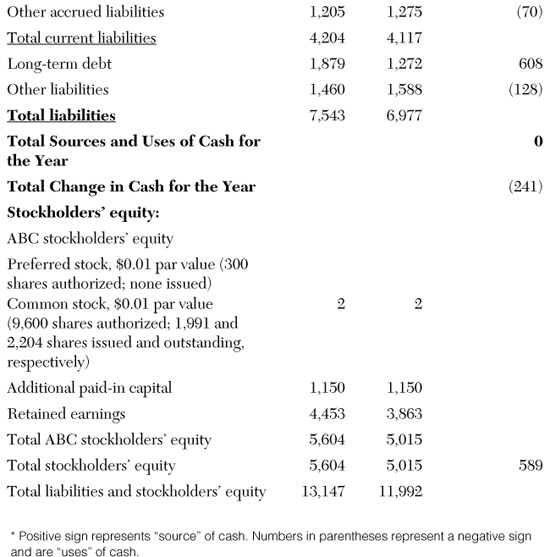
For example, a decrease in accounts receivable generates cash, because it means that outstanding money due from customers has fallen. For ABC, accounts receivable went from $1.54 billion in 2012 to $1.52 billion in 2013. This change implies an increase in (that is, a “source” of) cash in the amount of $21 million. An increase in inventories, in contrast, implies a use of cash, because money must be spent to boost inventory levels. For ABC, inventories changed from $539 million in 2012 to $624 million in 2013, implying a “use” of $85 million. As an example on the liabilities side of the balance sheet, notes payable changed from $587 million to $674 million, generating a source of cash of $86 million.4
To sum up, when all the sources and uses of cash during the year are added together, all the positive transactions (that is, sources) offset all the negative transactions (that is, uses), and all taken together sum to 0.5 Finally, note that the change in cash for the year (–$241 million) is equal to the changes in cash in all the other (noncash) accounts when summed together. Therefore, ultimately, a cash flow statement is intended to show how to “bridge the gap” between a company’s cash levels in one year to its cash levels in the next year. (Also see Figures 2.1 and 2.2.) To preview the next few paragraphs, this same $241 million shows up in ABC’s cash flow statement (see Figure 2.6) as the “(Decrease) increase in cash and cash equivalents.” Therefore, the sources and uses of cash statement provides information complementary to the information in the cash flow statement.


Note: Numbers in parentheses represent a negative sign. All figures are in millions of dollars.
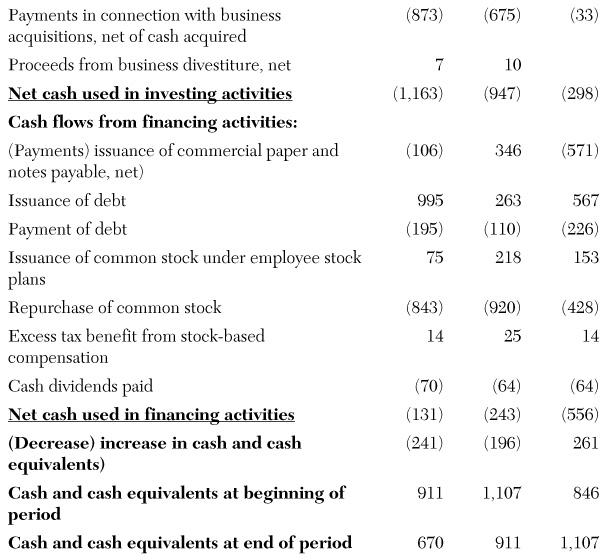
Figure 2.6 ABC Co. Cash Flow Statement
Figure 2.6 provides ABC’s cash flow statements for 2011, 2012, and 2013. Like the source and uses of cash statement, the cash flow statement also tracks the changes in cash from one year to the next. Indeed, the third line from the bottom of the table, “(Decrease) increase in cash and cash equivalents,” is the exact same value that we showed in Figure 2.5: –$241 million. The cash flow statement differs from the sources and uses of cash statement in that the cash flow statement lists things not included in sources and uses and places all entries into three broad categories.
The format shown in Figure 2.6 (the cash flow statement) is useful because it quickly shows the ways in which cash is generated or used. We can see that cash flows arise from operating activities ($1.1 billion), investing activities (–$1.2 billion), and financing activities (–$131 million). These numbers show that, while ABC generated a lot of cash through its operating activities (that is, via selling its goods and services), its outflows of cash via its investing activities overwhelmed the positive operating balance. Looking more carefully at this account, we see that payments in connection with acquisitions represented the largest share of the negative balance for investing activities. Another “high-level” insight from ABC’s 2013 cash flow statement is that financing activities also generated a slightly negative cash flow. This net result was generated by both issuance of debt (about $1 billion) and stock repurchases ($843 million).
With the overall importance of the cash flow statement and its main components in mind, we can turn to discussing some of the finer details of this report. The entire first third of the statement represents cash flows from operating activities and reports additions and subtractions needed to convert net earnings (as reported in the income statement) to a purely cash basis. This is necessary because the income statement itself includes things that are not associated with an inflow or outflow of cash, and these entries need to be adjusted for in net income.
For example, the cash flow statement includes an entry of $74 million of “Impairment of goodwill and purchased intangible assets.” The income statement includes a cost for this same category in this same amount. Because impairment of goodwill and intangible assets, essentially the decline in value of intangible assets held by the firm, does not involve a cash flow (because the asset is intangible), it needs to be added back in to the cash flow statement, to counteract its recording as a cost in the income statement. This top third also includes entries that record changes in assets and liabilities that, although they do not show up in the income statement, generate or use cash. For example, as noted earlier, an increase in inventories implies a use of cash, because money must be spent for inventory purchases; this value thus must be subtracted from net earnings.
The second third of this table details the impact on cash balances of investing activities. As discussed earlier, payments in connection with acquisitions represented the largest share of the negative balance for investing activities. Investment in property, plant, and equipment was also a large negative value. The final third records the details on cash flows from financing activities. Here, activities that bring cash in are issuing debt and issuing stock. Uses of cash are paying debt, repurchasing stock, and paying dividends. (Later in this chapter, we discuss further the interpretation of the results in these different categories.)
The bottom third of the cash flow statement shows the cash impact of financing activities. Payments (issuance) of debt and commercial paper generate outflows (inflows) of cash. Similarly, when stock is issued, cash is generated, and when stock is repurchased, cash declines. Payouts of dividends also use cash.
The net change in cash over the course of the year is shown in the third line from the bottom of the cash flow statement, –$241 million. This number is the same as we noted in the sources and uses of cash statement. It is the difference between cash balances at the end of 2012 and cash balances at the end of 2013.
2.3.1 Generalizing the Flow Statement
Both income statements and cash flow statements record flows over the course of a reporting period. Both also focus on one particular entry on the balance sheet as the reconciling account. The cash flow statement reconciles to the cash account, and the income statement reconciles to shareholder equity. The key to both is recognizing that a flow must feed through to some part of the balance sheet. In essence, any other account on the balance sheet could be used as the reconciling account. Because cash and equity receive the most emphasis, the cash flow statement and income statement are the two most commonly used approaches.
2.4 Market Value Balance Sheets
In the previous section, we provided an overview of “accounting value” balance sheets. They are accounting value because all assets and liabilities are recorded at the value at which they were originally acquired. Another term for this value is book value. An alternative valuation format for a balance sheet is a market value balance sheet. It is exactly the same as an accounting value balance sheet, but assets and liabilities are recorded at their true market value. Just as with accounting value balance sheets, assets must equal liabilities plus shareholders’ equity.
Market value balance sheets could look very different from accounting value balance sheets. For example, suppose that a piece of real estate was purchased 20 years ago and has since appreciated on a yearly basis. The market value balance sheet would record a much higher number than would the accounting value one. Similarly, suppose that a company builds a manufacturing plant that it depreciates on a straight-line basis over a 10-year period. At the end of 10 years, the plant would sit on the company’s books under Property, Plant, & Equipment with zero value. However, the market value of the plant could easily be much higher than zero.
Market value balance sheets are one important distinguishing feature between accounting and finance. Finance is primarily concerned with the market values of assets, liabilities, and equity. Indeed, valuation is concerned with deriving the market value of something, usually on someone’s or some firm’s balance sheet. As we develop our valuation frameworks, we will be using the concept of market value balance sheets extensively. Many of the fundamental rules that apply for accounting balance sheets also apply for market value balance sheets. For example, market value balance sheets must balance; and gains and losses in assets accrue (primarily) to shareholders’ equity.
2.5 Financial Ratios
Accounting balance sheets, income statements, and cash flow statements provide a great deal of information on a firm’s activities. To analyze the meaning and implications of this information, financial ratios are an important tool in financial statement analysis. In the most basic sense, most of these financial ratios are simply the ratio of one entry in a financial statement to another. However, when analyzed over time, especially in comparison to peer firms, or relative to an industry standard, they reveal a great deal about a firm’s performance. This section explains some key financial ratios and uses ABC’s financial statements to illustrate how to use them. Figure 2.7 provides a summary of the definitions of some key financial ratios.


2.5.1 Return Ratios
The first set of ratios shown in Figure 2.7 indicates the overall sales and earning performance of a firm. They show the revenue or earnings generated in relation to equity, assets, and revenue.
The return on equity (ROE) is the ratio of net earnings to total shareholders’ equity. It shows the magnitude of earnings relative to the net worth of a firm. For ABC, this ratio is calculated by taking net earnings from the income statement ($590 million) and dividing by total shareholder equity from the balance sheet ($5.6 billion). This calculation yields an ROE of 11% for ABC in 2013.6 As shareholders’ equity is an indicator of shareholders’ investment in the firm, the ROE essentially indicates how much return a firm is able to produce for its shareholders’ investments into the firm. It also indicates, for a given unit of stock, how effective a firm is at generating income.7
The return on assets (ROA) is the ratio of net earnings to total assets and indicates the magnitude of earnings relative to the total assets of a firm. To calculate this ratio for ABC, we again take 2013 net income from the income statement ($590 million), but this time divide by total assets at the end of 2013 ($13.1 billion), yielding a ratio of 4%. This ratio indicates, for a given unit of assets, how productive a firm is at generating income, in contrast to ROE, which provides the effectiveness relative to a unit of equity. Note that the ROA is necessarily lower than the ROE because assets are equal to the sum of shareholders’ equity and liabilities. Also, a highly leveraged firm will have an ROE that is relatively much higher than the ROA in comparison to a firm that is less highly leveraged.
A third return ratio, asset turnover (also sometimes called asset turns), shows the value of net revenue (that is, total sales) relative to assets. As a firm is generating revenue, it is cycling through assets. For example, goods come into the firm and stay in inventory. When the firm generates revenue, it sells these goods, and they leave the inventory account. A similar process occurs for every account on the asset side of the balance sheet. Asset turnover indicates how many full cycles, or round trips, occur for total assets for a firm in one year due to revenue generation. For ABC, this calculation is total net revenue ($10.6 billion, as taken from the income statement) divided by total assets ($13.1 billion from the balance sheet), or 0.81. This indicates that the firm experiences 81% of a full asset cycle in one year, or that there is a full cycling through of assets in 1 / 0.81 = 1.23 years. In general, the more efficient a firm operates, the higher the asset turnover (and, consequently, the higher the ROA).8
Finally, the profit margin indicates how much of net revenue (total sales) feeds through into net earnings, and it is defined as net earnings divided by net revenue. A more profitable firm has a higher profit margin. For ABC, this ratio is net earnings of $590 million divided by net revenue of $10.6 billion, or .06. Note that a higher level of costs and expenses relative to revenue will necessarily drive a lower profit margin. The profit margin thus tells us something about how efficiently a firm is able to produce the revenue that it generates.
2.5.2 Leverage Ratios
Leverage, or borrowing, ratios indicate the degree of indebtedness (and, consequently, the level of financial risk) of a firm.
The debt-to-assets ratio (or debt ratio) shows the ratio of total liabilities to total assets. It provides an overall indication of a firm’s indebtedness. For ABC, we need to divide total liabilities ($7.54 billion) in 2013 by total assets ($13.1 billion) to calculate a debt ratio of 57%. Recalling the identity introduced earlier
we can see that a higher debt ratio also indicates a relatively higher level of liabilities to shareholders’ equity, or debt-to-equity ratio. While a firm with a high debt ratio indicates more borrowing relative to assets, it may also indicate a firm that is able to generate a relatively high ROE, because the level of equity is relatively smaller in comparison to the level of debt.
The debt-to-equity ratio also provides an overall indication of indebtedness, as well as an indication of the composition of the right-hand side of the balance sheet, i.e., whether a firm is more heavily weighted towards debt or toward equity. For ABC, this number is $7.54 billion in debt divided by $5.60 billion in equity, or 1.3. The debt ratio is necessarily lower than the debt-to-equity ratio because assets = liabilities + shareholder equity.
Finally, the ratio of assets to equity provides another indicator of leverage.9 Note that because assets – equity = liabilities, this ratio tells us about the leverage of the firm. A high ratio implies relatively high assets relative to equity, thus relatively high liabilities and thus leverage. A low ratio implies relatively low assets relative to equity, and thus relatively low liabilities and low leverage. For ABC, this ratio is 2.3.
Interest coverage provides a shorter-term perspective on the indebtedness maintained by the firm. It is a measure of the cash flow that a firm has available (calculated as net income before interest and taxes, or EBIT) to meet interest payments. This available cash flow is then divided by the interest expense to produce the interest coverage ratio. (So, interest coverage equals EBIT / interest expense.) A firm with a low interest coverage ratio runs the risk of being unable to cover its interest payments (that is, defaulting on its debt). Therefore, this ratio also shows the degree of flexibility a firm has to bear negative events (which decrease EBIT) without defaulting on its debt or having to cut back on its operations in some way. For ABC, interest coverage is equal to $806 million (their earnings from operations) divided by $58 million (their interest expense), or 13.9 for 2013.
2.5.3 Liquidity Ratios
The two liquidity ratios listed in Figure 2.7 both provide information about the level of cash the firm has on hand, so they are indicators of the short-term financial situation of a firm.
The current ratio is the value of current assets to the value of current liabilities. It indicates the ability of a firm to cover its current obligations, such as payments to employees and to suppliers, using the assets that it would be able to convert into cash in the short term. A low current ratio could raise questions about whether a firm would be able to pay off its short-run obligations at a given point in time. Calculating for ABC, we divide the $4.3 billion in current assets by the $4.2 billion in current liabilities, generating a ratio of 1.0. This level suggests that the firm would be just able to cover its current obligations using current assets in the worst-case scenario where all the current obligations came due right away.
The quick ratio is similar to the current ratio, but subtracts inventory from current assets in the numerator of the ratio. Inventory is removed because liquidating inventory quickly may be difficult for certain types of inventory (spare airplane parts, for example), especially in comparison to the other components of current assets, such as cash and accounts receivable. For ABC, this ratio is 0.86, suggesting that, if unable to quickly convert inventory into cash, ABC would not be able to cover its current obligations with current assets if the current obligations all came due right away.
2.5.4 Turnover and the Cash Cycle
The last set of ratios provided in Figure 2.7 are all measures of “turnover.” Broadly speaking, they all show the speed with which a firm proceeds through its sales cycle.
The payables period shows the number of days it takes for a firm to pay its suppliers for inputs and other things that it purchases to produce the goods or services that it sells. The formula for the payables period, shown in Figure 2.7, divides accounts payable from the balance sheet by the average purchases per day by the firm, which is calculated by dividing the total purchases over the previous year by 365.10 This ratio provides a measure of how long on average a firm takes to pay its suppliers. For ABC, we can calculate this ratio by dividing $1.2 billion in accounts payable by a total cost of goods sold of $8.1 billion. The total cost of goods sold comes from adding the cost of products and the cost of services on the income statement. We don’t include other entries under Costs and Expenses on the income statement (such as financing interest or research and development) because these entries do not represent costs directly related to the materials needed to produce the products (goods and services) that it sells. For ABC, the payables period is 55 days, which means that it takes an average of 55 days from the time an invoice comes in from a vendor before a payment is made to that vendor. In general, a high payables period may be interpreted as good or bad. It can be good in that it allows the firm to preserve cash by taking longer to pay suppliers. However, a high payables period may also be an indicator of financial trouble at a firm because it is having trouble generating cash quick enough to pay suppliers on a timely basis.
Inventory days is a measure of the average number of days that goods and products sit in inventory at a firm. The inventory value from the balance sheet is divided by the average cost of goods sold per day, which is calculated by taking the cost of goods sold over the last year and dividing by 365. For ABC, we can calculate this ratio by dividing $624 million in inventory by a total cost of goods sold of $8.1 billion, yielding 28 inventory days. A higher number of inventory days suggests that products sit in inventory a long time (thus increasing inventory costs) before being sold. In general, a lower inventory days measure indicates greater efficiency in the operations of a firm.
Finally, the collection period indicates the average number of days that it takes a firm to receive payment for goods sold to its customers. The collection period is calculated by taking the accounts receivable at a firm and dividing by the average sales per day. This measure is an indicator of how efficient a firm is at getting paid from its customers. The higher the collection period is for a firm, the longer it takes for the firm to collect cash from its customers and, therefore, the more financing the firm needs to cover current liabilities until cash is received from its customers. For ABC, this indicator is 52 days: $1.5 billion divided by $10.6 billion over 365, or about 52 days. Interestingly, the time that it takes ABC to collect money for goods sold is about 3 days shorter than the number of days that it takes ABC to pay its own suppliers. This is a good thing because it means the firm is essentially using its suppliers to finance the receivables from its customers.11
These three turnover ratios—payables period, inventory days, and collection period—together indicate the cash cycle of a firm, as follows:
The cash cycle indicates the number of days for which cash is tied up in the production and sales process. In other words, once a dollar of cash goes out of the firm, the cash cycle is a measure of how long it takes for the dollar to come back into the firm. All else equal, a lower value for the cash cycle indicates more efficient use of cash. For ABC, the cash cycle is 25 days.
2.5.5 The Dupont Formula
The Dupont formula provides insight to the ways in which a firm generates its returns. The formula itself is12
It shows that a firm’s ultimate goal—return on equity (ROE)—arises from the profit margin, asset turnover, and leverage.13 A higher profit margin boosts ROE because it means that every dollar of sales translates into higher net earnings. Asset turnover indicates the degree to which assets are deployed to generate sales. It indicates to what extent the assets of a firm are converted into sales, the source of potential earnings—a higher ratio indicates greater effectiveness at converting assets into sales. Finally, higher leverage translates into higher ROE because higher leverage indicates lower stockholder equity relative to assets. Using the Dupont formula allows you to break down and analyze the factors driving a firm’s ROE.
For ABC, we can take the ratios calculated earlier and use those to illustrate the Dupont formula:
11% = 6% × 0.80 × 2.34
For ABC, the source of its ROE appears to be heavily weighted toward leverage. However, interpreting the sources of ROE must be done in the context of the firm’s particular industry, as well as the firm’s stage in its own life cycle. For example, we might expect that a young, growing firm might generate ROE relatively more via leverage, as compared to a large, mature firm.
2.6 Financial Distress
A firm in financial distress runs the risk of no longer being able to remain an operating entity. Two numbers in the balance sheet, along with their counterparts in the income statement and cash flow statements, can provide important information about a firm’s financial health. First, low cash balances, along with a negative cash flow, could indicate trouble. Cash provides the flexibility to deal with surprises and to ensure ready access to materials needed for doing business. A string of negative cash flow results translates into declining cash balances on the balance sheet, implying reduced ability of the firm to optimize its operations. For this reason, paying close attention to financial ratios that deal with the cash account and liquidity is important in assessing the level of financial distress a firm might be under.
The other important number to look to for signs of financial distress is the value of stockholders’ equity, along with the net income results. Stockholders’ equity shows the net worth of the firm, and a firm with negative net worth may be essentially bankrupt. A string of negative net income results feeding into stockholders’ equity may be a signal of financial distress. For this reason, paying close attention to financial ratios dealing with the equity account is an important part of assessing the level of financial distress a firm might be under.
Endnotes
1. Another common way to think about this is that the income and cash flow statements provide the information that causes the balance sheet to change from one period of time to the next.
2. Quite often in practice, when someone is speaking about equity capital, the speaker will refer to it as simply capital for short. We will be precise when discussing capital in this book, referring to it as either debt capital or equity capital.
3. Other factors also affect shareholders’ equity, so the change in shareholders’ equity from one year to the next might not exactly equal net income for the year. Information on the universe of transactions that determine the changes in shareholders’ equity from one year to the next is recorded in the consolidated statements of stockholders’ equity. For U.S. public companies, these are available from the U.S. Securities and Exchange Commission, at www.sec.gov.
4. Due to rounding, the difference between these numbers is $86 million.
5. The reason for this is that cash cannot be created out of nothing, nor can it simply disappear. All cash has to be generated and used up by the accounts on a balance sheet.
6. Note that we have computed ROE here by dividing 2013 net income by the end of year 2013 shareholders’ equity. Another common way that ROE is calculated is to divide 2013 net income by beginning of year 2013 shareholders’ equity (which is equal to the end of year 2012 equity).
7. Note that, all else equal, a given level of earnings produces a higher ROE if the right-hand side of the balance sheet has more debt relative to equity, simply because the denominator of the ratio will decline. This is also the result of leverage. The higher the leverage a firm has, the greater the risk, and therefore, the greater the potential return on its shareholders’ investments into the firm.
8. Another way to think about this is that the fewer assets a firm has to carry to generate a certain amount of revenue, the more efficient that firm must be and the more profitable that firm will be from an ROA and ROE perspective.
9. If we flip this ratio around to equity divided by assets, this new ratio has a commonly used name: equity ratio. Note that the debt ratio plus the equity ratio always equals 1.
10. Sometimes a firm may not separately report purchases on its income statement or the footnotes. In this case, it is common to use cost of goods sold as a substitute for purchases in calculating the payables period.
11. Another way to state this is that the firm is using its suppliers to finance its customers.
12. In this case, we define leverage as the ratio of assets to equity. Note that because assets – equity = liabilities, this ratio tells us about the leverage of the firm. A high ratio implies relatively high assets relative to equity, thus relatively high liabilities and thus leverage. A low ratio implies relatively low assets relative to equity, and thus relatively low liabilities and low leverage.
13. Recall that ROE can be measured using the beginning of year equity or end of year equity. Either approach is valid with this formula as long as it is consistently applied. So, if beginning of year equity is used to measure ROE, beginning of year equity and beginning of year assets must also be used to measure leverage and asset turnover.