
Culture, Linguistic Diversity, and Economics
Victor A. Ginsburgha,b and Shlomo Weberc,d, aECARES, Université Libre de Bruxelles, Brussels, Belgium, bCORE, Université catholique de Louvain, Louvain-la-Neuve, Belgium, cSouthern Methodist University, Dallas, TX, USA, dNew Economic School, Moscow, Russia
Abstract
This chapter examines how cultural similarities (or differences) represented by common language roots affect economic activities. When individuals share some common linguistic repertoires, they are more inclined to develop commercial relationships and conduct business transactions than in the absence of such commonalities. The link between language, culture, and economic activity is confirmed by the burgeoning empirical research showing that common cultural and linguistic roots enhance trust between countries, which in turn influence trade, migrations, investment, growth, public goods, and many other economic issues. We study possible approaches to measure various aspects of cultural, linguistic, and ethnolinguistic (dis)similarities, but focus mainly on linguistic heterogeneity. Such measures also take into account the size distribution of distinct linguistic groups within a society. We give some examples of how diversity influences international trade, migrations, and literary translations. Other examples can be found in Chapter 18 in this volume by Montalvo and Reynal-Querol. Diversity has often led to standardization, which may increase economic efficiency, but may also result in disenfranchising linguistic groups within a country (or within a group of countries such as the European Union) and produce negative outcomes.
Keywords
Linguistic diversity; Distances between languages; Fractionalization; Disenfranchisement; Conflict
JEL Classification Codes
D74; O12; O44; Z13
If you talk to a man in a language
he understands, that goes to his head.
If you talk to him in his language,
that goes to his heart.
Attributed to Nelson Mandela
19.1 Introduction
In his book Decolonizing the Mind, Kenyan writer Ngũgĩ wa Thiong’o (1986, pp. 3–5) makes it clear why language is an essential expression of culture:
‘[T]he biggest weapon wielded and actually daily unleashed by imperialism against that collective defiance is the cultural bomb. The effect of a cultural bomb is to annihilate a people’s belief in their names, in their languages, in their environment, in their heritage of struggle, in their unity, in their capacities and ultimately in themselves. It makes them see their past as one wasteland of non-achievement and it makes them want to distance themselves from that wasteland. It makes them want to identify with that which is the furthest removed from themselves; for instance, with other peoples’ languages rather than their own.
The choice of language and the use to which language is put is central to a people’s definition of themselves in relation to the entire universe. Hence language has always been at the heart of two contending social forces in the Africa of the twentieth century.’
In 1977, he stopped writing plays, novels, and short stories in English, and turned to Gikuyu and Kiswahili, two languages used in his native Kenya.1 Decolonizing the Mind, published in 1986, and from which the quote is taken, was Ngũgĩ’s last text written in English. As an African, Ngũgĩ writes about the continent where he was born. However, similar stances and ideas hold for all other continents, be they North or Latin America, the Australasian world, some parts of Asia, and even Europe, which nolens volens is turning to a language that consists of a 1000-word English.
As we shall see, linguistic policies often tend to alienate groups of individuals whose cultural, societal, and historical values and sensibilities are perceived to be threatened by what we call linguistic disenfranchisement, as linguistic rights are restricted or even denied.
Why does man have such an intimate relation with his language? What is it that makes the famous Portuguese writer Fernando Pessoa write that ‘[m]y homeland is my language’ or contemporary French linguist Claude Hagège (2000) claim that ‘[l]anguages are the flags of dominated people’ or that ‘[the] fight for French is a fight of the mind’? Why does political scientist Henry Bretton (1976, p. 447) suggest that the ‘fear of being deprived of communicating skills seems to raise political passion to a fever pitch’?
The suggestion that language is more than a means of communicating was first emphasized at the very beginning of the nineteenth century by Wilhelm von Humboldt (1988). It was further reinforced by anthropologist Franz Boas (1940), and linguists Edward Sapir (1949) and Benjamin Whorf (1956), and later came to be known as the Sapir–Whorf hypothesis: language and culture are interdependent, and the structure of the language that one uses (often as native language) influences the way of thinking and behaving. The consequences, summarized by Kramsch (1998, p. 12), imply that despite the possibility of translating from one language to another, ‘there will always be an incommensurable residue of untranslatable culture associated with the linguistic structures of any given language’. Whorf illustrates this by a couple of examples, such as the notion of ‘time’ in Hopi Indian and in English. This notion, he writes, is perceived so differently that a Hopi and an English physicist may have a hard time understanding each other.
This bold hypothesis (language determines the way we think) was rejected by the scientific community, since it would have led to the ‘relativity’ of scientific discoveries. Nowadays, a weaker hypothesis is thought to hold, namely that ‘there are cultural differences in the semantic associations evoked by seemingly common concepts. The way a given language encodes experience semantically, makes aspects of that experience not exclusively accessible, but just more salient for the users of that language’ (Kramsch, 1998, p. 13). In short, language reflects cultural preoccupations and constrains the way we think, and culture is expressed through the use of the language (Kramsch, 1998, p. 14). Language is thus not only a means of communication, but also a carrier of culture. Interestingly enough, this seems also to hold true to some extent for writing. According to Carriére and Eco (2009), in Western movies, traveling shots usually move from left to right, while in Iranian movies, they often go from right to left, following the way Persian is written. More generally, according to Steiner (1992, pp. xii–xiv):
‘Each human language maps the world differently. There is life-giving compensation in the extreme grammatical complication of those languages (for example, among Australian Aboriginals or in the Kalahari) whose speakers dwell in material and social contexts of deprivation and barrenness. Each tongue – and there are no ‘small’ or lesser languages – construes a set of possible worlds and geographies of remembrance. It is the past tenses, in their bewildering variousness, which constitute history.’
A recent paper by Chen (2012) analyzes the effect of language on economic behavior and finds that ‘languages which do not grammatically distinguish between present and future events2 lead their speakers to take more future-oriented actions’: they save more, smoke less, are less likely to become obese, and are healthier in the long run.
Although language is a phenomenon that deeply affects culture and is affected by it, it can hardly describe by itself culture, but it is often used together with so-called ethnic characteristics as a reasonable proxy for measuring cultural differences, though it is by far not the only yardstick: Chapter 21 by Aldashev and Platteau and Chapter 20 by Schwartz in this volume are devoted to other dimensions of culture.
Two important empirical issues have to be tackled in studying diversity: (i) how does one measure cultural, ethnic, and linguistic differences, and (ii) how does one identify cultural groups (the so-called group identification issue) and the resulting fractionalization of the society.
The various aspects of cultures are hard to describe and so are the distances between cultures, though several attempts have been and are still being made by scientists to measure them. Here, we shall use language as a proxy for culture and/or ethnicity. There are of course exceptions. As Storti (2001) shows, there exist large cultural differences that may lead to sometimes dramatic misunderstandings even between Americans and Britons, though they speak (almost) the same language. The same is true for Flemish-speaking Belgians and Dutch people, though again there are some small linguistic differences. On the other hand, it seems difficult to find two peoples or countries that share the same culture, but speak different languages. Thus, broadly speaking, there is a one-to-one correspondence between languages and cultures, but linguistic diversity may be easier to apprehend than cultural diversity, since it is reasonably easy to check which native language is spoken and to measure distances between languages (see Section 19.2.1).
It is more difficult to find a one-to-one mapping between cultural groups and countries. These often result from artificial and imposed borders, and a specific country may host several linguistic groups, while a former linguistic group may be spread over several countries.3 As Laitin (2000, p. 143) points out, it is also true that ‘people have multiple ethnic heritages, and they can call upon different elements of those heritages at different times. Similarly, many people throughout the world have complex linguistic repertoires, and can communicate quite effectively across a range of apparently diverse cultural zones’. The importance of using native languages as identifiers of cultural groups is reinforced by Bretton (1976) who suggests that ‘[l]anguage may be the most explosive issue universally and over time. This mainly because language alone, unlike all other concerns associated with nationalism and ethnocentrism, is so closely tied to the individual self’. In fact, the first and most influential country-by-country identification widely known as ELF (ethnolinguistic fractionalization), conducted in the Soviet Union some 50 years ago (see Section 19.2.2), was based mainly on linguistic and historic origins of various groups, which, in many cases, are based on their native languages.
The mere presence of distinct linguistic groups is not necessarily a ‘bad thing’. As we will argue, a more diversified environment attracts creative individuals, ventures, businesses, and capital. The complementarities of workers’ skills can sometimes easily offset the costs of cross-cultural interactions. The European Union, which consists of 27 countries whose peoples speak many languages, has its problems, but it eliminated the threats as well as the actuality of military conflicts that were hovering in Europe for many centuries.
Linguistic as well as ethnic fractionalization or diversity could, however, also breed institutional wastefulness, bureaucratic inefficiency, and corruption, reduce political stability, and hamper economic growth, as shown by the sad and painful example of post-colonial Africa. How can a country (a region or a group of countries such as the European Union) deal with these negative aspects? A natural response often leads a fractionalized society to introduce a certain degree of standardization by adopting a smaller number of languages, including the possibility of one language that would be common to all. Standardization, however, creates disenfranchisement by depriving sometimes large segments of a society of their linguistic rights. In some cases, the disenfranchisement sentiment turns out to be relatively soft, as it was in France after the 1992 change of the Constitution that included an article imposing French as ‘the language of the Republic’. Linguistic discontent in Sri Lanka, however, resulted in a long and bloody war.
This chapter is organized as follows. Section 19.2 is devoted to ethnolinguistic diversity and fractionalization, their measurement, and their social and economic consequences. In Section 19.3 we turn to standardization policies that aim at reducing the economic losses due to excessive diversity. These policies may, however, lead to the linguistic disenfranchisement of large groups of a society, which could yield negative social and economic consequences, examined in Section 19.4. We conclude, in Section 19.5, with a discussion of the delicate balance between the goods and the ills of both diversity and standardization, and try to address the crucial question about how to sustain a manageable degree of diversity while implementing various standardization policies that may disenfranchise certain groups.
19.2 Linguistic Diversity and Fractionalization
The interdependence of language and culture captured by the Sapir–Whorf hypothesis is related to the concept of a native language that plays a crucial role in defining the patterns of human reasoning and behavior. One may speak several languages (and many people do), but they appear not to be fully substitutable and usually only one is the mother tongue. The importance of using one’s native language is underlined in Mandela’s quotation in the epigraph to this chapter. Serious conflicts due to misunderstandings are common even if the same language is used by some whose native tongues, and thus cultures, differ. Storti (2001) illustrates this by collecting cross-cultural dialogs and analyzing how people from different cultures (French, Germans, Americans, and Britons) attach different interpretations to the same words and sentences, according to their native cultures.
To illustrate, Nabokov’s (1955) own translation of his Lolita from English to Russian did not make him very happy, but otherwise had no major consequences. These may, on the contrary, be extremely important as is shown by Lewis (2004) in From Babel to Dragomans: Interpreting the Middle East, where he describes the famous example of Article 1(i) of UN resolution 242 of 22 November, 1967, drafted several months after the war between Israel and its Arab neighbors (Egypt, Syria, and Jordan) ended. The resolution, initially drafted in English, requires the ‘withdrawal of Israeli Armed Forces from territories occupied during the recent conflict’. Lewis (2004, p. 194) suggests that:
…it has been argued, and generally, conceded, that the omission of the article ‘the’ before ‘territories’ in the English text means that not all the territories are intended. The Russian text, which has no article since none exists in Russian, leaves, like the English text, the question open. In the Arabic version – unofficial since at that time Arabic was not yet an official UN language – the article is present as a stylistic if not a grammatical necessity.
In French the text is concerned with a ‘retrait des forces armées israéliennes des territoires occupés’. In this sentence, the article des comes from the contraction of two words: the preposition de meaning from and the article les meaning the, and could be interpreted as ‘all the territories’. It is impossible to deny the historical importance of that linguistic discrepancy.
Bellos (2011, pp. 24–26) has a beautiful story that did not cost as much blood as the previous one. He starts by arguing that law ‘is written in a language of its own that is almost impossible to understand, and what can’t be understood can’t be translated’. He then describes the problem created by the French expression droits de l’homme, in English human rights and in German Menschenrechte. The only correct form is the last one, since in German there exists Mann for man, Frau for woman, but there also exists Mensch which has no gender-flavor. The French word homme means man and at some point feminists insisted to also benefit from droits de la femme. Since the word humain does not have the exact same meaning as human, the French decided to re-christen the old expression (which goes back to the French revolution of 1789) and call it droits de l’Homme, with a capital H, pretending that the capital makes it lose its gender and means Mensch.
These arguments have a somewhat surprising practical impact on the definition of the concept of diversity and its measurement. Indeed, it would be natural to partition a society into groups of speakers who share the same native language, since in most cases it is easier to identify individuals on the basis of their sole native language than of other characteristics. Then, however, comes the question about how different languages can be, to which we turn now.
19.2.1 Distances Between Languages
The last 1250 pages of the 2009 edition of Ethnologue is a mine of information on the 6909 languages that are currently spoken in the world, on where they are spoken, as well as their (estimated) number of speakers. Whether 6909 is large or small is open for discussion, and so is the number itself, since it results from a rather subjective count and does not include dialects. When does one consider two languages as being different? Are Venetian and Italian the same language? Are Serbian and Croatian? Flemish and Dutch? English in the United Kingdom and in the United States? This is a crucial issue for ‘group identification’ of speakers of a given language. Even if languages are distinct, should we consider speakers of Serbian and Croatian as members of different groups in the same way as speakers of Greek and Turkish? After all, these two pairs are drastically different: Serbian and Croatian are very similar to each other, whereas Greek and Turkish belong to entirely different linguistic families – Greek is an Indo-European language, while Turkish belongs to the Altaic group.
To address these questions, one has to recognize some degree of distinctiveness between languages. Is it vocabulary that makes them different, or pronunciation, phonetics, phonology, syntax, or grammar, among others (and this is even without going into the fundamental issue of whether languages have a common structure)? In what follows, we discuss alternative ways of measuring distances between languages.
19.2.1.1 Linguistic Trees
The need for classifying languages started in the early nineteenth century, with the birth of linguistics as a scientific discipline, though naïve ‘linguistic trees’ had been drawn before that. These work like genealogical trees, which go from a common shared ancestor (the root of a family) to successive generations. Table 19.1 illustrates a tree with a common origin, the assumed ‘root’ or ‘proto-language’ of all our languages.4 This root gave birth to several important level-1 families including Eurasiatic. In Table 19.1, we only illustrate the various level-2 subfamilies of Eurasiatic (from Eskimo-Aleut to Indo-European) and then go into level-3 details (from Germanic to Indo-Iranian) that have as root Indo-European.5 In Table 19.2, we further go into the descendants of Germanic, with six additional levels: today’s English, for instance, is at level 6 together with Scots and Yinglish, and descends from West Germanic (level 4) and English (level 5), while Standard German appears at level 9. These trees are constructed using a host of different characteristics of each language, as well as possible migrations.
Fearon and Latin (1999), Laitin (2000), and Fearon (2003) suggested calculating distances between the branches of linguistic trees as a proxy for distances between linguistic groups.6 In the original Fearon and Latin (1999) index (LANGFAM), for every pair of languages, the score takes the level of the first branch at which the languages break off from each other. The higher the number, the greater the similarity of languages.
To give an idea of how distances are calculated, consider German and Hungarian that come from structurally unrelated linguistic families: German is an Indo-European language, while Hungarian belongs to the Uralic family. Therefore, the two languages share no common branches and break off from the first branch: their score is 1. German and Italian share one common level since they are both Indo-European, but separate immediately after that into Germanic and Italic groups, making their score equal to 2. German and Danish share two classifications: they are both Indo-European and Germanic, and break off from the third branch, as German belongs to the Western branch of the Germanic group, while Danish to the Northern branch. Thus, their score is 3. German and English share three common levels: in addition to being Indo-European and Germanic, both belong to the Western branch of the Germanic group, and their score is 4. Similarly, German and Yiddish pick up a score of 5, and Afrikaans and Dutch pick up a score of 6. Distances are derived by properly normalizing the scores.
19.2.1.2 Lexicostatistical Distances
Lexicostatistical distances are based on similarities and supposed common roots of words in the vocabularies of various languages. Following Ruhlen (1994, p. 12), languages can be related or similar and these similarities can be explained by three mechanisms only: (i) there may be words that look common for accidental reasons, (ii) languages may borrow words from other languages (e.g. English, which contains many French words), and finally (iii) two languages may descend from a common, older language (e.g. French, Italian, Spanish, and Portuguese, which belong to the same branch and have Latin as the ancestor).
Lexicostatistical distances are built on so-called cognate words, occurring in languages with a historical chain linking them via an earlier language, thus ignoring not only borrowings and accidental similarities, but also syntax and grammar.
Since it would be a daunting task to compare long lists of words for each couple of languages, linguists are forced to rely on a small selection of carefully chosen words – a so-called ‘list of meanings’. Morris Swadesh (1952) introduced some rigor in the choice of meanings to be basic enough to exist in all languages and cultures (such as animal, bad, bite, black, child, die, eat, eye, hunt, digits from 1 to 5), on which deductions can be based. Swadesh’s list consists of 200 basic meanings and is still in use nowadays.
Greenberg (1956) was the first to explicitly introduce the notion of distances between languages by using ‘an arbitrary but fixed basic vocabulary’, to compute ‘the proportion of resemblances between each pair of languages to the total list’ and then use this proportion as a distance between each pair of languages. Dyen et al. (1992) followed on this idea using Swadesh’s basic list of 200 words to classify 84 Indo-European speech varieties. They describe the lexicostatistical method as consisting of three7 steps:
i. Collecting for each meaning the words used in each speech variety under consideration.
ii. Making cognate decisions on each word in the list for each pair of speech varieties, i.e. deciding whether they have a common ancestral word or not or whether no clear-cut decision can be made.8
iii. Calculating the lexicostatistical percentages (i.e. the percentages of cognates shared by each pair of lists); these percentages lie between 1 (all words are cognate) and 0 (no cognate).
The numbers given in Table 19.3 are equal to 1 minus the percentage of cognates. They concern the distances between 25 European languages9 and the six European languages with the largest number of speakers in the European Union: two are Germanic (English and German), three are Romance (French, Italian, and Spanish), and one is Slavic (Polish). It is easy to check that Danish, Dutch, English, German, Icelandic, Norwegian, and Swedish are related. So are the Romance languages (Catalan, French, Italian, Portuguese, Romanian, and Spanish), the Slavic (Bulgarian, Czech, Russian, Serbo-Croatian, Slovak, Slovene, and Ukrainian), and the Baltic (Latvian and Lithuanian). Albanian and Greek are distant from any language belonging to the three previous families.
Table 19.3
Lexicostatistical distances between selected Indo-European languages (values ×1000).

Source: Dyen et al. (1992, pp. 102–117).
Distances based on trees are coarser than lexicostatistical distances, but are easy to construct on the basis of existing linguistic trees and can be established for all language families.
19.2.1.3 More about Linguistic Distances
In discussing various ways of measuring distances between languages, it is worth mentioning Chiswick and Miller’s (2007, Chapter 20) idea based on the difficulty speakers of one language face in acquiring another (non-native) language. Such a measure was established by Hart-Gonzalez and Lindemann (1993) using a sample of native Americans who were taught a variety of languages and whose proficiency was measured at different moments of time. The scores are assumed positively correlated with distances.10 If such distances were available for a large number of language pairs (and measured according to the same criteria), they would certainly be a very good alternative to the other two types of distances as they encompass most of the difficulties encountered in acquiring a language. Practical challenges, however, stand in the way of expanding the existing dataset.
To close the discussion on distances one has to point out the chasm between versions of the same language used in different countries and regions. There is, for example, a large (and ever-increasing) number of meanings that are represented by different words in the United States and Great Britain: ‘garbage’ and ‘rubbish’, ‘cell phone’ and ‘mobile’, ‘subway’ and ‘tube’, ‘faucet’ and ‘tap’, ‘janitor’ and ‘caretaker’, ‘eraser’ and ‘rubber’, ‘truck’ and ‘lorry’, to cite a few. Canadians do not always use similar words to those used by Britons and identical words can, as is well-known, produce different meanings.
We now turn to the issue of ELF, where linguistic distances will play an important role.
19.2.2 Ethnolinguistic Fractionalization and its Measurement
As suggested above, the impact of linguistic diversity on economic outcomes is ambiguous. Diversity facilitates the process of creation and innovation. This is studied by Lazear (1999), whose ‘global team’ with members from different cultures or countries contributes to the success of the project the team is engaged in. While matching individuals from different cultures and languages could impose additional costs on the organization, the complementarity of workers’ varied skills may easily offset the cost of cross-cultural interaction. Linguistic and ethnic fractionalization or diversity could, however, also lead to dysfunctional government institutions, bureaucratic inefficiency, corruption, excessive lobbying and rents, and misguided economic and social policies. The tragic example of post-colonial Africa, where Cameroon has 279 languages, the Democratic Republic of Congo 217, Nigeria 521, Sudan 134, and Tanzania 129, makes it well-known, but nevertheless painful. The positive and negative empirical aspects of ethnolinguistic fractionalization are covered by Montalvo and Reynal-Querol in Chapter 18 of this volume. For the sake of completeness, we nevertheless discuss some general features, which make some overlap with Chapter 18 unavoidable.
The numbers of distinct communities or ethnic groups have often led to the argument that linguistic fractionalization has to be reduced to enhance economic progress. To make quantitative statements one has to partition a country into distinct linguistic communities. This group identification problem is not always an easy task.
19.2.2.1 Group Identification
As noted earlier, the first comprehensive country-by-country worldwide study of ethnolinguistic divisions was undertaken by a group of about 70 Soviet ethnographers from the Miklukho-Maklai Research Institute in Moscow, then a division within the Department of Geodesy and Cartography at the State Geological Committee of the USSR. Their construction, widely known as ELF, was based mainly on the linguistic and historic origins of various groups. The findings of this remarkable project, conducted long before the birth of the Internet and even computers, were published in 1964 in Atlas of the Peoples of the World (Atlas Narodov Mira, 1964). To a large extent, ELF was not influenced by the political pressures of those days.11 There is a strong similarity between ELF and other datasets, such as those of Roberts (1962) and Muller (1964). Moreover, Taylor and Hudson (1972) point out that ELF contains no systematic differences between countries from the Western and Eastern blocs. After the almost immediate introduction of the study to the Western literature by Rustow (1967) and Taylor and Hudson (1972), this dataset still remains the most influential source in research concerned with diversity.
ELF data were later expanded by Alesina et al. (2003), who disentangle the linguistic and ethnic aspects of fractionalization, and construct separate datasets determined by linguistic, ethnic, and religious affiliation. The impressive Alesina et al. datasets cover some 200 countries, and 1055 major linguistic and 650 ethnic groups. Alesina and Zhuravskaya (2008) went a step further and, by using census data, extended the previous dataset to cover about 100 countries on a subnational (regional) level. Desmet et al. (2009) constructed an alternative dataset using distances based on Ethnologue (2009).12
These datasets are used in conjunction with measures or indices that summarize them.
19.2.2.2 Diversity Indices
In most of the empirical and theoretical literature on diversity and fractionalization, the societal fractionalization index is determined by the probability that two randomly chosen members of a given society belong to different linguistic groups. In a monolingual society that consists of one group only, such probability, and thus the index of fractionalization, is equal to 0. If, on the other hand, the society consists of a large number of distinct groups with small memberships, the probability that two randomly chosen individuals speak different native languages is quite large. The highest degree of fractionalization (i.e. 1) obtains if each individual speaks a distinct language and the probability that two individuals share the same language is 0.
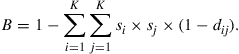
This fractionalization index has been derived independently (and, naturally, under different names) in many areas of research, including economics, political science, linguistics, sociology, genetics, biology, and other disciplines. The first reference appears in the contribution by Gini (1912), who called it the mutuality index. It was followed by Simpson’s (1949) index. In linguistics it was introduced by Greenberg (1956) as the monolingual non-weighted index or A-index.13 The formal representation of the A-index is given by:
![]()
where s1, s2, …, sn are the population shares of the n linguistic groups comprising the entire society, the sum of which is equal to 1. Note that the functional form of the A-index is equal to 1 minus the celebrated Herfindahl-Hirschman Index (HHI), defined for an industry with multiple firms.14 HHI is computed as:
![]()
where sk stands for the market share of firm k.
The A-index is not the only possible functional form. Another form, called entropy, was suggested by Shannon (1948):
Both indices satisfy two fundamental requirements of diversity formulated by Shannon:
i. Size uniformity. For a given number of groups, the index reaches its maximum when all groups are of the same size.
ii. Richness. If all groups are of equal size, the diversity index of a society with a larger number of groups will be larger.
The A-index offers a rather coarse treatment of diversity since it takes into account only the size of different groups. In practice, defining whether a group is distinct from another can be difficult, unless one uses distances.
Before proceeding with the formulation of indices based both on sizes of groups and their linguistic distinctiveness, consider the example of two West-European countries: Andorra and Belgium discussed in Desmet et al. (2009). In tiny Andorra roughly half of the population speaks Catalan and the other half speaks Spanish (two relatively similar Romance languages), whereas in Belgium about 60% speak Dutch, a Germanic language, and the other 40% speak French, a Romance language. Given the linguistic proximity of Spanish and Catalan, as opposed to French and Dutch, one would expect Belgium to be linguistically more diverse than Andorra, though the A-index is larger for Andorra. To overcome this odd property of the A-index, Greenberg (1956) proposed a so-called B-index, which accounts for distances between groups:
To verify that the A-index is, indeed, a special case of B, note that for every term that includes different groups i and j, the A-index sets the distance dij equal to 1, so that the term vanishes. If i and j are identical, dij = 0, so that the term boils down to si × si. Therefore, the A-index collects only si × si terms; all the others will be equal to 0.
By using some simple algebra, it is easy to transform this index into the following more useful form:15
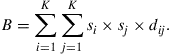
Note that B has a nice intuitive interpretation: it represents the average linguistic distance between all pairs of members of the society.
Index B has an important advantage over A since it satisfies a ‘continuity’ property: if the distance between two groups is close to 0, the diversity of the society with two similar groups (e.g. in Andorra) is close to the extreme case of a homogeneous society where both groups are merged into a single one. In the Desmet et al. (2009) study of the linkage between societal diversity and the scope of redistribution in a sample of 218 countries, the distance-based index has an explanatory power that is far superior to that of the A-index.
Desmet et al. (2005) propose a variant of the B-index in the case of a dominant group (called center) as in Spain, Russia, Kyrgyzstan, Laos, Thailand, Iran, Saudi Arabia, and Kuwait, among others.16 Their PI-index takes into account only the distances between the center and peripheral groups, but not between peripheral groups themselves. The functional form of the peripheral index PI is similar to B, except that the distance between every pair of peripheral groups is 0. Thus, in a society with a central group whose population share is sc, the PI-index contains only si × sc × dic terms where dic is the distance between language i and the language of the central group. Unlike the A-index, the B- and PI-indices fail to satisfy Shannon’s size-uniformity and richness conditions.
19.2.3 Distances: Economic Impact
In this section, we examine the economic impact of linguistic distances only. The reader will find a full discussion of the economic impact of diversity in Chapter 18 of this volume.
19.2.3.1 Impact on International Trade
The process of globalization has forced workers (essentially white collar workers) to learn foreign languages in order to break linguistic barriers. In most cases, Europeans have chosen English as a second language and English has become the lingua franca in Europe. Worldwide, English is spoken by more than 1.5 billion people (Crystal, 2003), and is probably the language that is most often used in international contracts and trade.
Studies on the impact of countries’ linguistic differences on bilateral trade flows are often based on what is known as the ‘gravity model’, whose name comes from its analogy with Newton’s Law of Universal Gravitation. Newton’s reasoning was that any two objects A and B in the universe exert gravitational attraction on each other with a force that is proportional to the product of their masses and inversely proportional to (the square of) the distance that separates the two objects. Tinbergen (1962) suggested applying this law to the analysis of international trade flows between countries A and B, assuming that the attraction force represents the volume of trade between A and B, the masses are measured by wealth or income (population, gross domestic product, etc.) in each country, and distance is represented by the geographic distance between the capitals of A and B. Both masses should have a positive effect on trade between A and B, while distance should have a negative effect.
Economists soon realized the importance of alternative indicators of distance, such as transaction costs caused by the search for trading partners, bilateral tariffs, non-tariff barriers (prohibiting imports of wines containing sulfites), countries’ geography (adjacency, islandness, landlockedness, common sea), former colonial links, immigrants (who could facilitate trade relations between countries by building social and commercial networks), common markets and common currency zones, and of course linguistic (but also cultural and genetic) distances.
Melitz’s (2008) study is of particular interest, since he uses two measures of linguistic distances between trading partners and tries to estimate their effect separately. Open-circuit communication (OCC) demands that the language be either official or widely spoken (at least 20% of the population knows the language). Spanish, for instance, will be an OCC between Bolivia (where 44% of the population knows Spanish) and Mexico (88%). Likewise, Arabic will be an OCC between Mauritania (38%) and Iraq (58%). Melitz identifies 15 such languages. A direct communication (DC) language is a language that is spoken by at least 4% in each country. The rationale for introducing this second measure is based on Melitz’s claim that any linguistic distance measure works in explaining the intensity of trades, but not all of them tell the same story. He suggests to distinguish channels through which the effect takes place, and separates therefore OCCs that depend on translation (which can be produced as long as there are enough people who can provide it in both countries) and DCs that make possible direct communication between traders. His estimation results point to the following conclusions. DC has obviously the largest positive effect on trades: a 10% increase in the probability that two citizens, one in country A, the other in B, speak the same language increases their trades by 10%. European OCCs also contribute, but somewhat less.17 Interestingly enough, Melitz shows that English is not more effective than other European languages in promoting trade. However, in all cases distances matter and the larger the linguistic distance between two countries, the less they trade.
19.2.3.2 Impact on Migrations
While migration decisions are to a large extent based on the existence of networks of former immigrants in the country of destination, the decision to migrate is also influenced by a common language between the source and the destination country. A common language is also more likely to attract high-skilled than low-skilled workers.
The standard approach in analyzing the tradeoffs of a decision to migrate is based on evaluating costs and benefits. The prospects of higher wages or other benefits18 are contrasted with the monetary and psychological costs, adjustment to a new culture, and possible uprooting of the family. The cultural and linguistic frictions in a new country can profoundly influence individual decisions. The degree of labor adjustment and complementarity to existing technological processes are also crucial to the well-being and the adaptation process. To illustrate this point, consider the flow of Chinese immigration to the United States and to Japan.19 Chinese immigrants find it difficult to integrate into Japanese production processes that are characterized by an intensive level of interaction and communication within the labor force. The situation is more flexible in the United States, where immigrants can rapidly exhibit a reasonably high degree of labor complementarity. In addition, even though Chinese characters are used to some extent in Japanese writing, their pronunciation is completely different from the Chinese. More importantly, the Chinese and English language structures are very similar, while being quite distinct from Japanese.
The differences are even more profound in the case of immigration from India to the United States and Japan. In 1990, Japan modified its restrictive immigration policy (Immigration Control and Refugee Recognition Act) to attract highly educated engineers and computer specialists from abroad, including India. Cultural and technological adjustment for Indians in Japan has, however, proved quite difficult and their satisfaction with working conditions is quite low compared with immigrants from other Asian countries.20 On the contrary, the ability of a large number of educated Indians to speak English mitigates the degree of cultural friction they face in the United States.
The form of the typical immigration equation is very close to the trade equation, but its theoretical underpinnings are different. Beine et al. (2011), for example, examine the determinants of migration flows between 1990 and 2000 from 195 countries to 30 Organization for Economic Cooperation and Development (OECD) countries. Since the incentives to migrate may be different, they also distinguish flows of low-skilled (with less than upper-secondary education) and high-skilled workers (with post-secondary education), studying how migrants sort themselves across destinations. Instead of estimating an equation for each skill level, they estimate how the ratio of high-skilled to low-skilled emigrants is affected by a certain number of determinants, the most important of which are the sizes of the diasporas, wages, and the generosity of immigration policies in the destination country. However, a common language between the country of origin and destination also has a strong influence on the migratory flow.21
Migrations are not only international and intercontinental, they happen also within a continent and even across regions within a country. Falck et al. (2010) examine the effect of various factors, including linguistic data on the variation of phonological and grammatical attributes across regions in Germany. They find that these have a significant effect on regional migrations, beyond what geographical distance only would suggest. They interpret the closeness of dialects as explaining cultural identity.
19.2.3.3 Impact on Literary Translations
Translation of literary works is an essential vehicle of transmitting culture and, as Susan Sontag said,22 ‘a passport to enter a larger life, that is the zone of freedom’. However, translations are often accused, mostly by sociologists but also by economists, of being dominated by English, or more precisely by translations ‘from English’.23 This is hardly surprising, since the population speaking English as a first language is, with the exception of Mandarin, the largest in the world. Moreover, English is spoken in countries with very distinct cultures (Great Britain, Ireland, Canada, the United States, former British colonies in Africa, South Africa, Australia, New Zealand, India, or the West Indies24). It can therefore be expected that more fiction is produced in English than in many other languages. This explains why publishers in these countries do not feel the same interest in translating from other languages, since the diversity that readers look for is available without translation.25
It is therefore true that English has a privileged (rather than a dominating or hegemonic) position in the market for novels. Authors who write in English benefit from three advantages: they have a large market in their own language, they also have access to other large markets since their books get translated, and finally they do not ‘need’ spending on translation costs. This is also reflected in the small numbers of British (and probably American) high school students who learn foreign languages. A recent European survey shows that while some 98–99% of children in the European Union study at least one foreign language, the number is 81% in Ireland and only 48% in the United Kingdom. Some do indeed benefit from free lunches.
Ginsburgh et al. (2011) nevertheless show that, if account is taken of factors such as production in the source language, reception in the destination language,26 and proximity between cultures (represented by lexicographic distances), the number of titles translated from English in fact falls behind the number of titles translated from other languages, including Scandinavian ones and French.
Domination, therefore, does not seem to come from the number of titles translated from English, but from the number of books sold, of which Dan Brown’s The Da Vinci Code is one example. As of May 2006, 60 million copies of the book, published in early 2003, were in print or sold.27 The Code was translated into 44 languages and by October 2004 it had generated some 16 titles supporting or debunking the Code.
19.3 Standardization
The negative aspects of fractionalization in a multilingual country or community are exacerbated by the substantial costs needed to maintain several (and sometimes a large number) of official languages. Even before the 2004 enlargement, the institutions of the European Union were the largest recruiter of interpreters and translators in the world. In 1999 the total translation and interpretation costs for the Commission alone amounted to some 30% of its internal budget.28 The burden of maintaining official languages is not limited to the direct costs of translation and interpretation. Communication constitutes an even more serious challenge in societies with a large number of official languages. Errors as well as the delays caused by translations may end up paralyzing multilateral discussions and negotiations.
The basic principles of political accountability and equality among citizens require, however, that all or at least a substantial part of the full-fledged translation services will have to be maintained in some of the EU institutions (Council of the European Union, European Council, European Parliament). Failing to provide translation services by the European Union may simply shift the provision of the service to individual countries, leading to duplications that may raise the total cost of services,29 as well as to divergent translations and interpretations.30
This will often lead a fractionalized society to introduce some degree of standardization. This concept is present in Max Weber’s celebrated rationalization theory outlined in his 1914 essay (translated into English in 1968): the practices of state standardization include a common currency, a common legal system, and a common administrative language.
The modes of introducing standardization vary across countries and historical periods. An extreme and bloody way of imposing such a policy is what came to be called ‘ethnic cleansing’, which was unfortunately practiced on various occasions. A less extreme and apparently more manageable way of standardizing is to impose a unique language or to force citizens to speak a unifying language in addition to their native tongue. The central power can also abolish education in languages it does not favor.31 French was imposed on all French provinces in 1539 by King François I, though in 1794, Henri Grégoire32 showed that in 68 out of 83 local states (départements) another tongue was spoken next to French and French was spoken by only three million out of 28 million citizens. In 1972, French President Georges Pompidou claimed that there ‘was no place for regional languages in France, which is destined to play a fundamental role in Europe’. In 1975, a new law stipulated that French must be used in commerce, by the media, and by the public service. In 1994, the Toubon Act made French the compulsory medium in consumer affairs, employment, education, and at congresses held in France (Spolsky, 2004, pp. 66–67).33
The russification of the territories of the Russian Empire is another example. In the mid–1800s, Lithuanian and Polish were banned from usage in public places, and later in schools and administrations. General Mikhail Muravyov, the Governor General of Lithuania, claimed that ‘what the Russian bayonet did not accomplish, the Russian school will’.34 All students were required to study Russian and social mobility was not possible without being proficient in Russian.
A similar standardization was imposed in China. After the 1911 Revolution China began promoting a vernacular Chinese based on Mandarin as the national language. Within a few years it was understood that the Beijing pronunciation would be the new standard. In 1958, the government initiated a linguistic reform whose main goal was to simplify written Chinese and promote a ‘general language’ called Putonghua. It is interesting to point out that a similar unifying effort to encourage the Singapore Chinese community to adopt Mandarin had a mixed effect; according to the 2002 census, only 45% of Chinese families speak Mandarin at home, while the rest speak other Chinese dialects or English.35
The attempt at enforcing a unique national language led to disastrous consequences in Sri Lanka (formerly Ceylon), which shows how emotional, explosive, and dangerous the choice of official or national languages may become. Sri Lanka has two major ethnic and linguistic communities: the Sinhalese majority, predominantly Buddhist, and the Tamil minority, mainly Hindu,36 who had peacefully coexisted over a period of about 2000 years. After 150 years under British rule, the island attained self-governance in 1948. The superior system of teaching English in northern Tamil regions allowed Tamils to have easier access and numerically disproportionate representation in university education and jobs in the prestigious government sector. According to deVotta (2004), in 1946, ‘Tamils made up 33% of the civil service and 40% of the judicial service. They also accounted for 31% of the students in the university system. In the medical and engineering fields, Tamils numerically equaled the Sinhalese’. The Sinhala-Only Act in 1956, considered by Tamil leaders as a form of apartheid, led to mass riots in which hundreds of people lost their lives. Brown and Ganguly (2003, p. 11) note that ‘the passage of the Sinhala-Only Act was a turning point in the Sinhalese-Tamil relations. Tamil grievances subsequently grew, because in Sri Lanka as elsewhere, language policies had wide-ranging implications for educational and economic opportunities’. The government later took a range of conciliatory measures in favor of the Tamil minority. However, this came too late and tens of thousands of lives were lost over the course of 26 years of a full-fledged civil war, which only recently came to an uneasy halt.37
Bellos (2011, pp. 202–223) points out that there exist also cases in which the language that gains prestige is the language of the conquered, which may even crowd out the language of the conqueror in some cases. This was so when the Akkadians conquered Sumer around 2250 BC. They adopted the Sumerian script and Sumerian became the mark of educated people. This also happened to Greek in the Roman Empire.
Standardization does not necessarily refer to the imposition of a unique language, but rather to restricting the number of languages used for official, legal or educational purposes. An example of such a policy is the so-called three-language formula adopted in India some 50 years ago. It implied that children in Hindi-speaking states would study three languages: Hindi, English, and one of the regional, preferably Southern, languages, whereas children in non-Hindi-speaking states were to be taught Hindi, English, and their regional language.38 The formula failed. The reasons were insufficient funding, lack of teachers, inadequate support of the regional administration, and little enthusiasm on the part of students and their families to undertake the required efforts to learn languages spoken in other regions. In Hindi regions, relatively little effort or resources were put into studying English and even less so in learning a third language. In Tamil Nadu, English and Tamil are studied quite extensively, whereas Hindi received lip service.
A variant of the three-language formula was introduced in Nigeria, the most populous African country with 141 million inhabitants who speak 527 languages39 and are divided into 250 ethnic groups (Ethnologue, 2009). The three-language formula, based on the use of Hausa (18.5 million speakers), Yoruba (19 million), and Igbo (18 million), was considered a unifying device. Like in India, its implementation was inhibited by the lack of qualified instruction and the resistance of linguistic groups, identified with one language, that were forced to learn another major language.
Linguistic standardization inevitably restricts the usage of some languages that are not included in the set of the official ones, but its effects go much beyond restricting access to information. Standardization may alienate groups of individuals whose cultural, societal, and historical values and sensibilities are not represented by the official languages and consequently create linguistic disenfranchisement.40 In the context of the European Parliament, for example (Report of Secretary General, document PE 305.269/BUR/fin, 2001):
…the right of an elected Member to speak, read and write in his or her own language lies in the heart of Parliament’s democratic legitimacy. The case for multi-lingualism is based not only on fairness to Members, from whichever country they are elected. It is necessary to ensure the support of citizens in all Member states; if Parliament does not recognize their language, it is less likely that citizens will recognize it as being their Parliament.
In short, standardization breeds disenfranchisement. However, how does one balance the effects of standardization and disenfranchisement? In the next section we examine several aspects of this important question.
19.4 Disenfranchisement
Before proceeding, we need to stress two important points. (i) Linguistic or ethnic fractionalization studied in Section 19.2 was implicitly considered to be exogenous and used as explaining the impact it had on economic outcomes such as trade, migrations, literary translations, growth, quality of governments, corruption, or military conflicts. ELF, for instance, represents a snapshot description of linguistic partitions existing across the globe in the 1960s. Of course, fractionalization had evolved before that: some languages had disappeared, while others were born over time as consequences of trades, migrations, wars, and others reasons, including voluntary or non-voluntary standardizations that are pervasive in our history and pre-history. Standardization gives way to new partitions that will at some point in 50 or 100 years be considered as exogenous, though they are no more exogenous than those that we studied in Section 19.2. (ii) The considerations on disenfranchisement that will follow can be seen as ex post measures about who speaks what, but also as a way of studying the possible consequences of proposed standardization policies.
Linguistic disenfranchisement is essentially based on the fact that the languages of some linguistic groups are not included in the list of official languages. In describing the linguistic situation in Africa, Phillipson and Skutnabb-Kangas (1995, p. 335) offer the following very blunt and succinct assessment that ‘[t]he majority of Africans are governed in a language that they do not understand’.
The statement, however, applies in many other circumstances and serves as basis for the quantitative analysis of linguistic disenfranchisement, which is presented below.
We now consider a multilingual society that faces the challenge of selecting a subset of languages to be used in official documents, for communication between institutions and citizens, debates in official bodies, etc. Call these languages core languages. Their choice may have a major negative impact on the well-being of some members by limiting their access to laws, rules and regulations, and debates in their elected or legislative bodies. In some cases these limitations could even violate the basic principles of the society. To determine the optimal set(s) of core languages, one has to weigh the costs and the benefits of linguistic standardization, but here we merely focus on the construction of disenfranchisement measures and their use to simulate results that can help politicians to decide on a ‘satisficing’ set of official languages.41
19.4.1 Measuring Disenfranchisement
Every member of a society may be characterized by his or her linguistic repertoire, represented by the languages he or she is proficient in. Although, as argued above, linguistic identity is usually associated with native languages, we extend our analysis to all languages spoken by an individual. Here, the argument is that in order to evaluate the functionality of linguistic policies, one may take into account all languages spoken by an individual and not his or her native language only. Thus, we distinguish between disenfranchisement indices based on native languages of an individual and those based on all languages he or she is proficient in. Indeed, in terms of disenfranchisement, an individual may judge the set of core languages on the basis of one criterion only: does his or her native language belong to this set or not. However, he or she may also be able to communicate in other non-native languages and we therefore examine both possibilities.
In addition, we also follow Greenberg (1956) and the discussion of fractionalization indices, and construct dichotomous and distance-adjusted indices. An individual is disenfranchised under the dichotomous approach (Ginsburgh and Weber, 2005) if he or she speaks no core language; he or she is not disenfranchised if he or she speaks at least one core language. However, even if an individual speaks no core language, some of those languages may nevertheless have common roots with his or her native tongue and could be considered as reducing his or her disenfranchisement. Taking into account this argument, we also examine indices adjusted for linguistic proximity (Ginsburgh et al., 2005).
This leads us to consider four indices: dichotomous indices, based on native languages only, dichotomous indices based on all spoken languages, continuous (distance-adjusted) indices, based on native languages only, and continuous (distance-adjusted) indices, based on all languages spoken by an individual.
The distinction between native and non-native languages has an important implication for the analysis. If we consider native languages only, it is sufficient to disaggregate the society into groups according to native languages as is done in ELF. If disenfranchisement is determined on the basis of the entire linguistic repertoire of individuals, the division according to native languages is too coarse and we need to disaggregate into clusters of individuals with identical linguistic repertoires. For example, in a society with two spoken languages there are three clusters: monolingual speakers of each of the two languages and bilingual individuals who speak both.
Since the discussion of how to construct these indices is rather technical, we refer the reader to Ginsburgh and Weber (2011, pp. 130–133).
19.4.2 Simulating the Effects of Standardization in the European Union
The official linguistic policy of the European Union is based on Regulation 1/1958 of the Treaty of Rome drafted in 1958, recognizing Dutch, French, German, and Italian as official languages. However, this number went from four in 1958 to 23 in 2011. The regulation basically says that all official languages should have equal treatment. Reality, including in the Parliament, is very different, however, as discussed by Ginsburgh and Weber (2011, pp. 162–177). It is unavoidable that at some point the European Union, which now counts 27 countries and 23 official languages, will have to consider a certain degree of linguistic standardization.
We now show how the various indices can be used to judge the impact on disenfranchisement of various choices of core languages. We formulate a procedure for selecting subsets of languages among all eligible 23 official languages so as to minimize the EU-wide disenfranchisement rate, which measures the share of citizens (in the European Union as a whole, but also in each Member country) who would be unable to communicate under a particular restricted set of languages.42 Our assumption is that the members of the Council who are responsible for the language policy would take such information into account when casting their vote for or against a specific standardization proposal.43 We implement this procedure for different subsets consisting of one, two, three, etc., languages, focusing on the obvious subset consisting of the following six languages: English, French, German, Italian, Spanish, and Polish, which represent the main families of languages spoken in Europe (Germanic, Romance, and Slavic).
In order to deal with the language repertoires, one has to use census or survey data that include questions on the entire repertoire of each individual and not only on the native language or on the language that is spoken at home. In addition, it is useful to have some idea of the proficiency of the languages and this is rarely dealt with in censuses, more often in surveys.
The Special Eurobarometer 243 (2006) survey on which the simulations are based was carried out in November 2005 in 29 countries, including all 25 member countries of the European Union, Bulgaria, and Romania (who were not yet members in 2005), and two candidate countries, Croatia and Turkey. In most countries, 1000 citizens were interviewed.
19.4.2.1 Who Does Not Speak English?
Table 19.4 exhibits disenfranchisement rates44 for each of the seven most widely spread languages, in each EU Member country. The results lead to several observations. (i) Even though English is the most widely spoken language, it would nevertheless disenfranchise 62.6% of EU citizens if it were the only official language. Moreover, there are only seven countries where less than 50% of the population would be disenfranchised. However, the EU-wide disenfranchisement rate rises to 75.1% and 80.1% if English were replaced by German or French, respectively, and it would be even worse if Italian or Spanish were chosen. (ii) With the exception of English, German, French, and Italian (and Russian, not shown in Table 19.4), no language is spoken by more than 5% of the population in more than two European countries. (iii) Although Russian is not an EU official language, it disenfranchises fewer people in the European Union than many official languages (Bulgarian, Czech, Danish, Estonian, Finnish, Greek, Hungarian, Irish, Latvian, Lithuanian, Maltese, Portuguese, Slovak, Slovenian, and Swedish).
Table 19.4
Disenfranchisement in European languages: all respondents (in %).
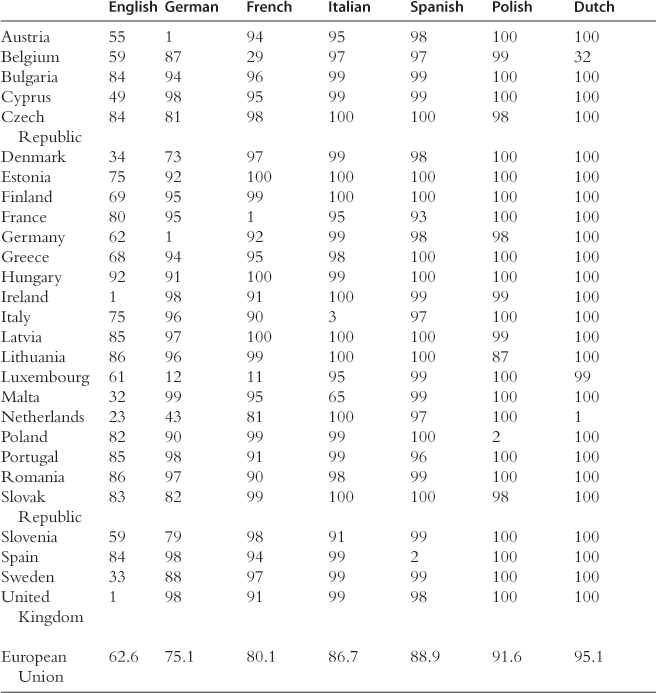
Source: Fidrmuc et al. (2007).
Young people often speak foreign languages more readily, but English is the only language for which disenfranchisement rates are significantly lower among younger generations. If English were the only official language, EU disenfranchisement would drop from 62.6% to 44.6%, if the proficiency level of English in the whole population were equal to that of the 15- to 29-years-old generation. Therefore, one could expect that in 30–40 years from now, English will be spoken by more than half of the EU population. A similar calculation for German or French would lead to global disenfranchisement rates of 73% and 77%. Italian, Spanish, and Dutch would even do worse.
A linguistic reform in which English were the only official language would, nevertheless, not be satisfactory.
19.4.2.2 More Languages Than English
We now address the question of whether a subset (more than one) of official languages could do better. Calculating disenfranchisement for every subset of 23 languages would be a cumbersome task and nobody could read the millions of tables that would be the outcome of such a computation. Therefore, we chose a procedure that selects the subsets of languages that minimize disenfranchisement in the European Union for every given number of languages. Let m take the values 1, 2, 3, …, 23. Then, for every m, denote by Tm the subset of the 23 languages that minimizes the disenfranchisement rate over all sets with m languages, ending up with a set Tm for every m between 1 and 23.
Although this calculation is conceptually simple, it would in practice still require a very large number of computations if the number of languages among which core languages are chosen is large.45 However, since European languages differ considerably in the number of their speakers, the scope of the analysis can be narrowed down substantially. For instance, it is clear that English should be introduced first, followed by French or German, then the other large languages (Italian, Spanish, and Polish), and so on. In this way, identifying the most suitable combination is often easy and at any stage in the analysis the number of possibilities to be considered is relatively small.
In principle, a language may enter into the optimal set (given the number of languages) and then move out when we add one or two more languages. This does not happen in our case; once a language is in the optimal set containing m languages, it will stay there, whatever the number of additional languages in optimal sets containing more languages.
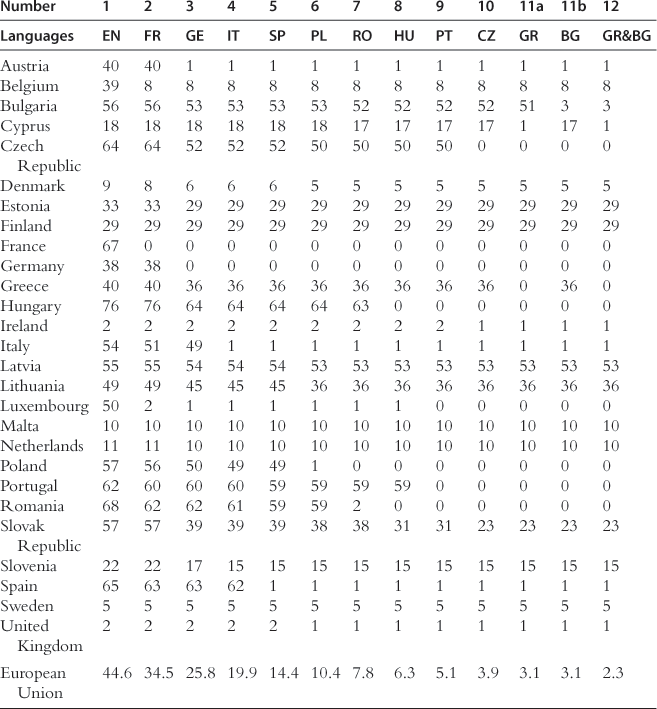
The results of these computations are reproduced in Tables 19.5 and 19.6 respectively, for all respondents and respondents who are less than 30 years old.46 Each column indicates which language should be added to the subset formed by the languages reported in the preceding columns so as to minimize the EU disenfranchisement rate. Consider first the results where all respondents are taken into account. The optimal one-language set is English. For two languages, the optimal set contains English and German, and so on.47
Table 19.5
Disenfranchisement in the sequence of optimal language sets: all respondents (in %).
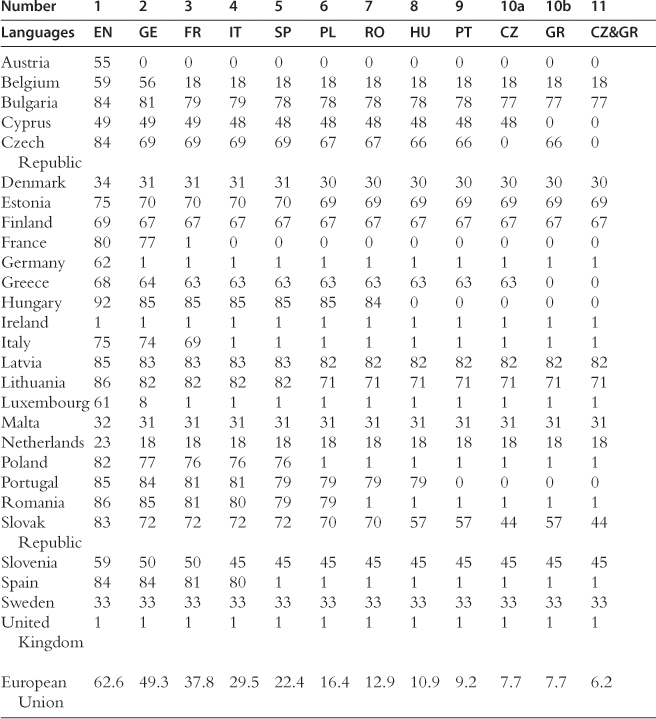
One language is added to the previous ones in each column. In Columns 10a and 10b, two languages result in the same percentage reduction in disenfranchisement. In Column 11, they are both added to the set. Languages are abbreviated as follows: Czech (CZ), English (EN), French (FR), German (GE), Greek (GR), Hungarian (HU), Italian (IT), Spanish (SP), Polish (PL), Portuguese (PT), and Romanian (RO).Source: Fidrmuc et al. (2007).
Table 19.6
Disenfranchisement in the sequence of optimal language sets: young respondents (in %).
One language is added to the previous ones in each column. In columns 11a, and 11b, two languages result in the same percentage reduction in disenfranchisement. In column 12, they are both added to the set. Languages are abbreviated as follows: Bulgarian (BG), Czech (CZ), English (EN), French (FR), German (GE), Greek (GR), Hungarian (HU), Italian (IT), Spanish (SP), Polish (PL), Portuguese (PT), Romanian (RO). Source: Fidrmuc et al. (2007).
The marginal contribution of each additional language to reducing disenfranchisement falls under 1% of the EU population once the number of languages exceeds 13 and the differences between marginal contributions attributable to further candidate languages are often minute. To save space, we only report on the first 11 languages.
English is clearly the first language in any sequence as it is spoken well or very well by one-third of the EU population. German and French are in a close race for the second position; German, with a 49.3% disenfranchisement rate, fares better than French with 50.6%. The bundle of three languages leads to a disenfranchisement rate of 37.8%. Italian, Spanish, or Polish would each make almost the same contribution to reducing disenfranchisement further. Spanish, in turn, performs only marginally better than Polish. With the six largest languages included, 16% of the EU population would still remain disenfranchised. Adding Romanian brings the residual disenfranchisement rate further down to 13%. Of course, important differences across countries remain. The most dramatic case is Hungary, where only 16% of the population can speak one of the first seven languages. Not surprisingly, Hungarian becomes the eighth language in the sequence. This also has a positive impact on Slovakia, whose disenfranchisement rate declines from 70% to 57%. Portuguese is the ninth language, followed by Czech and Greek tied in tenth position.
The disenfranchisement rates in Table 19.5 are a snapshot of the situation at the time of the survey (end of 2005). However, the knowledge of languages changes over time. In particular, the pattern of learning foreign languages may change both with respect to languages that are popular and the frequency with which people learn other languages. Therefore, we calculated a sequence of optimal sets based on the disenfranchisement rates of the youngest generation (15–29 years old) only. This sequence is presented in Table 19.6.
The first difference is that German, which was second to enter in Table 19.5 (whole population), is replaced by French. This is due to the fact that among the younger generation in Germany and in Austria, 60% of the population knows English, so that German becomes less necessary. Beyond the first two languages, the sequence is essentially the same as before, and includes English, French, German, Italian, Spanish, Polish, Romanian, Hungarian, Portuguese, Czech, Greek, Bulgarian, Dutch, Finnish, Slovak, Lithuanian, and Latvian (the last four languages, along with Russian, are all in a tie for the fourteenth position). The criterion used before (a language’s contribution to reducing disenfranchisement should be at least 1%) now results in 10 languages. The disenfranchisement rate that would prevail among the youngest generation with 10 official languages is 3.9%. This percentage is even likely to decrease further as more and more children in upper secondary education study languages (essentially English, but to some extent French and German also).
Ginsburgh and Weber (2011, pp. 159–160) also report results with continuous indices in which distances are accounted for. In the single-language (English-only) scenario, accounting for linguistic proximity reduces the EU-wide disenfranchisement considerably, from 62.6% to 43.1%. Adding French reduces disenfranchisement also in all Romance-language countries, bringing the EU-wide rate to 24%. A deviation from the two sequences reported above is that Polish now comes in the third position ahead of German that becomes fourth. Italian is the fifth language followed by Hungarian and Spanish. Greek ties with Romanian for the eighth position. The requirement of at least 1% contribution to reducing disenfranchisement cuts off the sequence at nine languages with the resulting disenfranchisement rate of 2.9%. Adding further languages (Czech, Finnish, Bulgarian, Swedish, and Portuguese) brings the residual disenfranchisement rate to 0.9%. The gains from adding the remaining languages (Danish, Dutch, Estonian, Irish, Latvian, Lithuanian, Maltese, Slovak, and Slovene) are negligible.
These sequences of sets that minimize the global rate of disenfranchisement in the European Union could now be used to simulate the political feasibility of linguistic reforms on the basis of which the members of the European Council (or of the Parliament) could cast votes on their preferred set.48 If an agreement can be reached on a subset of today’s 23 official languages, one could consider different possibilities that will compensate those countries whose languages are not included in the official set or make countries whose languages are included pay for the support of the official set.49
19.5 Concluding Remarks
The role of culture in affecting economic outcomes has recently become the issue of intensive interest in various branches of economics.50 Our main focus was linguistic diversity as one of the important aspects of cultural heterogeneity.
The issue of linguistic diversity can be traced back to the well-known mythological attempt of a monolingual ‘people’ to build the Tower of Babel to be closer to the sky. God disliked the idea and confused the builders so that one person could no longer understand another. Today most countries are (still) multilingual (with notable exceptions, such as North Korea) and the challenges of multilingual societies persist everywhere.
It is often argued that linguistic diversity represents an impediment to economic progress and institutional development of all sorts. To address this question, one needs to quantify linguistic fractionalization. This, in turn, requires a way of dividing a society into distinct groups, and possibly taking into account ‘how much’ distinct they are, by using linguistic (or other types of) distances. To mitigate the negative impact of linguistic fractionalization, societies have often chosen to standardize by reducing the number of official languages. The numerous examples of such standardization policies (in the Russian Empire, India, and Sri Lanka, among many others) often lead to the feeling of disenfranchisement experienced by some population groups. The American-Chilean professor and writer Ariel Dorfman (2002, p. 92) describes those feelings in the context of the ascendency of English by arguing that it restricts the access of many to her or his own language, leaving:
…too many invisible losers, too many people silenced. Do you come from a place that does not control a language that commands respect? Do you reside in a language whose existence does not have the kind of value in the marketplace that can get you a good job and help you in everyday’s struggle to survive?
The search for a compromise between efficiency and the sentiment of being disenfranchised represents a serious challenge for any multilingual country or union. In this chapter, we have considered a formal analysis of linguistic disenfranchisement and have described how it can help in analyzing linguistic policies, using as example the European Union, which has to cope with 23 official languages. The aim of the chapter was to formally examine two opposing forces: standardization and efficiency, on the one hand, and cultural attachment and linguistic disenfranchisement, on the other, and to outline ways of bringing them to balance each other.
Many problems remain open, in particular the speed at which people acquire languages, forgetting their own mother tongue, as well as the speed at which languages change and become ‘new’ languages in our globalizing world. Chapter 17 on the dynamics of cultural changes by Bisin and Verdier in this Handbook sheds light on how this issue can be tackled.
Acknowledgments
We are grateful to T. Skopintseva, D. Throsby, and S. Weyers for discussions and comments, and to A. Harutyunyan for her help in preparing this manuscript. The chapter contains some abridged and edited material drawn from Ginsburgh and Weber (2011).
References
1. Alesina A, Devleeschouwer A, Easterly W, Kurlat S, Wacziarg R. Fractionalization. Journal of Economic Growth. 2003;8:155–194.
2. Alesina, A., Zhuravskaya, E., 2008. Segregation and the quality of government in a cross-section of countries. NBER Working Paper 14316, NBER, Cambridge, MA.
3. Atlas Narodov Mira, 1964. The Miklucho-Maklai Ethnological Institute at the Department of Geodesy and Cartography of the State Geological Committee of the Soviet Union.
4. Beine M, Docquier F, Özden Ç. Diasporas Journal of Development Economics. 2011;95:30–41.
5. Bellos D. Is That a Fish in Your Ear. Penguin Books 2011.
6. Boas F. Race, Language and Culture. Chicago, IL: University of Chicago Press; 1940.
7. Bossert, W., D’Ambrosio, C., La Ferrara, E., 2006. A generalized index of ethno-linguistic fractionalization. IGIER Working Paper 313, Università Bocconi, Milan.
8. Bretton H. Political science, language, and politics. In: O’Barr WM, O’Barr JF, eds. Language and Politics. The Hague: Mouton; 1976; 432–448.
9. Brown M, Ganguly S. Fighting Words: Language Policy and Ethnic Relations in Asia. Cambridge, MA: MIT Press; 2003.
10. Carriére J-C, Eco U. N’espérez pas vous débarrasser des livres. Paris: Grasset & Fasquelle; 2009.
11. Chen, M.K., 2012. The effect of language on economic behavior: evidence from savings rates, health behaviors, and retirement assets. Working Paper, Yale School of Management and Cowles Foundation, New Haven, CT.
12. Chiswick B, Miller P. The Economics of Language: International Analyses. London: Routledge; 2007.
13. CIA World Factbook, CIA 2009. US Government Printing Office, Washington, DC. Online version available: <https://www.cia.gov/library/publications/the-world-factbook/>.
14. Crystal D. English as a Global Language. Cambridge: Cambridge University Press; 2003.
15. De Certeau M, Julia D, Revel J. Une Politique de La Langue: La Révolution Française et Les Patois. Gallimard, Paris: L’enquête Grégoire; 1975.
16. Desmet, K., Ortuño-Ortín, I., Weber, S., 2005. Peripheral diversity and redistribution. CEPR Discussion Paper 5112, CEPR, London.
17. Desmet K, Ortuño-Ortín I, Weber S. Linguistic diversity and redistribution. Journal of the European Economic Association. 2009;7:1291–1318.
18. De Swaan A. Words of the World. Cambridge: Polity Press; 2001.
19. deVotta N. Ethnic domination, violence and illiberal democracy. In: Alagappa M, ed. Civil Society and Political Change in Asia. Stanford, CA: Stanford University Press; 2004; 292–323.
20. Dorfman A. The nomads of language. American Scholar. 2002;71:89–94.
21. Dyen I, Kruskal JB, Black P. An Indo-European classification: a lexicostatistical experiment. Transactions of the American Philosophical Society. 1992;82:1–132.
22. Easterly W, Levine R. Africa’s growth tragedy: policies and ethnic divisions. Quarterly Journal of Economics. 1997;112:1203–1250.
23. Ethnologue. Ethnologue: languages of the world. In: Lewis MP, ed. Dallas, TX: SIL International; 2009.
24. Falck, O., Heblich, S., Lameli, A., Südekum, J., 2010. Dialects, cultural identity, and economic exchange. Discussion Paper 4743, IZA, Bonn.
25. Fearon J. Ethnic and cultural diversity by country. Journal of Economic Growth. 2003;8:195–222.
26. Fearon, J., Latin, D., 1999. Weak states, rough terrain, and large ethnic violence since 1945. Paper Presented at the Annual Meeting of the American Political Science Association, Atlanta, GA.
27. Fearon J, Laitin D. Ethnicity, insurgency and civil war. American Political Science Review. 2003;97:75–90.
28. Fernandez, R., 2010. Does culture matter? NBER Working Paper 16277, Cambridge, MA.
29. Fidrmuc J, Ginsburgh V. Languages in the European Union: the quest for equality and its cost. European Economic Review. 2007;51:1351–1369.
30. Fidrmuc, J., Ginsburgh, V., Weber, S., 2007. Ever closer union or Babylonian discord? The official-language problem in the European Union, CEPR Discussion Paper 6367, CEPR, London.
31. Fidrmuc J, Ginsburgh V, Weber S. Voting on the choice of core languages in the European Union. European Journal of Political Economy. 2009;25:56–62.
32. Fujita M, Weber S. Immigration quotas in the globalized economy. Journal of the New Economic Association. 2010;7:10–23.
33. Ganne V, Minon M. Géographies de la traduction. In: Barret-Ducrocq F, ed. Traduire l’Europe. Paris: Payot; 1992; 55–96.
34. Gini, C., 1912. Variabilità e mutabilità. Studi Economico-Giuridici della R. Universitadi Cagliari 3, 3–159. In: Pizetti, E., Salvemini, T. (Eds.), (1955). Memorie di metodologica statistica. Libraria Eredi Virilio Vechi, Roma (Reprinted).
35. Ginsburgh V, Ortuño-Ortin I, Weber S. Disenfranchisement in linguistically diverse societies The case of the European Union. Journal of the European Economic Association. 2005;3:946–964.
36. Ginsburgh V, Weber S. Language disenfranchisement in the European Union. Journal of Common Market Studies. 2005;43:273–286.
37. Ginsburgh V, Weber S. How Many Languages Do We Need? The Economics of Linguistic Diversity. Princeton, NJ: Princeton University Press; 2011.
38. Ginsburgh V, Weber S, Weyers S. The economics of literary translation A simple theory and evidence. Poetics. 2011;39:228–246.
39. Greenberg J. The measurement of linguistic diversity. Language. 1956;32:109–115.
40. Guilmoto C, Sandron F. The international dynamics of migration networks in developing countries. Population: An English Selection. 2001;13:135–164.
41. Hagège C. Le souffle de la langue. Paris: Odile Jacob; 2000.
42. Hart-Gonzalez, L., Lindemann, S., 1993. Expected Achievement in Speaking Proficiency. School of Language Studies, Foreign Service Institute, US Department of State, Washington, DC.
43. Hechter M. The political economy of ethnic change. American Journal of Sociology. 1974;79:1151–1178.
44. Heilbron J. Towards a sociology of translation Book translations as a cultural world system. European Journal of Social Theory. 1999;2:429–444.
45. Heilbron J, Sapiro G. La traduction littéraire, un objet sociologique. Actes de la Recherche en Sciences Sociales. 2002;144:3–5.
46. von Humboldt W. The Diversity of Human Language-Structure and its Influence on the Mental Development of Mankind. Cambridge: Cambridge University Press; 1988; (originally published 1836).
47. Hutchinson, W., 2003. Linguistic distance as determinant of bilateral trade. Working Paper 01-W30R, Department of Economics, Vanderbilt University, Nashville, TN.
48. Janssen S. Foreign literature in national media. Arcadia International Journal for Literary Studies. 2009;44:352–375.
49. Kramsch C. Language and Culture. Oxford: Oxford University Press; 1998.
50. Ku, H., Zussman, A., 2010. Lingua franca: The role of English in international trade. Journal of Economic Behavior & Organization 75, 250–260.
51. Labar, K., 2010. What is hidden behind the indicators of ethno-linguistic fragmentation? Working Paper, Fondation pour les Etudes et Recherches sur le Développement International, Clermont-Ferrand.
52. Laitin D. Language policy and political strategy in India. Policy Studies. 1989;22:415–436.
53. Laitin D. What is a language community? American Journal of Political Science. 2000;44:142–155.
54. Lazear E. Globalization and the market for team-mates. Economic Journal. 1999;109:15–40.
55. Lewis B. From Babel to Dragomans: Interpreting the Middle East. Oxford: Oxford University Press; 2004.
56. Mamadouh, V., Hofman, K., 2001. The Language Constellation in the European Parliament, 1989–2004. Report for the European Cultural Foundation, Amsterdam.
57. Melitz J. The impact of English dominance on literature and welfare. Journal of Economic Behavior and Organization. 2007;64:193–215.
58. Melitz J. Language and foreign trade. European Economic Review. 2008;52:667–699.
59. Muller S. The World’s Living Languages. New York: Frederick Ungar; 1964.
60. Nabokov V. Lolita. Paris: Olympic Press; 1955.
61. Ngũgĩ wa Thiong’o. Decolonizing the Mind. In: The Politics of Language in African Literature. Oxford: James Currey; 1986.
62. O’Connor K. The History of Baltic States. Westport, CT: Greenwood Press; 2003.
63. Ota, H., 2008. Indian IT software engineers in Japan: a preliminary analysis. Discussion Paper 168, Institute of Developing Economies, Chiba.
64. Phillipson R, Skutnabb-Kangas T. Language rights in postcolonial Africa. In: Phillipson R, Rannut M, Skutnabb-Kangas T, eds. Linguistic Human Rights: Overcoming Linguistic Discrimination. Berlin: Mouton De Gruyter; 1995; 335–346.
65. Pym A. Scandalous statistics A note on the percentages of translation in English. The Newsletter of the Literary Division of the American Translators Association. 1999;29:19.
66. Roberts J. Sociocultural change and communication problems. In: Rice F, ed. Study of Second Languages in Asia, Africa, and Latin America. Washington, DC: Center for Applied Linguistics of The Modern Language Association of America; 1962; 105–118.
67. Rustow D. A World of Nations: Problems of Political Modernization. Washington, DC: Brookings Institution; 1967.
68. Ruhlen M. The Origin of Language. New York: Wiley; 1994.
69. Sapir E. Selected Writings of Edward Sapir in Language, Culture, and Personality. Berkeley, CA: University of California Press; 1949.
70. Sapiro G. Globalization and cultural diversity in the book market: The case of literary translations in the US and in France. Poetics. 2010;38:419–439.
71. Shannon C. A mathematical theory of communication. Bell Systems Technical Journal. 1948;27:379–423 623–656.
72. Simpson E. Measurement of diversity. Nature. 1949;163:688.
73. Special Eurobarometer 243, 2006. Europeans and their Languages. European Commission, Brussels.
74. Spolsky B. Language Policy. Cambridge: Cambridge University Press; 2004.
75. Steiner G. After Babel. Oxford: Oxford University Press; 1992.
76. Storti C. Old World, New World: Bridging Cultural Differences. Boston, MA: Intercultural Press; 2001.
77. Swadesh M. Lexico-statistic dating of prehistoric ethnic contacts. Proceedings of the American Philosophical Society. 1952;96:121–137.
78. Taylor C, Hudson M. World Handbook of Social and Political Indicators. Ann Arbor, MI: ICSPR; 1972.
79. Tinbergen J. Shaping the World Economy: Suggestions for an International Economic Policy. New York: The Twentieth Century Fund; 1962.
80. Warnow T. Mathematical approaches to comparative linguistics. Proceedings of the National Academy of Sciences of the USA. 1997;94:6585–6590.
81. Whorf B. Language, Thought and Reality: Selected Writings of Benjamin Lee Whorf. Cambridge, MA: MIT Press; 1956.
1Kiswahili is the lingua franca in almost all countries of the African East.
2In German, you are allowed to say ‘Morgen regnet es’ (It rains tomorrow), which is not correct in English or in French where you should say ‘It will rain tomorrow’ or ‘Demain, il pleuvra’.
3We will avoid the denomination ‘ethnolinguistic groups’ that is very often used in this literature and stick to the definition provided by Hechter (1974), who suggests that ethnicity rather refers ‘to the sentiments which bind individuals into solidary groups on some cultural basis. Ethnicity therefore alludes to the quality of relations existing between individuals sharing certain cultural behaviors’. Language may bind, but not necessarily so. Fearon (2003) and Labar (2010) also warn about the borderline and arbitrary decisions used to define ethnic groups. Again, it is easier to define linguistic groups than ethnic groups.
4Not all linguists agree that all languages have a unique root (monogenesis). Some think that languages appeared more or less simultaneously in different parts of the world and can thus not be related to a common ancestor (polygenesis). See, for example, Ruhlen (1994).
5The numbers between brackets represent the number of languages in the (sub)family. For example, there are 449 Indo-European languages, of which 53 are Germanic, 48 Italic, etc. Both Tables 19.1 and 19.2 are constructed on data provided by Ethnologue (2009).
6Fearon (2003) produces an impressive dataset for 822 ethnic groups in 160 countries. A variant of Fearon’s formalization is used by Desmet et al. (2009).
7Actually, four steps, the last one consisting in partitioning languages into a tree.
8See Warnow (1997) for further technical details.
9Basque, Estonian, Finnish, Hungarian, and Turkish (spoken in Cyprus) are excluded, since they do not belong to the Indo-European family.
10This distance is used by Chiswick and Miller (2007, Chapter 1), as well as by Hutchinson (2003), and Ku and Zussmann (2010).
11‘Politically delicate’ countries such as South and North Vietnam, South and North Korea, and Taiwan were nevertheless omitted.
12It is worth pointing out that almost all researchers on diversity refer to ELF as an index of ethnolinguistic fractionalization. In fact, ELF is merely a dataset. What the literature refers to as the ELF index is Greenberg’s A-index (see below) based on the ELF dataset, which was first calculated by Taylor and Hudson (1972). Likewise, the measures computed by Easterly and Levine (1997) are values of Greenberg’s A-index for the Muller and Roberts datasets, respectively, and have nothing to do with ELF. The same comment applies to recent studies of fractionalization that calculate various indices based on Ethnologue’s trees, the Britannica, the CIA World Factbook (CIA, 2009), or other datasets. Thus, an index that is not based on the Soviet 1964 dataset could be given different names, but ELF should not be one of them.
13This notation will be kept throughout this chapter.
14HHI is often viewed as an indicator of the industry’s degree of monopolization, and is widely applied in competition and anti-trust law.
15See Desmet et al. (2005, 2009), Bossert et al. (2006).
16Dominance is not always correlated with the relative size of the group. For example, Tutsis, who account for only 14% in Rwanda, represent a dominant minority group in the country, where almost everybody else is of Hutu ethnic origin. Laitin (2000) points to several cases of minority groups imposing their language on the majority, such as Spanish in South America, Amharic in Ethiopia, and Afrikaans in South Africa.
17Other OCC languages such as Arabic, Chinese, Hindi, Malay, Farsi, and Turkish have no significant effect on trade.
18In migrations between developing countries prevention against risks rather than income maximization seems to be a major factor of the migration decision. See Guilmoto and Sandron (2001).
19See Fujita and Weber (2010).
20See Ota (2008).
21See also Chiswick and Miller (2007) on this issue.
22In her acceptance speech of the Freedom Prize of the German Book Trade, Frankfurt, 2003.
23See Ganne and Minon (1992), Heilbron (1999), Heilbron and Sapiro (2002), Janssen (2009), Sapiro (2010), Melitz (2007).
24To illustrate this diversity, Ginsburgh et al. (2011) sampled some authors who were shortlisted by, or winners of, the Booker (now Man Booker) prize since its inception in 1969. Here is a list of such English-writing authors born elsewhere than in Great Britain, though some may have moved there, and whose native culture often impregnates their work and provides diversity: Chinua Achebe (Nigeria), Aravind Adiga (India), Margaret Atwood (Canada), André Brink (South Africa), John M. Coetzee (South Africa), Achmat Dangor (South Africa), Anita Desai (India), Kiran Desai (India), Amitav Ghosh (India), Nadine Gordimer (South Africa), Romesh Gunesekera (Sri Lanka), Abdulrazak Gurnah (Zanzibar), Mohsin Hamid (Pakistan), Thomas Keneally (Australia), Doris Lessing (Rhodesia), Yann Martel (Canada), Timothy Mo (Hong Kong), V. S. Naipaul (West Indies), Ben Okri (Nigeria), Michael Ondaatje (Sri Lanka), Arundhati Roy (India), Salman Rushdie (India), Indra Sinha (India), and Ahdaf Soueif (Egypt). This may also be the case for French, Spanish, and other important languages.
25See also Pym (1999).
26Both production in the source language and reception in the destination language are proxied by populations, since the number of titles published is not available for all the countries that they study.
27http://en.wikipedia.org/wiki/The_Da_Vinci_Code (accessed 12 June 2009).
30Such as the one discussed earlier on UN Resolution 242.
31In some cases, standardization emerges in a natural way, when states recognize an existing lingua franca. Laitin (2000) points out that such was the case with Swahili in Tanzania, Bahasa in Indonesia, and English in both the United States and England.
32See De Certeau et al. (1975).
33Even nowadays Ethnologue identifies seven languages in France, each having more than half a million speakers: Alsatian, Basque, Breton, Italian, Portuguese, Algerian Arabic, and Kabyle (Berber). This is without mentioning Corsican, Gascon, and Provençal, among others with hundreds of thousands of speakers.
35See Spolsky (2004, pp. 180–181).
36The CIA World Factbook (CIA, 2009) estimates that the Sinhalese majority and the Tamil minority constitute, respectively, some 74% and 18% of Sri Lanka’s population of about 21 million people.
37See also Fearon and Laitin (2003) for other situations.
38Since Hindi-speaking states required learning two languages only, Laitin (1989) labeled the formula ‘the 3 ± 1 arrangement’.
39India with over 1 billion inhabitants has ‘only’ 452 languages.
40See Ginsburgh and Weber (2005) and Ginsburgh et al. (2005).
41See Ginsburgh et al. (2005) who compute the optimal number as well as the languages that should be included in the set of official languages.
42In our definition of disenfranchisement, a citizen is considered disenfranchised in a language (i) if he or she does not speak it (i.e. if he or she does not cite it among the languages that he or she ‘knows’) or (ii) if, when asked how proficient he or she is in a language that he ‘knows’ he or she responds that his or her knowledge is only basic.
43According to EU rules, votes on linguistic matters have to be unanimous.
45For example, if m = 6, the number of arrangements of six languages among the 23 is equal to 18 × 19 × 20 × 21 × 22 × 23, which is of the order of 72.6 million.
46For further details on the calculation and additional results, see Fidrmuc et al. (2007).
47Note that there are instances where two languages result in approximately the same reduction in disenfranchisement at a particular step in the sequence. For example, the 10th language could be Czech or Greek.
49See Fidrmuc and Ginsburgh (2007), and Ginsburgh and Weber (2011, pp. 187–200) for further extensions.
50See Fernandez (2010) for an extensive review of the literature.