
National Culture as Value Orientations: Consequences of Value Differences and Cultural Distance
Shalom H. Schwartz, The Hebrew University of Jerusalem and the National Research University-Higher School of Economics, Moscow, Russia
Abstract
This chapter presents my theory of seven cultural value orientations and applies it to understanding relations of culture to significant societal phenomena. The first section explicates my conception of culture – a conception of the normative value system that underlies social practices and institutions. I then derive seven value orientations that are useful for describing and comparing societies. Next, the chapter discusses the conceptual underpinnings for measuring the cultural value orientations. It then presents the survey methods developed for this purpose, and the empirical validation of the content of the value orientations and of the structure of relations among them. This is based on analyses of data across 77 national groups in 75 countries. Brief comparisons of these value orientations with two other dimensional approaches to culture are followed by an analysis that justifies treating countries as cultural units. The middle section of the chapter uses the seven validated cultural orientations to generate a worldwide graphic mapping of national cultures. This map permits comparison of national cultures with one another on each orientation. It reveals eight distinct world cultural regions that reflect the influence of geographic proximity, history, language, and other factors. To illustrate the meaningfulness of the cultural map, I discuss the distinctive cultural profiles of each world cultural region. The final third of the chapter examines associations between culture, measured by the value orientations, and a variety of variables of economic significance: the socioeconomic level of countries, their level of corruption, the social net they provide to citizens, their level of democracy, and the competitiveness of their market systems. It discusses the reciprocal causal processes that may account for these associations. Finally, the chapter analyzes how distance between countries on cultural value orientations affects the flow of investment around the world. The current approach differs from well-known theories of cultural dimensions (e.g. Inglehart and Baker, 2000; Hofstede, 2001) in deriving the constructs to measure culture from a priori theorizing and then testing the fit of these constructs to empirical data. Moreover, whereas other approaches seek orthogonal dimensions, I assume that correlated dimensions capture culture better because they can express the interdependence of cultural elements. My theory of culture specifies a coherent, integrated system of relations among the seven cultural orientations. These orientations form three correlated bipolar dimensions. Empirical measures of the seven orientations support the coherence of culture by revealing that the cultural profiles of societies rarely exhibit incompatible value emphases.
Keywords
Cultural value orientations; Mapping 75 national cultures; Implications of national cultures for economics
JEL Classification Codes
Z00; Z10; Z13
20.1 Cultural Value Orientations to Characterize Societies
20.1.1 Cultural Orientations: Basic Assumptions
The prevailing value emphases in a society may be the most central feature of culture (Weber, 1958; Williams, 1968; Inglehart, 1997; Hofstede, 1980; Schwartz, 1999). These value emphases express conceptions of what is good and desirable – the cultural ideals. The rich complex of meanings, beliefs, practices, symbols, norms, and values prevalent among people in a society are manifestations of the underlying culture. I view culture as a latent, hypothetical variable that we can measure only through its manifestations. The underlying normative value emphases that are central to culture influence and give a degree of coherence to these manifestations. In this view, culture is outside the individual. It is not located in the minds and actions of individual people. Rather, it refers to the press to which individuals are exposed by virtue of living in particular social systems.1
The press of culture takes many forms. In psychological terms, the press refers to the primes that individuals encounter more or less frequently in their daily life (e.g. primes that may draw attention more to the individual or the group, to the material or the spiritual). The press also takes the form of language patterns (e.g. pronoun usage that may emphasize the centrality of self versus other; Kashima and Kashima, 1998). The cultural press may also be conceptualized as a set of environmental affordances (Norman, 1988) – the possibilities for action more or less available in a particular society (e.g. opportunities to express solidarity with or independence from others). In sociological terms, this press refers to the expectations and constraints encountered more or less frequently when enacting roles in societal institutions (e.g. in schools – encouragement of or constraints against questioning, in courts of law – expectations to win the case or to seek the truth). The frequencies of particular primes, expectations, constraints, affordances, and taken-for-granted practices in a society express the underlying normative value emphases that are the heart of the culture.
This view of culture contrasts with views of culture as a psychological variable. These views see culture as beliefs, values, behaviors, and/or styles of thinking that the individual members of a society or other cultural group share to a substantial degree. I view these as significant psychological consequences of culture. In order to study the impacts of culture on them, however, it is necessary to distinguish them from the culture itself – the normative value emphases in the society that affect them. These emphases shape the content and distribution of individual beliefs, actions, goals, and styles of thinking through the press and expectations to which people are exposed. A strong cultural value emphasis on preserving hierarchical relations and traditional in-group solidarity in Thailand (Schwartz, 2004), for example, induces widespread conformity and self-effacing behavior.
The ways the social institutions in a society are organized express the underlying cultural value emphases. For example, competitive economic systems, confrontational legal systems, and achievement-oriented child-rearing all express a cultural value emphasis on success, ambition, and self-assertion (e.g. in the United States). These social institutions continually expose the individuals living in the society to primes, affordances, and expectations consistent with the underlying cultural values. Most individuals develop, adopt, and/or internalize modes of thinking, behaviors, attitudes, and personal value priorities that enable them to function effectively and feel comfortable in the societal contexts to which they are exposed. In these ways, they absorb the impact of culture.
Prevailing cultural value orientations represent ideals. As such, they promote coherence among the various aspects of culture. Aspects of culture that are incompatible with them are likely to generate tension, and to elicit criticism and pressure to change. Cultures are not fully coherent, of course. Subgroups within societies espouse conflicting values. The dominant cultural orientations change in response to shifting power relations among these subgroups. However, change is slow (Hofstede, 2001; Schwartz et al., 2000). Elements of culture may even persist over hundreds of years (e.g. Kohn and Schooler, 1983; Putnam, 1993). Yet, cultural value orientations do change gradually. Societal adaptation to epidemics, technological advances, increasing wealth, contact with other cultures, wars, and other exogenous factors leads to changes in cultural value emphases.
In order to measure cultural orientations as latent variables, we could analyze the themes of the popular children’s stories in a society, its proverbs, movies, literature, socialization practices, legal systems, or the ways economic exchange is organized. Such manifestations each describe a narrow aspect of the culture. Moreover, many are the product of particular subgroups within society, aimed at particular audiences, or negotiated among elites. When researchers try to identify culture by studying these types of manifestations, what they seek, implicitly or explicitly, are underlying value emphases (Weber, 1958; Williams, 1968). Hence, studying value emphases directly is an especially efficient way to capture and characterize cultures.
20.1.2 Seven Cultural Value Orientations
All societies confront and must cope with basic problems in regulating human activity in order to survive (Parsons, 1951; Kluckhohn and Strodtbeck, 1961). These and other sources (Comte, 1896; Durkheim, 1897; Weber, 1922 [1978]) point to three societal problems as most critical: (i) defining the boundaries between the person and the group and the optimal relations between them; (ii) ensuring coordination among people to produce goods and services in ways that preserve the social fabric; (iii) regulating the utilization of human and natural resources. Cultural value emphases reflect and justify preferred societal responses to these problems. I derived a set of dimensions for comparing cultures by considering societal values that might underlie alternative societal responses to these problems (Schwartz, 1994, 1999, 2009b). These cultural value dimensions are based on a priori theorizing, unlike the Hofstede (1980) and Inglehart and Baker (2000) dimensions.
The cultural value orientations that form the poles of my conceptual dimensions are Weberian ideal-types. The cultures of actual societies are arrayed along the dimensions between the polar orientations. These orientations are normative responses; they prescribe how institutions should function and how people should behave in order best to deal with the key problems societies face. Cultural value emphases evolve and change over time as societies generate and modify their preferred responses.2
• Autonomy versus embeddedness. The problem of defining the optimal relations and boundaries between the person and the group translates into the question: ‘To what extent should people be treated as autonomous versus as embedded in their groups?’. ‘Autonomy’ cultures treat people as autonomous, bounded entities. They encourage people to cultivate and express their own preferences, feelings, ideas, and abilities, and to find meaning in their own uniqueness. There are two types of autonomy. Intellectual autonomy encourages individuals to pursue their own ideas and intellectual directions independently. Examples of important values in such cultures include broadmindedness, curiosity, and creativity. Affective autonomy encourages individuals to pursue arousing, affectively positive personal experience. Important values include pleasure, exciting life, and varied life. ‘Embeddedness’ cultures treat people as entities embedded in the collectivity. Meaning in life is expected to come largely through in-group social relationships, through identifying with the group, participating in its shared way of life, and striving toward its shared goals. Embedded cultures emphasize maintaining the status quo and restraining actions that might disrupt in-group solidarity or the traditional order. Important values in such cultures are social order, respect for tradition, security, obedience, and wisdom.3
• Egalitarianism versus hierarchy. The problem of ensuring coordination among people to produce goods and services in ways that preserve the social fabric translates into the question: ‘How can human interdependencies be managed in a way that elicits coordinated, productive activity rather than disruptive behavior or withholding of effort?’. ‘Egalitarian’ cultures urge people to recognize one another as moral equals who share basic interests as human beings. They socialize people to internalize a commitment to cooperate, to feel concern for the welfare of all, and to act voluntarily to benefit others. Important values in such cultures include equality, social justice, responsibility, help, and honesty. ‘Hierarchy’ cultures rely on hierarchical systems of ascribed roles to insure responsible, productive behavior. They define the unequal distribution of power, roles, and resources as legitimate and even desirable. People are socialized to take a hierarchical distribution of roles for granted, to comply with the obligations and rules attached to their roles, to show deference to superiors and expect deference from subordinates. Values of social power, authority, humility, and wealth are highly important in hierarchical cultures.
• Harmony versus mastery. The problem of regulating the utilization of human and natural resources translates into the question: ‘To what extent should individuals and groups control and change their social and natural environment versus leaving it undisturbed and unchanged?’. ‘Harmony’ cultures emphasize fitting into rather than exploiting the social and natural world, accepting, preserving, and appreciating the way things are rather than trying to change them. Harmony cultures discourage efforts to bring about change, and encourage maintaining smooth relations and avoiding conflict. Important values in harmony cultures include world at peace, unity with nature, protecting the environment, and accepting one’s portion. ‘Mastery’ cultures encourage active self-assertion by individuals or groups in order to master, direct, and change the natural and social environment, and thereby to attain group or personal goals. They emphasize the desirability of active, pragmatic problem solving that can produce ‘progress’. Values such as ambition, success, daring, self-sufficiency, and competence are especially important in mastery cultures.
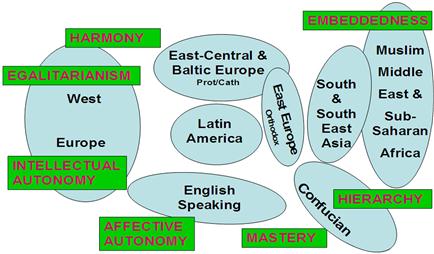
In sum, the theory specifies three bipolar dimensions of culture that represent alternative resolutions to each of three problems that confront all societies: autonomy versus embeddedness, egalitarianism versus hierarchy, and harmony versus mastery (Fig. 20.1). A societal emphasis on the cultural orientation at one pole of a dimension typically accompanies a de-emphasis on the polar type with which it tends to conflict. For example, Russian culture tends to emphasize hierarchy, but not the opposing orientation of egalitarianism. American and Israeli culture tend to emphasize mastery, and to give little emphasis to harmony. The cultures of Iran and China emphasize hierarchy and embeddedness, but not egalitarianism and intellectual autonomy.

The cultural value orientations are also interrelated based on compatibility among them. That is, because certain orientations share assumptions, they generate expectations that are similar. For example, embeddedness and hierarchy share the assumption that a person’s roles in and obligations to collectivities are more important than his or her unique ideas and aspirations: both are high in Nepal. Egalitarianism and intellectual autonomy share the assumption that people can and should take individual responsibility for their actions and make decisions based on their own understanding of situations: both are high in Scandinavia. Harmony and embeddedness share the assumption that avoiding dramatic change is desirable: both are high in Ethiopia. Mastery shares with hierarchy the assumption that inequality in the distribution of resources is legitimate and with affective autonomy the assumption that self-assertion should be encouraged. The combination of high mastery and hierarchy, as found in Confucian cultures, encourages group assertiveness. The combination of high mastery and affective autonomy, as found Anglo countries, encourages individual assertiveness.
The shared and opposing assumptions inherent in cultural values yield a coherent circular structure of relations among them. The structure reflects the cultural orientations that are compatible (adjacent in the circle) or incompatible (distant around the circle). It points to the cultural profiles on the seven value orientations that are likely to be found (relatively high emphases on adjacent values and low on opposing values) and the profiles that are unlikely to be found (relatively high emphases on opposing values). As noted, this view of cultural dimensions as forming an integrated, non-orthogonal system, distinguishes my approach from others. One could, of course, constrain orthogonal dimensions in factor analysis at the cultural level, as Hofstede (1980), House et al. (2004), and Inglehart and Baker (2000) do. However, that would hide the interdependence of cultural elements and obscure the pull toward coherence in culture portrayed in Fig. 20.1.
20.1.3 Measuring Cultural Value Orientations
Recall that cultural value orientations find expression in the norms, practices, and institutions of a society. The cultural value orientations help to shape the contingencies to which people must adapt in their daily lives. They help to determine the individual behaviors, attitudes, and value preferences that are likely to be viewed as more or less legitimate in common social contexts, to be encouraged or discouraged. Members of the dominant group in a society share many value-relevant experiences. They are socialized to take for granted the implicit values that find expression in the workings of societal institutions. Culture is an external press (set of primes and demands) to which each individual is exposed in a unique way, depending upon his or her location in society. This press affects the value priorities of each societal member. No individual experiences the full press of culture nor can anyone be fully aware of the latent culture of his society.
Of course, each individual has unique experiences and a unique genetic makeup and personality that give rise to individual differences in personal values within societies. Critically, however, these individual differences affect the variance in the importance that group members attribute to different values but not the average importance. The average reflects the impact of exposure to the same culture. Hence, individual responses, averaged across groups exposed to the same culture, can point to the latent cultural value orientations in a society (cf. Inglehart, 1997; Hofstede, 2001).4 These average societal values emerge out of ongoing negotiations among persons and institutions over desirable goals, negotiations that produce a cultural context of values embedded in societal institutions. Culture, in this sense, does not depend upon the degree of consensus regarding values among group members.
I operationalize the value priorities of individuals with the Schwartz Value Survey (SVS) that includes 56 or 57 value items (Schwartz, 1992; Schwartz and Boehnke, 2004). The SVS presents two lists of abstract value items (e.g. social justice, humility, creativity, social order, ambition). The first list contains 30 items that describe potentially desirable end-states in noun form; the second contains 26 or 27 items that describe potentially desirable ways of acting in adjective form.5 An explanatory phrase in parentheses following the item further specifies its meaning. For example: ‘EQUALITY (equal opportunity for all)’, ‘PLEASURE (gratification of desires)’.
Respondents rate the importance of each value item ‘as a guiding principle in MY life’ on a nine-point scale labeled 7 (of supreme importance), 6 (very important), 5, 4 (unlabeled), 3 (important), 2, 1 (unlabeled), 0 (not important), −1 (opposed to my values).6 People view most values as varying from mildly to very important. This non-symmetrical scale is stretched at the upper end and condensed at the bottom in order to map the way people think about values, as revealed in pre-tests. The scale also enables respondents to report opposition to values that they try to avoid expressing or promoting. This is especially necessary for cross-cultural studies because people in one culture or subculture may reject values from other cultures.
In order to use values in cross-cultural comparisons, their meanings must be reasonably similar across cultures. To assess which items have equivalent meanings across countries, separate multidimensional scaling analyses of the value items were run on data gathered between 1988 and 2002 in each of 233 samples from 68 countries located on every inhabited continent (total N = 67 145). The samples included highly diverse geographic, cultural, linguistic, religious, age, gender, and occupational groups. Samples included those that represented a nation or a region in it, school teachers in grades K–12 (i.e. primary and secondary education), undergraduate students from a variety of fields, adolescents, and adult convenience samples (listed in the Appendix). The analyses revealed that 47 items showed reasonably equivalent cross-national meanings (Schwartz, 2006a; cf. Fontaine et al., 2008).
These 47 items constituted the item pool for assessing the culture-level theory. They were selected because of their meaning equivalence across cultures, but with no connection to the theory of cultural orientations. In order to find a priori markers for each of the seven cultural value orientations, I sought items whose content expressed the emphasis of each orientation. I was able to find three to eight items to serve as markers of each orientation.
20.1.4 Empirical Evidence for Seven Cultural Value Orientations
The latest assessment of the validity of the seven cultural value orientations and the relations among them employs the data from the 233 groups mentioned above. For each sample, we computed the mean rating of each value item. This treats the sample as the unit of analysis. We then correlated item means across samples. The correlations reflect the way values co-vary at the sample (country) or culture level, not the individual level. They are statistically independent of the correlations across individuals within any sample. A confirmatory multidimensional scaling analysis (Guttman, 1968; Borg and Groenen, 2005) of the correlations between the sample means assessed whether the data support the seven cultural orientations and the relations among them.
The two-dimensional projection in Fig. 20.2 portrays the pattern of intercorrelations among the 47 values that had shown reasonably equivalent cross-national meanings. The analysis was based on the sample means. A point represents each value item such that the more positive the correlation between any pair of value items, the closer they are in the space; the less positive their correlation, the more distant. The theoretical model implies a circular, quasi-circumplex in which each orientation is close to (correlates positively with) those with which it is compatible and distant from (correlates negatively with) those with which it conflicts (as in Fig. 20.1). Confirming that the orientations are discriminated depends upon finding bounded regions of marker items in the spatial projection that reflect the content of each of orientation. Confirming that the orientations relate as theorized depends upon finding that the bounded regions of the orientations form an ordered circle that matches the theorized order.

Comparing Fig. 20.2 with Fig. 20.1 reveals that the observed content and structure of cultural value orientations fully support the theorized content and structure. This analysis clearly discriminates the seven orientations: the value items selected a priori to represent each value orientation are located within a unique wedge-shaped region of the space. Equally important, the regions representing each orientation form the integrated cultural system postulated by the theory: they emanate from the center of the circle, follow the expected order around the circle, and form the poles of the three broad cultural dimensions. Note, the three cultural dimensions are not factors. The dimensions are vectors in the space that connect the opposing orientations. The score for each cultural value orientation in a country is the mean importance rating of the value items that represent it, as shown by their locations in Fig. 20.2. To control for individual as well as group biases in use of the response scales, I centered each individual respondent’s ratings of the value items on his or her mean rating of all of the items prior to computing these scores.7
20.2 Mapping Cultural Differences Around the World
20.2.1 Countries as a Cultural Unit
Countries are rarely homogeneous societies with a unified culture. Inferences about national culture may depend on which subgroups are studied. The mapping of countries on the cultural orientations with the SVS used teacher and student samples rather than representative national samples. This makes it important to establish that scores derived from different types of samples order countries in the same way on the dimensions. I assessed consistency in the relative scores of countries on the seven cultural orientations by comparing three types of subgroups. (i) I compared younger and older respondents by splitting the teacher samples into those 37 years or younger and those older. The mean correlation between the national scores of these two subgroups was 0.91 (range 0.96–0.78). (ii) The mean correlation for male versus female students across 64 countries was 0.90 (range 0.96–0.82). (iii) The mean correlation for teachers versus students across 53 countries was 0.81 (range 0.90–0.57).
The correlations are weaker in the third comparison because the subgroups compared differed in both age and occupation. This suggests that closely matching the characteristics of the samples from each country is critical when comparing national cultural orientations. Inglehart (2001) reported similarly high correlations across countries for his two dimensions when comparing subgroups split by income and by rural/urban residence. Taken together, these findings support the view that countries are meaningful cultural units.
20.2.2 Cultural Distances Among Nations
No single occupational group represents a culture, but school teachers may have a number of advantages for characterizing national value priorities. As a group, they play an explicit role in value socialization, they are presumably key carriers of culture, and they probably reflect the mid-range of prevailing value priorities in most societies. By focusing on this single matched group, we obtain a relatively pure representation of national differences in value priorities, net of the influences of other national differences.
To test the robustness of conclusions from the teacher samples, parallel analyses were performed with data from samples of college students, from a wide variety of majors, in each of 40 nations. The mean value ratings observed for teacher and for student samples in each nation are almost certainly not the same as the ratings that would be obtained from other types of samples or from a representative sample. I assume, however, that the order of countries on the value means, using these matched samples, is reasonably similar to the order one would obtain using other types of matched samples to represent these nations.
In order to increase the reliability of country scores based on the SVS data, I averaged the means of the teacher and student samples in the 53 countries in which both types of samples were available. In 24 countries, only teacher or student data were available. For these countries, I estimated the missing sample means by regression. The Appendix lists the 77 national groups (country and within-country minority) mapped, the number of respondents in each group, and the types of samples on which the mapping was based.
I standardized each group’s scores on the seven cultural orientation scores around its own mean score for all seven orientations. This gave each group a cultural profile that reflects the relative importance of the seven value orientations. I then computed a matrix of cultural distances between all pairs of groups. The distance was the sum of the absolute differences between the pair of groups on each of the seven value orientations. For example, the respective scores for China and the United States were harmony 3.8/3.5, embeddedness 3.7/3.7, hierarchy 3.5/2.6, mastery 4.4/4.2, affective autonomy 3.3/3.9, intellectual autonomy 4.2/4.2, and egalitarianism 4.2/4.7. This yields a profile distance of 2.5.
Next, I used multidimensional scaling (MDS) to generate a two-dimensional spatial representation of the distances among all the groups (Fig. 20.3). Finally, I drew vectors (optimal regression lines) in the MDS space that indicate the direction of increasing scores for each of the seven orientations (‘COPLOT’ technique; Goldreich and Raveh, 1993). Figure 20.3 shows the full vector for embeddedness from lower left to upper right. Dropping a perpendicular line from the location of a cultural group to the embeddedness vector reveals that group’s embeddedness score relative to all other groups. Perpendicular lines on Fig. 20.3 indicate that Yemen is very high on embeddedness, Macedonia moderately high, and East Germany very low. For each of the other orientations, short arrows indicate the angles of their vectors. The extensions of these vectors go through the center of gravity of the figure, just above Romania.

The correlation between the actual scores of the cultural groups on an orientation and their locations along the vector that represents the orientation appears in parentheses next to the name of the orientation. The substantial magnitude of these correlations (range 0.75–0.98) indicates that the locations of most samples provide quite an accurate picture. This is because most countries exhibit a profile that reflects the coherence of the theoretical structure of cultural dimensions: cultural profiles high on one polar value orientation are typically low on the opposing polar orientation and show similar levels of relative importance for adjacent orientations. For example, Chinese culture, compared to all the others, is very high on both hierarchy and the adjacent mastery orientation, but very low on the opposing egalitarianism and adjacent harmony orientations.8
Consider two examples of how Fig. 20.3 represents the cultural profile of a country on all seven cultural orientations. Culture in Sweden (upper left) strongly emphasizes harmony, intellectual autonomy, and egalitarianism, and moderately emphasizes affective autonomy. The cultural emphasis on embeddedness is low, and it is very low for mastery and hierarchy. In contrast, in Zimbabwe (lower right), mastery, embeddedness, and hierarchy are highly emphasized, affective autonomy moderately emphasized, and egalitarianism, intellectual autonomy, and harmony receive little cultural emphasis.9
20.2.3 Eight Transnational Cultural Regions of the World
Close examination of Fig. 20.3 reveals that recognizable sets of cultural groups emerge together in regions of the space. By drawing boundary lines around these sets of groups on the spatial map one can discern transnational cultural regions. Figure 20.4 presents these boundary lines schematically and can be superimposed on Fig. 20.3 to identify eight cultural regions: West European, English-speaking, Latin American, East-Central and Baltic European, Orthodox East European, South Asia, Confucian influenced, and African and Middle Eastern. Only eight cultures are located outside their expected region. Three of these are from the culturally diverse Middle East (Turkey, Greek Cyprus, Israel Jews). The eight cultural regions overlap almost completely with the cultural regions Inglehart and Baker (2000) identified using their two dimensions. They also show striking parallels with the zones Huntington (1993) specified based on qualitative analysis.
Most regions reflect some geographical proximity. Hence, some of the cultural similarity within regions is doubtless due to diffusion of values, norms, practices, and institutions across national borders (Naroll, 1973). However, shared histories, language, religion, development, and other factors go beyond geography.10 Consider three examples of the sensitivity of cultural orientations to such factors. Turkey is higher on egalitarianism and autonomy, and lower on hierarchy and embeddedness, than its Middle Eastern Muslim neighbors are. This probably reflects its secular democracy, historical engagement with East Europe, and recent struggles to join the West. French Canada is closer to West Europe and particularly France than to English-speaking Canada, reflecting its historic and linguistic roots. East Germany is close to West Germany rather than part of the East European region, reflecting shared language, history, and traditions not obliterated by communist rule. Israeli Jews are between East Europe, West Europe, and the Muslim Middle East, and near the United States, reflecting its immigrant sources, and Israel’s political and economic ties to the Americas.
Next, we examine the cultural orientations that characterize each distinct cultural region. Table 20.1 provides mean scores on the seven orientations for each cultural region and indicates significant differences. Cultural distances between the regions on the orientations can be computed by taking the absolute difference between their mean scores on each orientation.11
Table 20.1
Mean scores on cultural value orientations for each of the world cultural regions.
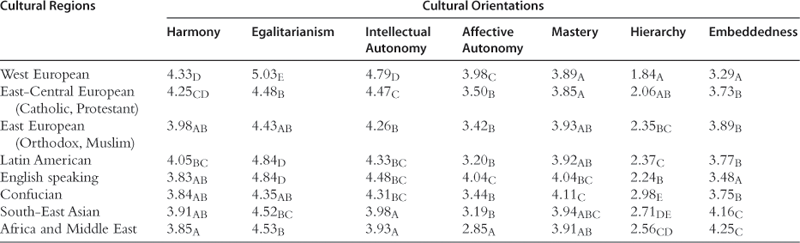
Regions with different subscripts in a column differ significantly from one another, p < 0.05, two-tailed.
West Europe: Austria, Belgium, Cyprus, Denmark, Finland, France, French Canada, East and West Germany, Greece, Italy, Netherlands, Norway, Portugal, Spain, Sweden, Switzerland.
East-Central Europe: Croatia, Czech Republic, Estonia, Latvia, Hungary, Poland, Romania, Slovenia, Slovakia.
East Europe: Bosnia-Herzegovina, Bulgaria, Georgia, Macedonia, Russia, Serbia, Ukraine.
Latin America: Argentina, Bolivia, Brazil, Chile, Costa Rica, Colombia, Mexico, Peru, Venezuela.
English speaking: Australia, Canada, Ireland, New Zealand, United Kingdom, United States.
Confucian: China, Hong Kong, Japan, South Korea, Taiwan, Thailand.
South-East Asia: Fiji, India, Indonesia, Malaysia, Nepal, Philippines, Singapore.
Africa and Middle East: Cameroon, Egypt, Ethiopia, Ghana, Iran, Israel Arab, Jordan, Namibia, Nigeria, Senegal, South Africa, Turkey, Uganda, Yemen, Zimbabwe.
Not included: Israel Jews.
20.2.3.1 West Europe
West European culture is the highest of all regions on egalitarianism, intellectual autonomy, and harmony, and the lowest on hierarchy and embeddedness. This profile holds even after controlling for national wealth. Thus, factors other than wealth and its correlates apparently influence the culture critically. This cultural profile is compatible with the presence in the region of democratic, welfare states with especially high concern for the environment (cf. Ester et al., 1994).
Although West European countries share a broad culture when compared with other world regions, there is substantial cultural variation within the region too. Greek culture is the least typical of West Europe – higher on mastery, and lower on intellectual autonomy and egalitarianism than the others are. French and Swiss French cultures display a relatively high hierarchy orientation for West Europe, together with the usual high affective and intellectual autonomy. They apparently retain a somewhat hierarchical orientation despite their emphasis on autonomy. Detailed analysis of such variations is beyond the scope of this chapter, but cultural differences within regions are meaningful.
20.2.3.2 English Speaking
The culture of this region is especially high in affective autonomy and mastery, and low in harmony and embeddedness compared with the rest of the world. American culture differs from that in other English-speaking countries by emphasizing mastery and hierarchy more and intellectual autonomy, harmony, and egalitarianism less. The American profile points to a culture that encourages an assertive, pragmatic, entrepreneurial, and even exploitative orientation to the social and natural environment.
20.2.3.3 Cultural Differences in the ‘West’
There is a widespread view of Western culture as individualist. However, the more complex conception of cultural orientations reveals striking differences within the West. Comparing 22 West European samples with six US samples, Schwartz and Ros (1995) found large and significant differences on six of the orientations. Egalitarianism, intellectual autonomy, and harmony were higher in West Europe; mastery, hierarchy, and embeddedness higher in the United States. Using the term ‘individualist’ to describe either of these cultures distorts the picture these analyses reveal.
Cultural orientations in West Europe are individualist in the sense that they emphasize intellectual and affective autonomy, and de-emphasize hierarchy and embeddedness. However, West European priorities contradict conventional views of individualism in emphasizing egalitarianism and harmony and de-emphasizing mastery. That is, this culture calls for selfless concern for the welfare of others, and fitting into the natural and social world rather than striving to change it through assertive action. This opposes the usual understanding of individualism.
Cultural emphases in the United States show a different but equally complex pattern: the individualistic aspect of American value orientations is the emphasis on affective autonomy and mastery at the expense of harmony. This may be the source of the stereotypical view of American culture as justifying and encouraging egotistic self-advancement. However, this is not prototypical individualism because intellectual autonomy is relatively unimportant. Moreover, both hierarchy and embeddedness, the orientations central to collectivism, are high compared with West Europe. This fits the emphasis on religion, conservative family values and punitiveness toward deviance in America noted by analysts of American culture (e.g. Bellah et al., 1986; Etzioni, 1993).
20.2.3.4 Confucian
This region also exhibits a pragmatic, entrepreneurial orientation. However, this orientation combines a heavy emphasis on hierarchy and mastery with a rejection of egalitarianism and harmony. It emphasizes embeddedness more than all the European and American cultures. This cultural profile is consonant with many analyses of Confucian culture (e.g. Bond, 1996).
20.2.3.5 Africa and the Middle East
The cultural groups from sub-Saharan and North Africa and the Muslim Middle East form a broad region that does not break down into clear subregions. These cultures emphasize finding meaning in life largely through social relationships and protecting group solidarity and the traditional order (high embeddedness) rather than cultivating individual uniqueness (low affective and intellectual autonomy). This fits well with the conclusions of studies of the Middle East (e.g. Lewis, 2003) and sub-Saharan Africa (e.g. Gyekye, 1997). There is a great deal of variation within the region, however, on all but embeddedness, egalitarianism, and intellectual autonomy.
20.2.3.6 South Asia
The culture of this region emphasizes fulfilling one’s obligations in a hierarchical system – obeying expectations from those in roles of greater status or authority and expecting humility and obedience from those in inferior roles (high hierarchy, low egalitarianism). As in Africa, here social relationships rather than autonomous pursuits are expected to give meaning to life (high embeddedness, low autonomy). With the exception of India’s high rating on mastery, all the groups are culturally quite homogenous. The variety of dominant religions (Hinduism, Roman Catholicism, Islam, Buddhism, Methodist Protestantism) does not produce cultural heterogeneity on the basic orientations.
20.2.3.7 East-Central and Baltic Europe versus East and Balkan Europe
Both these cultural regions are low on embeddedness and hierarchy compared with Africa and the Middle East and South-East Asia, but higher on these cultural orientations than West Europe. The East-Central European and Baltic culture is somewhat higher in harmony and intellectual autonomy, and lower in hierarchy than the Balkan and more Eastern culture.12 The Baltic and East-Central states have stronger historical and trade links to West Europe, were penetrated less by totalitarian communist rule, and threw it off earlier. Like West Europe, they are Roman Catholic or Protestant. These factors help to explain why their profile is closer to that of West Europe. In contrast, the countries in the East European and Balkan cultural region had weaker ties to the West, historical links to the Ottoman empire, were deeply penetrated by communism, and practice more conservative and in-group oriented Orthodox religions (Zemov, 1961, 1971). These factors help to explain their relatively low egalitarianism and intellectual autonomy and their higher hierarchy.
20.2.3.8 Latin America
Finally, the culture of the Latin American region is close to the worldwide average in all seven orientations. Moreover, excepting Bolivia and Peru, whose populations have been least exposed to European culture, this region is particularly homogeneous culturally. Some researchers describe Latin American culture as collectivist (e.g. Triandis, 1995; Hofstede, 2001). Compared with West Europe, this seems to be so. Latin America is higher in hierarchy and embeddedness, presumably the main components of collectivism, and lower in intellectual autonomy, presumably the main component of individualism. The opposite is the case, however, when we compare Latin American to African, Middle Eastern and South Asian cultures. This example highlights the importance of the frame of comparison. The culture of a group may look different when viewed in a worldwide perspective than when inferred from narrower comparisons.
20.3 Comparison with the Hofstede and Inglehart Dimensions
The cultural value orientations and dimensions presented above as well as the mapping of countries exhibit both similarities to and differences from the widely cited cultural dimensions of Hofstede (2001) and Inglehart (Inglehart and Baker, 2000). I therefore provide some comparisons. Here, I discuss only those dimensions that would seem to overlap conceptually to a considerable degree. For more detailed comparisons, see Schwartz (2004) on Hofstede and Schwartz (2007a) on Inglehart.
My autonomy/embeddedness and Hofstede’s individualism/collectivism both concern relations between the individual and the collective. However, autonomy/embeddedness contrasts openness to change with maintaining the status quo; individualism/collectivism does not. More important, theorists associate individualism with the self-interested pursuit of personal goals (e.g. Triandis, 1995; Kagitcibasi, 1997), although nothing in the Hofstede index measures selfishness. Cultural autonomy encourages uniqueness but not selfishness. In my view, culture could not encourage individual selfishness among group members who interact regularly. This would be detrimental to the smooth running of families and of most societal institutions. Rather, culture combats selfishness (cf. Campbell, 1975). Some orientations combat it more (e.g. egalitarianism) and others less (e.g. mastery).
Scores on individualism for 57 countries (from Hofstede, 2001, pp. 500–502) correlated 0.61 with an index of autonomy/embeddedness formed by subtracting the embeddedness score from the mean of the affective and intellectual autonomy scores. Although this suggests considerable empirical overlap between the two dimensions, they share only 37% of their cross-national variance. They order many countries quite differently. For example, the United States is first and Venezuela last among the 57 countries on individualism, but the United States is 30th on autonomy/embeddedness and Venezuela is 33rd. Individualism also correlated positively, though more weakly, with egalitarianism and harmony. This implies that individualism includes elements from egalitarianism and harmony, contrary to common interpretations of this dimension. Individualism/collectivism is apparently a catchall dimension. Using more refined dimensions makes it possible to identify important cultural differences missed with this broad dimension (e.g. see differences between the United States and West Europe below).
The hierarchy pole of the egalitarianism/hierarchy dimension and Hofstede’s power distance both concern legitimizing social inequality. Key elements of egalitarianism are absent from low power distance, however. These include the societal emphasis on viewing individuals as morally equal, and expecting them to internalize commitments to the welfare of others and to cooperate voluntarily with them. Power distance and egalitarianism/hierarchy share only 16% of their variance across 57 countries.
My mastery and Hofstede’s masculinity both emphasize assertiveness and ambition. Hofstede contrasts masculinity to femininity (tenderness, care, and concern for others), implying that masculinity neglects or rejects concern for others. I contrast mastery to harmony (being in tune with others and the environment). Mastery calls for an active, even disruptive stance, but it does not imply selfishness. Empirically, mastery and masculinity are independent (r = 0.15). Harmony and uncertainty avoidance both idealize a harmonious order. However, harmony stresses that people and nature should exist comfortably together without assertion of control. In contrast, uncertainty avoidance emphasizes controlling ambiguity and unpredictability. Their empirical correlation (r = 0.24) suggests little overlap.
In sum, the Hofstede dimensions show several conceptual similarities with my orientations. However, even the most closely related dimensions differ conceptually and empirically in significant ways. Next, consider the Inglehart dimensions.
Inglehart’s (e.g. Inglehart and Baker, 2000) secular-rational/tradition dimension centrally concerns orientations toward authority. Like autonomy/embeddedness, it concerns the degree to which individuals find meaning through their group ties and are submerged in all-encompassing structures of tight mutual obligations or are free to develop independence of thought and action. Although the two dimensions share considerable variance (36%) across 63 countries, they array nations somewhat differently. Religious tradition is central to scores on the Inglehart dimension, but has little weight in autonomy/embeddedness. This explains why former communist countries (e.g. Bulgaria, China, and Estonia) are high both on the secular-rational dimension and on embeddedness. Decades of communist rule reduced the importance of religion, but the culture in these countries still expects people to finding meaning through in-group ties. Thus, the two dimensions capture different aspects of the culture in these countries.
Inglehart’s self-expression/survival dimension contrasts societies in which people primarily focus on economic and physical security (survival) with societies in which security is high and quality-of-life issues are central (self-expression). Like autonomy/embeddedness, this dimension concerns the degree to which individuals should be encouraged to express their uniqueness and independence in thought, action, and feelings. The two dimensions share 41% of their variance and array nations quite similarly, with few major differences.
Like egalitarianism/hierarchy, self-expression/survival concerns equality among groups, tolerance, and trust. The two dimensions share 35% of their variance, but they rank many countries differently. Japan, for example, is very low on egalitarianism (versus hierarchy), but moderately high on self-expression (versus survival). High hierarchy captures the fact that Japanese culture organizes relations of interdependency in role-based hierarchical terms. High self-expression may reflect the consequences for culture of Japan’s wealth, high education, and advanced service economy. Thus, these two dimensions capture different, not necessarily contradictory, aspects of culture.
In sum, the two Inglehart dimensions show considerable overlap with two of my dimensions. This is striking, given large differences in the items and scales that measure them, and in the types of samples studied. It strongly supports the idea that these dimensions capture real, robust aspects of cultural difference. On the other hand, substantially divergent rankings of some countries on the overlapping dimensions make clear that each also captures unique aspects of culture. Moreover, my harmony/mastery dimension taps aspects of culture not measured by the Inglehart dimensions. As we will see, harmony/mastery is the only cultural dimension not strongly related to socioeconomic development.
In general, the cultural value orientations emphasize the normative aspect of culture more than the Hofstede and Inglehart dimensions do. The orientations specify the ways people are expected to think, feel, and act in order for society to function smoothly. Scores on the orientations reflect the value-based normative preferences that are implicit in the ways societal institutions are organized and that are used to justify social and organizational policies. This normative element is weaker or absent in most of the Hofstede and Inglehart dimensions.
20.4 Cultural Value Orientations and Economically Significant Variables
Of the hundreds of interesting antecedents, correlates, and consequences of national differences in the cultural value orientations, this chapter can touch only on a few. I discuss relations of culture to several variables of particular significance for economics.
20.4.1 Country Affluence
Economic development increases individual resources, reducing dependency on the extended family or group. This gives people opportunities and means to make choices enabling them to pursue autonomy and take personal responsibility. From a societal point of view, economic development makes it desirable to cultivate individual uniqueness and responsibility. Societies require diverse skills, knowledge, interests, and innovativeness to cope successfully with the various tasks, new challenges, and speed of change that accompany development. Hence, economic development fosters cultural autonomy and egalitarianism and curbs embeddedness and hierarchy. However, culture also influences development. Cultures that persist in emphasizing embeddedness and hierarchy stifle the individual initiative and creativity needed to develop economically. Numerous theorists explicate likely reciprocal relations between culture and development (e.g. Triandis, 1995; Inglehart, 1997; Hofstede, 2001; Welzel et al., 2003).
The first three rows of Table 20.2 present correlations of the cultural dimensions with indicators of socioeconomic level. In order to simplify the empirical presentations, I use the three polar value dimensions formed by the seven cultural orientations rather than the separate orientations. I computed the dimensions by subtracting the score for the second pole from the first (e.g. mean of affective and intellectual autonomy minus embeddedness). Cultural autonomy and egalitarianism correlate positively and strongly with average individual income 10 years earlier, contemporaneously, and nine years later. By implication, cultural embeddedness and hierarchy correlate strongly negatively with these indicators of wealth. Harmony/mastery has weak links to development. Many other indicators of development (e.g. education level, life expectancy, energy use, telephones, literacy) exhibit very similar associations with the cultural orientations.
Table 20.2
Correlations of cultural value dimensions with socioeconomic development, democratization, and household size, controlled for GDPpc 1985.

Notes: Correlations in parentheses are controlled for GDPpc 1985.
GDPpc = gross domestic product per capita, from the World Bank; GNIpc = gross national income per capita, from the World Bank.
Corruption level from Transparency International. Social net mid-1990s from Botero et al. (2004)
ACorrelation with intellectual autonomy minus embeddedness only. See text for explanation.
In order to examine the possible influence of cultural value orientations on change in socioeconomic development, I regressed 2004 country affluence on country resources in 1993 and on level of democracy in 1995, and then added the relevant cultural orientations to the regression. To measure country resources, I used the Vanhanen (1997) ‘index of power resources’ for 1993. This index includes measures of material and intellectual resources, and the complexity of the occupational system. This makes it better than a pure economic index for measuring the individual resources likely to affect later country affluence. To measure level of democracy, I used the Freedom House index of civil liberties and political rights for 1995.
The first model in the left panel of Table 20.3 indicates that gross national income (GNI) per capita in 2004 is substantially predicted by both the level of democracy and the country resources nine years earlier. The second model shows that the autonomy/embeddedness dimension of culture adds significantly to the regression. This suggests that this cultural value dimension explains some of the change in country affluence that occurred between 1995 and 2004. Despite the high correlation of the egalitarianism/hierarchy dimension with socioeconomic development, it did not contribute to explaining change in country affluence. This may reflect both its substantial association with autonomy/embeddedness (r = 0.51) and the influence on this dimension of earlier country wealth.

20.4.2 Quality of Governance
We next examine two aspects of societal governance that are of considerable economic significance: the level of corruption in a country and the social net provided to protect societal members. To gauge corruption, I used the Transparency International scores. Row 4 of Table 20.2 presents associations of cultural orientations with this index for 2006. Corruption is strongly and negatively related to socioeconomic development (−0.58) across the 75 countries in the analysis. I therefore show, in parentheses, the correlations of culture and corruption controlled for national wealth. The correlations reveal that high national levels of corruption among public officials go with cultural embeddedness and hierarchy. Corruption is lower in cultures that emphasize autonomy and egalitarianism. These associations are weakened if we control for national wealth, but they remain substantial.
The correlations indicate that the more a national culture emphasizes identifying with the in-group in which one is embedded and fulfilling one’s role obligations in a hierarchical social order, the more corruption in a country. Both embeddedness and hierarchy put allegiances to one’s family, in-group, or superiors ahead of rational, bureaucratic considerations. These allegiances justify violating the law for the benefit of one’s own gain and that of one’s family. In many of the most corrupt countries, external powers imposed national boundaries on diverse and conflicting ethnic groups (e.g. the French in Africa). In these countries, the need to preserve the in-group enhanced cultural embeddedness, and further weakened allegiance to the state and its legal system. These are probably the key paths through which these cultural orientations influence corruption.
Consider next national differences in laws regarding the social net that is intended to protect citizens. Prevailing cultural value emphases on autonomy, egalitarianism, and harmony are likely to promote and support laws that provide protection to workers against the vagaries of the labor market, and that cushion the devastating effects of lost income due to aging, disability, or death.
The autonomy orientation encourages individuals to develop their own interests and talents and to seek a personally appropriate niche in the world of work. Laws to counteract the effects of unemployment make this search more feasible. The contrasting embeddedness orientation looks more to the extended family to care for members who cannot support themselves. It therefore gives less incentive to enact generous unemployment benefits. An egalitarian cultural orientation also encourages laws to reduce the damage due to unemployment. It views people as voluntary actors who contract their labor and who, as morally equal individuals, deserve protection. A cultural emphasis on hierarchy, in contrast, views people more as cogs in the system whose moral worth depends on meeting their role obligations. Being unemployed is more a personal than a system concern. Finally, a mastery cultural orientation focuses on the outcomes and gains attained through striving rather than on the welfare of those who work. In contrast to a harmony orientation that would encourage laws to support labor peace, a mastery orientation may discourage unemployment benefit laws because they tax those who strive and succeed in order to protect those who do not.
Botero et al. (2004) provide an index that measures the benefits that constitute a social net by averaging what the laws specify as (i) old-age, disability, and death benefits, (ii) sickness and health benefits, and (iii) unemployment benefits. As hypothesized, higher autonomy versus embeddedness, egalitarianism versus hierarchy, and harmony versus mastery are associated with more generous social net laws in a country (Table 20.2, row 5). The observed correlations fully support these expectations. Not surprisingly, wealthier countries provide a stronger social net (r = 0.32), although this correlation is weaker than for two of the cultural dimensions. Controlling for country wealth, culture still relates significantly to the strength of the social net.
20.4.3 Level of Democracy
The political system is another aspect of the social structure that culture might influence reciprocally. Rows 6, 7, and 8 of Table 20.2 present associations of cultural orientations with earlier, contemporaneous, and later Freedom House13 indexes of level of democracy in 75 countries. The democracy index refers to both civil liberties and political rights. Democratization is heavily dependent on socioeconomic development (Welzel et al., 2003). I therefore show, in parentheses, the correlations of culture and democracy controlled for national wealth.
Autonomy and democracy go together, regardless of national wealth. By implication, embeddedness opposes democratization. The more the culture emphasizes that it is legitimate and desirable for individuals to pursue and express their own ideas and feelings, the higher the level of democracy in a country. The more the culture expects individuals to preserve and live according to group traditions, the lower the level of democracy. Egalitarianism also correlates positively (and hierarchy negatively) with democracy, regardless of national wealth. A culture that encourages people to treat others as moral equals and to contribute voluntarily to maintaining the social fabric is conducive to and supportive of a democratic political system. A culture that expects people to accept the role requirements of hierarchical structures unquestioningly opposes democratization. Harmony/mastery shows no clear association with democracy.
In order to examine the possible influence of cultural value orientations on change in the level of democracy in countries, I regressed the 2002 Freedom House index of democracy on the 1995 index and on country resources in 1993, and then added the relevant cultural orientations to the regression. The first model in the right panel of Table 20.3 indicates that the 2002 level of democracy is substantially predicted by the earlier level of democracy and does not depend on country resources nine years earlier. The second model shows that the egalitarianism/hierarchy dimension of culture adds significantly to the regression. This suggests that this cultural value dimension explains some of the change in the level of democracy that occurred between 1995 and 2002. Despite the substantial correlation of the autonomy/embeddedness dimension with socioeconomic development, it did not contribute to explaining change in level of democracy. This probably reflects its substantial association with egalitarianism/hierarchy.
20.4.4 Type of Capitalism14
According to varieties of capitalism theory, firms are the key actors in the economy. The central problem facing firms is coordination with other actors, with labor unions, other firms, sources of finance, of new technology, of educated workers, etc. One way firms can coordinate is through the free operation of the forces of market competition. Another is through planned interaction with other actors in which they pursue their goals strategically. The balance between these two types of coordination varies across political economies.
Varieties of capitalism theory array national political economies on a continuum from ‘liberal’ to ‘coordinated’ market economies (e.g. Hall and Soskice, 2001). Market competition is the primary source of coordination in more liberal economies. The premise underlying the economic system is that society achieves the highest quality and quantity of goods and services when all compete and pursue self-interests in a free market. In more coordinated economies, strategic interaction among firms is central. Optimal outcomes ensue when actors in the economy work collaboratively toward their goals. They thereby build mutual trust and commitment through information-sharing, deliberation, monitoring, and sanctioning.
Hall and Gingerich (2004) provide an index that locates 20 industrialized countries along this continuum.15 The countries, ordered from highest to lowest in the competitiveness of their economies, are: United States, United Kingdom, Canada, New Zealand, Ireland, Australia, Switzerland, Spain, Netherlands, France, Sweden, Denmark, Portugal, Finland, Belgium, Japan, Norway, Italy, Germany, and Austria. Of course, national characteristics other than type of economy influence values. Particularly important is national wealth (Inglehart and Welzel, 2005; Schwartz, 2006a). Across the 20 capitalist countries, scores on the competitiveness dimension are unrelated to gross domestic product per capita (r = 0.04). Hence, comparisons of culture and values across these countries are free of the potential influence of national differences in affluence.
To clarify the meaning of location along this dimension of capitalism, consider the two broad types of variables that compose the index. The first concerns corporate governance. Scores are higher where ordinary shareholders have greater power relative to managers or dominant shareholders, where the proportion of firms with a single controlling shareholder is smaller, and where the value of the equity market relative to the gross domestic product is larger. That is, dispersed power in large markets is conducive to coordination through the forces of market competition, whereas concentrated power in small markets facilitates successful strategic planning and collaborative coordination.
The second type of variable concerns labor relations. Scores are higher the less employees (unions) and management engage in strategic wage bargaining, when bargaining occurs at the national or intermediate levels rather than at the level of the firm, and when workers move frequently from one firm to another via competitive labor markets rather than remaining in the same firm. That is, concentration of wage bargaining at the national or intermediate levels and high labor turnover characterize capitalist economies high in competitiveness.
The pursuit of self-interest, maximizing profit, and economic growth are central to the ideology of competitive economies and to their everyday activities (Kasser et al., 2007). Exploitation of resources and people for the sake of progress and change takes precedence over preserving natural resources and protecting the immediate welfare of people whose interests conflict with one’s own. This competitive type of economy is congruent with a culture high in mastery and low in harmony. Row 9 of Table 20.2 presents correlations of cultural orientations with competitiveness in the economy across the 20 industrialized countries. The −0.79 correlation with the harmony/mastery cultural value dimension strongly supports expectations. Both a negative correlation with the harmony orientation (r = −0.83) and a positive correlation with the mastery orientation (r = 0.52) contribute to this association.
A competitive political economy is also congruent with a hierarchical versus egalitarian culture. Capitalists, laborers, and consumers, each starting with different levels of resources, seek to maximize their own outcomes in the competitive market even at the expense of others. The inevitable outcome is an unequal distribution of resources, legitimized by the competitive ethos. Market forces that privilege the strong rather than internalized values that promote collaboration with others govern most economic transactions. The –0.52 correlation with the egalitarianism/hierarchy cultural value dimension supports expectations, with the hierarchy orientation (r = 0.60) more critical than the egalitarianism orientation (r = −0.33).
Kasser et al. (2007) argue that, contrary to common assertions, competitive economic systems undermine rather than promote personal freedom. They glorify financial success, hold up models few can match, advertise products people must strive to obtain, and pressure people to work harder, longer, and with less choice than they desire. Such practices promote responsiveness to external expectations and deprive people of opportunities to cultivate their own interests. This conflicts with the intellectual (though not the affective) autonomy cultural orientation. Less clear is whether cultural embeddedness is congruent with a competitive economy. Pressures to conform and to meet external expectations fit such an orientation. My theory implies that cultures low in autonomy are high in embeddedness. The –0.55 correlation with this cultural dimension in Table 20.2 supports expectations. Both intellectual autonomy (r = –0.56) and embeddedness (r = 0.45) contributed to this correlation.
In summary, the type of political economy in industrialized countries – the extent to which their capitalist system is competitive versus collaborative – correlates strongly with the cultural orientations in these countries. The higher a capitalist country’s scores on the cultural mastery, hierarchy, and embeddedness orientations and the lower its scores on the harmony, intellectual autonomy, and egalitarianism orientations, the more competitive its economic system. Among the 20 wealthy capitalist economies, the American capitalist system ranks both as the most competitive and as the most culturally extreme on three of the six orientations, and as second most extreme on the other three. Although these analyses cannot assess causality, reciprocal influence between the cultural orientations and political economy is likely. It is certainly plausible that culture supports or constrains the ideology that underlies the economic system.
20.4.5 Cultural Distance and International Investment
What determines how much firms from one country invest in another country? Cultural distance between countries may deter investment because it increases transaction costs. Lacking information about distant cultures, managers will find it more difficult to make sense of the social environment. They may not recognize the prevailing beliefs and rules, may think they are inappropriate or unnecessary, and may not know how to work within them. Cultural distance hinders the flow of information about firm value, hiring, compensation, training, and other management practices. The uncertainty this breeds between managers from culturally distant countries is likely to discourage investing in one another’s firms.
Dozens of studies have examined how cultural distance affects where investment occurs, international diversification, and the performance of multinational firms. These studies used a composite index of distance based on the four Hofstede dimensions (Kogut and Singh, 1988). A meta-analysis found that this index predicted inconsistently (Tihanyi et al., 2005). A survey of the relevant literature urged researchers to avoid using composite indexes of cultural distance (Kirkman et al., 2006).
Heeding this warning, Siegel et al. (2013) computed separate indexes of cultural distance for each of the three Schwartz cultural dimensions. Country scores were based on the teachers’ data from 55 countries surveyed during the years 1988–2004. Rather than use three dimension scores, we represented cultural profiles by taking one orientation from each dimension (i.e. egalitarianism, harmony, and embeddedness). For every pair of countries we constructed a measure of sheer distance – the square of the difference between the countries’ scores on a cultural orientation.16 We wished to predict the flow of investment between countries. In order to assess whether the flow of investment is greater in one direction or the other, we also constructed a measure of signed distance. This was the algebraic difference between the score for the investing firm’s country of origin minus the score for the host country.
We studied the impact of each type of cultural distance on international flows of direct investment (FDI). FDI includes joint ventures, mergers and acquisitions, and setting up new firms from scratch. Data on FDI both into and out of 55 countries are available from the UN Centre on Transnational Corporations for the years 1970–2004, although the majority of observations take place after 1990. There were 37 614 potential transactions between each country-pair for these years. The distribution of investments was skewed and there were no investments between most pairs of countries for most years. To avoid biasing the econometric results, we followed standard methodological practice in economics and used the natural logarithm of the annual dollar flow of investment + 1 as our dependent variable.
Any factor that reduces the transaction costs of investment between countries might promote FDI. Thus, FDI might be greater between countries that: (i) are geographically closer, (ii) share a common language, (iii) share a common colonizer (e.g. British), (iv) have similar legal systems, (v) have similar levels of corporation taxation, (vi) have similar levels of law enforcement, (vii) have a bilateral tax treaty, (viii) have a bilateral investment treaty, and (ix) have similar levels of political stability. In addition, (x) wealthier countries are more likely to invest in each other because they have more resources to invest and an infrastructure to absorb investments. Siegel et al. (2013) detail the measurement of these variables. We ask: ‘Does cultural distance affect FDI even after taking all of these factors into account?’
To address this question, we regressed our FDI measure on the above variables. We also included cultural distance and signed cultural distance for the three cultural orientations. Columns 1 and 2 of Table 20.4 present the results of the ordinary least-squares (OLS) regression. Not surprisingly, the strongest predictors of FDI were country wealth and geographic closeness. Following them, however, were four of the indexes of cultural distance.
Table 20.4
OLS regression of the natural log of foreign direct investment flow + 1 on predictors (robust standard errors in parentheses).

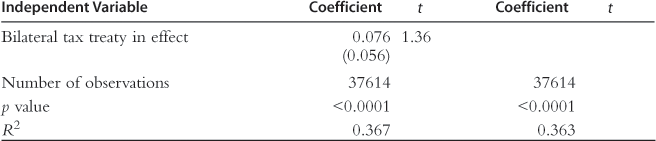
ACoefficient based on alternate analysis excluding bilateral tax treaty.
As expected, pairs of countries invested less in one another the greater the cultural distance on egalitarianism. A one standard deviation increase in egalitarianism distance brought a 16.5% decrease in mutual investment. The finding for signed embeddedness distance indicates that investment flowed more from countries low on cultural embeddedness to those high on this orientation. Rephrased in terms of the cultural dimension, investment flowed more from highly autonomous cultures to those high in embeddedness. Contrary to expectations for cultural distance, the greater the distance on cultural harmony, the greater the FDI. The significant finding for signed harmony distance indicates that investment flowed more from low to high harmony cultures. Rephrased in terms of the cultural dimension, the flow was greater from high mastery cultures to high harmony cultures. I return shortly to the interpretation of these findings.17
Sharing a similar legal system, a common colonizer, and a similar level of law enforcement also increased the flow of investment, but these effects were weaker than those of the cultural orientations. Moreover, having bilateral tax or investment treaties, a common language, similar corporate taxes, or similar political stability levels explained no significant additional variance in investment. Thus, cultural orientations had a substantial role in explaining FDI, one comparable to or greater than many economic and legal factors. Before interpreting the findings for culture, we address the issue of causality with regard to egalitarianism, the cultural orientation of central interest.
Might egalitarianism be an epiphenomenal reflection of contemporary social, economic, or political conditions rather than a causal variable? Egalitarianism, as we have seen, is associated with such conditions. However, by using exogenous – historical or ecological – variables as instruments for egalitarianism, we can capture the time-invariant element of this cultural orientation in the analyses. Siegel et al. (2011, 2013) demonstrated that more than 50% of the variance in national scores on egalitarianism can be explained by the combination of social fractionalization (ethnic or linguistic), dominant religion (Protestant and Catholic), nineteenth-century war experience, and previous communist rule. We therefore conducted an analysis that used these as instrumental variables for egalitarianism. We also controlled for home- and host-country fixed effects, thus allaying concerns about possible influence from unspecified stable factors. Columns 3 and 4 of Table 20.4 present the results of this analysis. They show that the egalitarianism results are highly robust to the use of instruments together with clustered standard errors and to the use of origin-country and host-country fixed effects.
We next interpret the findings for culture. What accounts for the effect of egalitarianism distance? Cultural egalitarianism relates to national policies that concern control of abuses of market and political power. It correlates positively with lower corruption, transparency in financial markets, labor protections for workers, and effective anti-monopoly regulation. It also correlates with greater redistribution of wealth to the weak, the unemployed, and the elderly. Egalitarianism further matters because it affects corporate culture and the everyday business conduct of managers. Managers from less egalitarian (hierarchical) societies tend to believe that status or power differences make it legitimate to apply different rules to different people (Brett, 2001). These correlates of cultural egalitarianism constitute critical contingencies for the effective functioning of firms. Firms adapt to the policies and practices associated with the level of egalitarianism in their own country. The different critical policies and practices in countries distant on egalitarianism likely deter investment by raising anticipated transaction costs.
As noted, investment flowed more from countries low on cultural embeddedness to those high on this orientation. Further analyses reveal that much of this effect is associated with differences in countries’ environmental regulation (Siegel et al., 2013). Cultural embeddedness is the orientation most closely and negatively associated with strictness of environmental regulation. In high embeddedness societies, groups focus more on their own outcomes and less on costs in the wider society or physical environment. Investment tends to flow from countries with strict environmental controls (low embeddedness) to those with lax environmental controls (high embeddedness). Multinational enterprises apparently seek ‘pollution havens’. Adding indexes of environmental regulation to the analyses reduces the effect of signed embeddedness on FDI by 69%. Even after controlling environmental regulation, however, signed embeddedness distance affects FDI, though more weakly. This influence must operate through mechanisms yet to be identified.
For harmony, surprisingly, cultural distance had a positive effect on FDI. The signed harmony effect indicates that the flow of investments was mainly from low harmony (i.e. high mastery) to high harmony countries. Why? High mastery cultures emphasize such entrepreneurial values as daring, success, and ambition. Firms in high mastery countries operate in a cultural atmosphere that encourages assertive action, risk taking, and growth. Firms in high harmony countries function in the opposite atmosphere. Firms in high mastery countries are more active in reaching out to new markets. In choosing where to expand, they find high harmony countries especially attractive. There, they can anticipate less competition for the resources they need and for the market niche they wish to fill.
This reasoning regarding the positive effect of harmony distance on FDI was assessed by adding three indexes of the distance between countries in entrepreneurial activity as controls. All three indexes showed that a societal proclivity towards entrepreneurship relates negatively to cultural harmony. One survey-based index was the difference between countries in the proportion of individuals in the population who report that they are owner-managers of new firms (between 4 and 41 months old) (Minniti et al., 2005). The other two indexes were the distance between countries in the skewness of firm age or of employment size (Alfaro and Charlton, 2006). These two indexes measure the relative difficulty of starting a business in a country, because higher skewness of firm age or employment size means that the country is relatively more dominated economically by older and/or larger firms.
Introduction of one or another of these controls into the regression reduced the size of the effect of signed harmony distance by between 40% and 60%. This supports the interpretation that firms in high mastery countries find high harmony countries especially attractive as targets for expansion where they can anticipate less competition. The fact that signed harmony distance remained significant after inclusion of these controls suggests, however, that other mechanisms through which harmony operates have yet to be found. Finally, although each of the indexes of entrepreneurial activity distance positively influenced FDI flows, their inclusion did not weaken the effect of egalitarianism distance.
In sum, this research on FDI makes a unique contribution to our understanding of international investment. It demonstrates that cultural distance can both deter (egalitarianism) and promote (harmony) investment, depending on the type of cultural value orientation in question. It also shows that differences between countries on particular cultural orientations promote flows of investment in one direction rather than another. With its complex set of cultural effects, this study illustrates especially clearly that cultural value orientations are properties of societies, not of individuals.
20.5 Conclusions
This chapter presented my theory of seven cultural value orientations that form three cultural value dimensions. The analyses demonstrate that all three cultural dimensions contribute uniquely to mapping national cultures and to explaining socially significant phenomena. The mapping of countries identifies cultural regions around the world that are similar to those identified in the Inglehart studies. This is striking, considering that the approaches differ in their basic cultural constructs, their methods of measurement, and the types of samples studied. When different subsamples (e.g. age or gender samples) are used to map countries, the order of countries on the cultural orientations or dimensions is very similar. This supports the idea that countries are meaningful cultural units. Nonetheless, it is important to investigate other cultural units, such as ethnic groups, in future research.
Given the relations of my cultural dimensions to the Hofstede and Inglehart dimensions, it is reasonable to ask whether it matters which set of dimensions we use. I repeated the analyses reported here using the four Hofstede and two Inglehart dimensions. For six of the nine variables listed in Table 20.2, one of my dimensions had the strongest associations. For two indexes of socioeconomic development (1995 and 2004) and for 1985 democracy, the Inglehart self-expression/survival dimension correlated more strongly. Only my dimensions predicted change in level of democracy and they predicted change in socioeconomic level substantially more strongly than either the Inglehart or the Hofstede dimensions. As noted, cultural distance on the Hofstede dimensions did not affect FDI. I did not test effects on FDI of distance on the Inglehart dimensions. Overall, for the variables studied here, my dimensions appear to be more fruitful.
This chapter also examined relations of my cultural value orientations to a number of country characteristics of significant economic importance. The orientations related predictably to national differences in levels of corruption and in the strength of the social net they provide, and to the competitiveness of capitalism in 20 industrialized capitalist countries. These associations held even when the countries’ levels of socioeconomic development were controlled. The cultural value orientations also relate systematically and in theoretically meaningful ways to many other societal characteristics (e.g. ethnic heterogeneity, family size, women’s equality), and to the attitudes and opinions of populations (e.g. selfishness, competition, traditional morality) (Schwartz, 2004, 2006b, 2007a).
The research reported here is based on indexes of the cultural orientations derived from the SVS. Indexes of these same orientations can now be derived from the Portrait Values Questionnaire (PVQ) that uses a very different method to measure values (Schwartz, 2005, 2006a). The culture scores used here were based on samples of schoolteachers and students. For 30 countries that have participated in the European Social Survey (ESS), it is now possible to compute scores for cultural orientations based on representative national samples. The ESS uses a short form of the PVQ that yields usable scores, although most have relatively low reliabilities. The ESS data permit examination of the relations of national culture to an enormously rich and diverse set of individual and nation level variables. These are public domain data that can be downloaded at http://ess.nsd.uib.no.
Here, I discussed cultural value orientations only as dependent or independent variables. However, culture is also a moderator of the relations among other variables. For instance, the effect of gender on the importance people attribute to their personal values depends on the prevailing cultural orientations in a society. In countries high on cultural autonomy, men attribute substantially more importance to power values than women do, for example. This sex difference is much smaller in countries high on cultural embeddedness (Schwartz and Rubel-Lifschitz, 2009). Cultural value orientations are likely to moderate many other relationships (e.g. effects of social norms or pressures on behavior). Studies of cultural orientations as moderators offer much promise for understanding cross-cultural differences in the relations between individual difference variables.
The cultural value orientations presented here provide one handle for conceptualizing and operationalizing a key element of culture. These orientations characterize cultures, not individuals. Country scores are not located in the mind of any individual, nor do differences between any pair of individuals capture cultural distances between societies. These orientations underlie, justify, and give coherence to the ways that societal systems function. They are external to individuals, expressed in the distribution of primes and expectations that members of a cultural group encounter. Thus, this conception of culture differs from views of culture as a psychological variable.
Cultures are never fully integrated and coherent. Different institutions within societies give more emphasis to orientations compatible with their functions (e.g. hierarchy in armies, embeddedness in religions, intellectual autonomy in universities). Ethnic, occupational, religious, and other subgroups within societies may experience different cultural pressures and develop different value preferences. These differences induce social tension, conflict, and change. One-time, static measures of the overall culture of a country are therefore somewhat problematic. Nonetheless, the findings reported here demonstrate that the cultural value profiles of dominant cultural groups can characterize societies in a fruitful manner. They also enable us to uncover dynamic, causal relations between culture and important societal phenomena.
Acknowledgments
Preparation of this chapter was supported by the Higher School of Economics (HSE) Basic Research Program (International Laboratory of Socio-Cultural Research).
Appendix
Countries and samples used in assessing the meaning equivalence of value items across countries and in mapping the culture of world nations are listed in Table 20.A1.
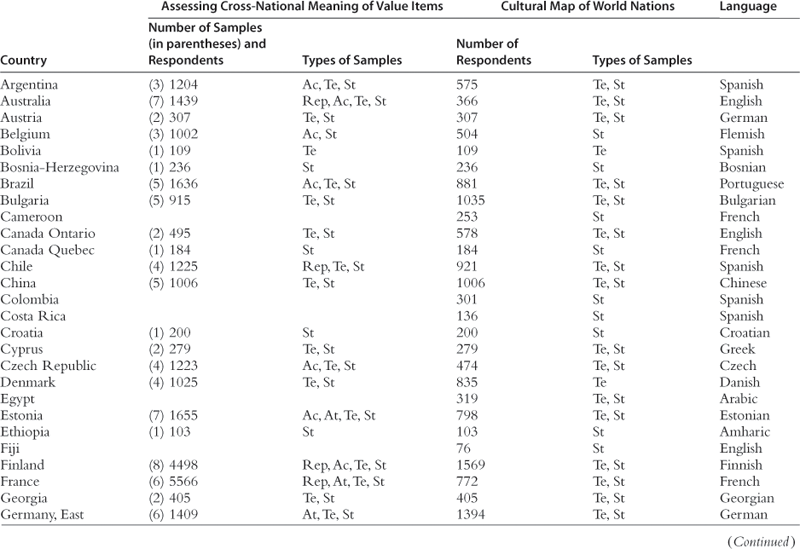
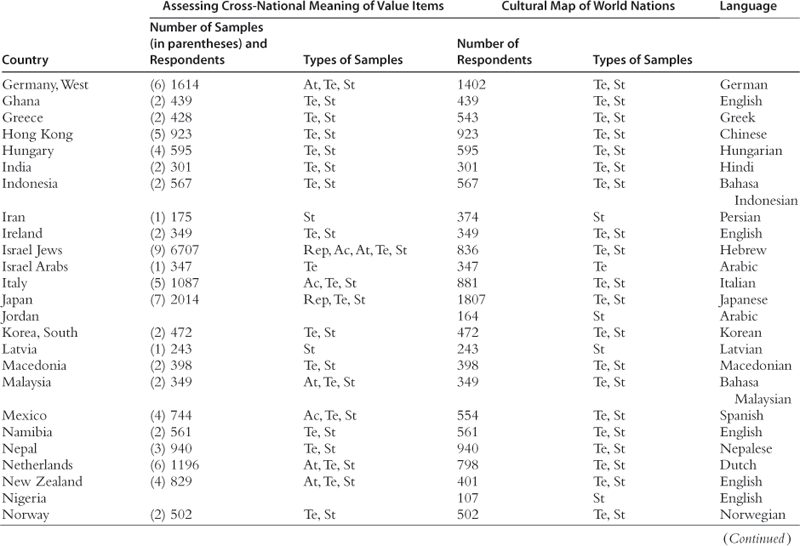

References
1. Alfaro, L., Charlton, A., 2006. International financial integration and entrepreneurship. Working Paper. Harvard Business School, Cambridge, MA.
2. Bellah RN, Madsen R, Sullivan WM, Swidler A, Tipton SM. Habits of the Heart: Individualism and Commitment in American Life. New York: Harper & Row; 1986.
3. Benedict R. The Chrysanthemum and the Sword: Patterns of Japanese Culture. Boston, MA: Houghton Mifflin; 1946.
4. Berry, H., Guillén, M.F., Zhou, N., 2008. A new approach to cross-national distance. Working Paper. Wharton School, Philadelphia, PA.
5. Bond MH. Chinese values. In: Bond MH, ed. Handbook of Chinese Psychology. Hong Kong: Oxford University Press; 1996;208–226.
6. Borg I, Groenen PJF. Modern Multidimensional Scaling: Theory and Applications. second ed. New York: Springer; 2005.
7. Botero J, Djankov S, La Porta R, Lopez-de-Silanes F. The regulation of labor. Quarterly Journal of Economics. 2004;119:1339–1382.
8. Brett JM. Negotiating Globally: How to Negotiate Deals, Resolve Disputes, and Make Decisions Across Cultural Boundaries. San Francisco, CA: Jossey-Bass; 2001.
9. Campbell DT. On the conflicts between biological and social evolution and between psychology and moral tradition. American Psychologist. 1975;30:1103–1126.
10. Comte A. The Positive Philosophy (H Martineau, Trans.). London: Bell; 1896; (Originally published 1830–1842).
11. Diamond J. Guns, Germs and Steel: The Fate of Human Societies. New York: Norton; 1997.
12. Durkheim E. Suicide: A Study in Sociology (J.A Spaulding, C Simpson, Trans.). London: Routledge and Kegan Paul; 1897; (Originally published 1952. Le Suicide. Paris).
13. Ester P, Halman L, Seuren B. Environmental concern and offering willingness in Europe and North America. In: Ester P, Halman L, de Moor R, eds. The Individualizing Society: Value Change in Europe and North America. Tilburg: Tilburg University Press; 1994;163–181.
14. Etzioni A. The Spirit of Community: The Reinvention of American Society. New York: Simon & Schuster; 1993.
15. Fischer R. Congruence and functions of personal and cultural values: do my values reflect my culture’s values? Personality and Social Psychology Bulletin. 2006;32:1419–1431.
16. Fontaine JRJ, Poortinga YH, Delbeke L, Schwartz SH. Structural equivalence of the values domain across cultures: separating sampling fluctuations from meaningful variation. Journal of Cross-Cultural Psychology. 2008;39:345–365.
17. Goldreich Y, Raveh A. COPLOT display technique as an aid to climatic classification. Geographical Analysis. 1993;25:337–353.
18. Guttman L. A general nonmetric technique for finding the smallest coordinate space for a configuration of points. Psychometrica. 1968;33:469–506.
19. Gyekye K. Tradition and Modernity: Philosophical Reflections on the African Experience. New York: Oxford University Press; 1997.
20. Hall, P.A., Gingerich, D.W., 2004. Varieties of capitalism and institutional complementarities in the macroeconomy: an empirical analysis. MPIfG Discussion Paper 04/5. Max Planck Institute for the Study of Societies: Cologne, Germany.
21. Hall PA, Soskice D, eds. Varieties of Capitalism: The Institutional Foundations of Comparative Advantage. Oxford: Oxford University Press; 2001.
22. Hofstede G. Culture’s Consequences: International Differences in Work-related Values. Beverly Hills, CA: Sage; 1980.
23. Hofstede G. Culture’s Consequences: Comparing Values, Behaviors, Institutions, and Organizations Across Nations. second ed. Beverly Hills, CA: Sage; 2001.
24. House RJ, Hanges PJ, Javidan M, Dorfman PW, Gupta V. Culture, Leadership, and Organizations: The Globe Study of 62 Societies. Thousand Oaks, CA: Sage; 2004.
25. Huntington SP. The clash of civilizations. Foreign Affairs. 1993;72:22–49.
26. Inglehart R. Modernization and Postmodernization: Cultural, Economic and Political Change in 43 Societies. Princeton, NJ: Princeton University Press; 1997.
27. Inglehart, R., 2001. Presented at the International Conference on Comparing Cultures, April, 2001. Tilburg University, The Netherlands.
28. Inglehart R, Baker WE. Modernization, cultural change, and the persistence of traditional values. American Sociological Review. 2000;65:19–51.
29. Inglehart R, Welzel C. Modernization, Cultural Change, and Democracy: The Human Development Sequence. New York: Cambridge University Press; 2005.
30. Kagitcibasi, C., 1997. Individualism and collectivism. In: Berry, J.W., Segall, M.H., Kagitcibasi, C. (Eds.), Handbook of Cross-Cultural Psychology, Vol. 3, 2nd ed. Allyn & Bacon, Boston, pp. 1–50.
31. Kashima ES, Kashima Y. Culture and language: the case of cultural dimensions and personal pronoun use. Journal of Cross-Cultural Psychology. 1998;29:461–486.
32. Kasser T, Cohn S, Kanner AD, Ryan RM. Some costs of American corporate capitalism: a psychological exploration of value and goal conflicts. Psychological Inquiry. 2007;18:1–22.
33. Kirkman BL, Lowe KB, Gibson CB. A quarter century of culture’s consequences: a review of empirical research incorporating Hofstede’s cultural value framework. Journal of International Business Studies. 2006;37:285–320.
34. Kluckhohn F, Strodtbeck F. Variations in Value Orientations. Evanston, IL: Row Peterson; 1961.
35. Kogut B, Singh H. The effect of national culture on the choice of entry mode. Journal of International Business Studies. 1988;19:411–432.
36. Kohn ML, Schooler C. Work and Personality. Norwood, NJ: Ablex; 1983.
37. Lewis B. What Went Wrong: The Clash Between Islam and Modernity in the Middle East. New York: Harper Collins; 2003.
38. Matsumoto DR. The New Japan: Debunking Seven Cultural Stereotypes. Boston, MA: Intercultural Press; 2002.
39. Minniti M, Bygrave WD, Autio E. Global Entrepreneurship Monitor: 2005 Executive Report. Babson Park, MA: Babson College; 2005.
40. Naroll R. Main Currents in Cultural Anthropology. Englewood Cliffs, NJ: Prentice-Hall; 1973.
41. Norman DA. The Design of Everyday Things. New York: Doubleday; 1988; <http://www.interaction-design.org/references/authors/donald_a_norman.htm>, <http://www.interaction-design.org/references/publishers/doubleday.html>.
42. Parsons T. The Social System. New York: The Free Press; 1951.
43. Putnam RD. Making Democracy Work: Civic Traditions in Modern Italy. Princeton, NJ: Princeton University Press; 1993.
44. Rokeach M. The Nature of Human Values. New York: Free Press; 1973.
45. Schwartz SH. Universals in the content and structure of values: theory and empirical tests in 20 countries. Advances in Experimental Social Psychology. 1992;25:1–65.
46. Schwartz SH. Beyond individualism/collectivism: new cultural dimensions of values. In: Kim U, Triandis HC, Kagitcibasi C, Choi S-C, Yoon G, eds. Individualism and Collectivism: Theory, Method, and Applications. Thousand Oaks, CA: Sage; 1994;85–119.
47. Schwartz SH. Cultural value differences: some implications for work. Applied Psychology: An International Review. 1999;48:23–47.
48. Schwartz SH. Mapping and interpreting cultural differences around the world. In: Vinken H, Soeters J, Ester P, eds. Comparing Cultures, Dimensions of Culture in a Comparative Perspective. Leiden: Brill; 2004;43–73.
49. Schwartz SH. Robustness and fruitfulness of a theory of universals in individual human values. In: Tamayo A, Porto JB, eds. Valores e Comportamento nas Organizações. Petrópolis, Brazil: Vozes; 2005;56–95.
50. Schwartz SH. Les valeurs de base de la personne: Théorie, mesures et applications. Revue Française de Sociologie. 2006a;42:249–288.
51. Schwartz SH. Value orientations: measurement, antecedents and consequences across nations. In: Jowell R, Roberts C, Fitzgerald R, Eva G, eds. Measuring Attitudes Cross-Nationally: Lessons From the European Social Survey. London: Sage; 2006b;169–220.
52. Schwartz SH. A theory of cultural value orientations: explication and applications. In: Esmer Y, Pettersson T, eds. Measuring and Mapping Cultures: 25 Years of Comparative Value Surveys. Leiden: Brill; 2007a;33–78.
53. Schwartz SH. Cultural and individual value correlates of capitalism: a comparative analysis. Psychological Inquiry. 2007b;18:52–57.
54. Schwartz SH. Culture matters: National value cultures, sources and consequences. In: Chiu C-Y, Hong YY, Shavitt S, Wyer Jr RS, eds. Understanding Culture: Theory, Research and Application. New York: Psychology Press; 2009a;127–150.
55. Schwartz SH. Causes of culture: National differences in cultural embeddedness. In: Gari A, Mylonas K, eds. Quod Erat Demonstrandum: From Herodotus’ Ethnographic Journeys to Cross-Cultural Research. Athens: Pedio Books Publishing; 2009b;1–11.
56. Schwartz SH, Boehnke K. Evaluating the structure of human values with confirmatory factor analysis. Journal of Research in Personality. 2004;38:230–255.
57. Schwartz SH, Ros M. Values in the West: a theoretical and empirical challenge to the Individualism-Collectivism cultural dimension. World Psychology. 1995;1:99–122.
58. Schwartz SH, Rubel-Lifschitz T. Cross-national variation in the size of sex differences in values: effects of gender equality. Journal of Personality and Social Psychology. 2009;97:171–185.
59. Schwartz SH, Bardi A, Bianchi G. Value adaptation to the imposition and collapse of Communist regimes in Eastern Europe. In: Renshon SA, Duckitt J, eds. Political Psychology: Cultural and Cross Cultural Perspectives. London: Macmillan; 2000;217–237.
60. Siegel JI, Licht AN, Schwartz SH. Egalitarianism and international investment. Journal of Financial Economics. 2007b;102:621–642.
61. Siegel JI, Licht AN, Schwartz SH. Egalitarianism, cultural distance, and FDI: a new approach. Organization Science. 2007a;24:174–1194. doi 10.1287/orsc.1120.0776.
62. Tihanyi L, Griffith DA, Russell CJ. ‘The effect of cultural distance on entry mode choice, international diversification, and MNE performance: a meta-analysis’. Journal of International Business Studies. 2005;36:270–283.
63. Triandis H. Individualism and Collectivism. Boulder, CO: Westview; 1995.
64. Vanhanen T. Prospects of Democracy. London: Routledge; 1997.
65. Weber Max. Economy and Society: An Outline of Interpretive Sociology. Berkley, CA: University of California Press; 1922 [1978];.
66. Weber M. The Protestant Ethic and the Spirit of Capitalism. New York: Scribners; 1958.
67. Welzel C, Inglehart R, Klingemann H-D. The theory of human development: a cross-cultural analysis. European Journal of Political Research. 2003;62:341–379.
68. Williams Jr RM. Values. In: New York: Macmillan; 1968;283–287. Sills E, ed. International Encyclopedia of the Social Sciences. vol. 16.
69. Zemov N. Eastern Christendom. London: Weidenfeld & Nicholson; 1961.
70. Zemov N. Christianity: The Eastern schism and the Eastern Orthodox church. In: Zaehner RC, ed. The Concise Encyclopedia of Living Faiths. London: Hutchinson; 1971;77–93.
1The term ‘cultural value’ in this chapter refers to values in the plural that are prevalent among people in society, in contrast to individual perceptions of the cultural value of artistic or cultural phenomena as discussed in Chapters 4, 5, and 7 in this volume.
2There is little research on why particular societies generate particular preferences. History, ecology, technology, and various chance factors undoubtedly play a role (see, e.g. Schwartz and Ros, 1995; Diamond, 1997; Schwartz, in press). Below, I present a few specific explanations when discussing the culture profiles of countries that diverge from their neighbors and when analyzing reciprocal influences of culture and social structure on one another.
3This dimension shares some elements with the individualism/collectivism construct. I contrast them below.
4Asking individuals how important they think different values are in their society and averaging these ratings would yield a measure of perceived culture. Perceived culture is interesting in itself and has its own correlates (Fischer, 2006). As culture is latent, however, individuals may be poor informants about their culture.
5This followed Rokeach’s (1973) idea that ends values and means values function differently. My research suggests that this distinction has no substantive importance (Schwartz, 1992). One item in the 56-item SVS (1988) was dropped and two others added in the revised 57-item version (1994).
6Schwartz (1994) explains the rationale for preferring rating of value-importance to ranking.
7Schwartz (1992, 2004, 2006a) further explains how to perform the scale use correction and why it is necessary.
8Japan presents a striking exception. Seven samples from around Japan reveal an unusual combination of cultural elements. The culture strongly emphasizes hierarchy and harmony, but not embeddedness, which is adjacent to them, and it strongly emphasizes intellectual autonomy, but not the adjacent egalitarianism. Thus, the location of Japan on the map is necessarily misleading. This unusual combination would not surprise many scholars of Japanese culture (e.g. Benedict, 1946; Matsumoto, 2002). It points to a culture in tension and transition.
9Those who wish to examine relations of the cultural value orientations of national groups to other variables or to compute cultural distances between pairs of national groups on the cultural orientations can obtain scores for each group by writing to the author at [email protected].
10Schwartz (2009a,b) and Siegel et al. (2011) discuss historical sources of national difference on the embeddedness and egalitarianism dimensions.
11Updated scores for the seven cultural value orientations for each cultural group are available from the author.
12Georgia and Bosnia-Herzegovina are exceptions that require further study.
13Freedom in the World; http://www.freedomhouse.org.
14See Schwartz (2007b) for a more detailed discussion.
15For convenience, I reverse their index so that high scores indicate greater competitiveness.
16The 55 country scores for egalitarianism, harmony, and embeddedness used to compute the distances are available in appendix A of Siegel et al. (2013).
17The results are robust to inclusion of the Project Globe (House et al., 2004) and Hofstede (1980) dimensions and of various other variables. Distance on the Hofstede dimensions explains no significant variance in FDI nor does distance on a more recent measure of power distance derived from the World Values Survey by Berry et al. (2008).