
Cultural Diversity, Conflict, and Economic Development
Jose G. Montalvoa and Marta Reynal-Querolb, aUniversitat Pompeu Fabra, Barcelona GSE and ICREA Academia, bUniversitat Pompeu Fabra, Barcelona GSE and ICREA
Abstract
Are cultural differences good or bad for economic development? Can cultural differences generate conflicts and, therefore, retard economic development? Or can cultural diversity spur creativity and improve economic welfare? These are the type of questions that this chapter addresses. There are many channels through which a diverse society may affect the economic and social outcomes of countries, cities, or villages. The debate usually concentrates on empirical results based on the use of general indices that try to summarize many phenomena at the same time. The use of these indices brings also more debate into the topic, since the construction of indices always implies an hypothesis of how we believe the distribution of culturally diverse groups affects the outcome. To understand why ethnic diversity affects conflict and economic development, we first need to understand which indices best capture the channels through which cultural diversity affects economic outcomes. The chapter also reviews evidence on the effect of specific cultural arrangements on the economic development of regions and countries.
Keywords
Polarization; Fractionalization; Conflict
JEL Classification Codes
D74; O12; O44; Z13
18.1 Introduction
In this chapter we review the literature that discusses the influence of cultural differences on economic development and conflicts. We define culture as a set of shared values and beliefs that social groups hold and transmit across generations. Social groups are defined usually by geographic or ethnic boundaries, where ethnicity includes differences in race, religion, or language. For the sake of brevity, we refer to these different social groups that define a culture as ethnic groups. There are basically two ways of studying the effect of culture on economic development. Some research has concentrated on different cultural traditions, and their effects on expectations, preferences, and decisions that generate economic consequences. The object under study is a particular social group or the comparison of the influence of particular cultural traits across several social groups. This is the perspective taken, for instance, by Guiso et al. (2006), Fernández (2008), or Tabellini (2010). Here, the analysis deals with the economic effect of the cultural traits of homogeneous groups or the average cultural traits of potentially heterogeneous groups. A second approach considers a particular society and the economic effect of the interaction of the different ethnic groups that belong to that society. In this case, the relationship between the different groups may lead to conflict because of their cultural differences. Obviously, it is also interesting to analyze how culture influences the economic and institutional arrangements of such economic transactions, the organization of trade, the structure of land ownership, fertility, or birth control, but these issues are beyond the objectives of this chapter. The economic literature has often proxied cultural differences by ethnic differences. Although we are aware that these cannot always capture all cultural differences, we concentrate on studies based on this concept.
The literature has identified several channels through which ethnic diversity may affect economic outcomes. Alesina and La Ferrara (2005) describe three such channels. The first one captures the idea that ethnic differences enter into individual preferences. This means that individuals could probably attribute some positive utility to the well-being of the members of their own group. The second channel assumes that ethnic diversity can affect economic outcomes by influencing the strategies of individuals: individuals may prefer to make transactions with members of their own group, especially if there are market imperfections. This is based on the idea that trust is higher among members of the same ethnic group than across members of different groups. Finally, the third channel argues that ethnic diversity may also enter into the production function: people differ in their productive skills and on how they interpret problems, which may have positive effects on productivity. Ethnic diversity may thus generate costs and benefits.
Alesina and La Ferrara (2005) provide a very simple and intuitive model in which the potential benefits of heterogeneity come from variety in production, while the costs come from the inability to agree on common public goods and policies. This framework can be applied to analyze the optimal number of jurisdictions by comparing costs and benefits. One can also think of ‘computing’ the optimal size of a country. In both cases, larger positive effects that come from variety and a lower cost of heterogeneity would make the size of the country chosen by a welfare-maximizing social planner larger.
Are larger countries more productive than smaller ones since they have more variety? This will depend on trade restrictions. If these are severe, the size of the country would be large for productivity reasons. Under free trade, countries can be small, enjoy the benefits of homogeneity as far as public-goods provision is concerned, but take advantage of diversity in production and consumption through international trade. Alesina et al. (1999) argue that the effects of the size of countries on economic success is mediated by the extent of freedom of trade.
The structure of the chapter is as follows. Section 18.2 is concerned with measures of ethnic heterogeneity. Section 18.3 is devoted to the existing literature on the economic effects of ethnic heterogeneity at the country, region, and community level. Section 18.4 analyzes the theoretical underpinnings of the relationship between ethnic heterogeneity and conflict as well as empirical findings. Section 18.5 concludes.
18.2 Measuring Ethnic Heterogeneity
In recent work, it is common to measure ethnic diversity using a so-called index of ethnic fractionalization (or diversity), which is included as an exogenous variable in regressions that try to measure how ethnic fractionalization influences economic or political outcomes, such as growth, investment, diffusion of technological innovations, instability, corruption, and conflict. Business as usual is not possible in a society with a high level of potential ethnic conflict. Trade may be restricted to individuals of the same ethnic group and public infrastructures can have an ethnic bias. Government expenditure may favor some ethnic groups. The common element in all these mechanisms is the existence of an ethnic conflict that, through social and political channels, spreads to the economy. The channel may be direct (diversity has an effect on growth) or indirect (diversity has an effect on investment and thus on growth). However, many empirical studies find no relationship between ethnic fractionalization and conflict.1
There are at least two explanations for this lack of explanatory power. (i) There is the possibility that the classification of ethnic groups does not really measure what it is supposed to measure. (ii) One can argue that fractionalization indices do not capture appropriately the likelihood of conflicts. It is indeed theoretically unclear to what extent a diversity index can capture potential conflict. In principle, the claim that there exists a positive relationship between fractionalization and conflict is based on the premise that a larger number of ethnic groups increases the probability of a conflict. Many authors would dispute such an argument. Horowitz (1985), the seminal reference on the issue of ethnic groups in conflict, argues that the relationship between ethnic diversity and civil wars is not monotonic: there is less violence in highly homogeneous and highly heterogeneous societies, and more conflicts in societies where a large ethnic minority faces an ethnic majority. If this is so, then an index of polarization should do better than an index of fractionalization in capturing the likelihood of conflicts or the intensity of potential conflict.
The theoretical properties of indices that measure differences among characteristics whose values lie on the real line (income, wealth) have been thoroughly analyzed. They led, among other indices, to the Gini index, which summarizes the distribution of income, but fails to consider particular areas of the distribution. Polarization indices2 put more weight on the tails of the distribution. Labor economists, for instance, measure polarization as ratios of deciles: the 90–10, 90–50, or 50–10 differentials are common measures of wage inequalities.
Both the index of income polarization (a particularly important case of one-dimensional polarization) and the Gini index assume that distances among individuals or groups are measured on the real line. However, when we measure cultural diversity of individuals or groups we have to move from distances on the real line to discrete distances (belong/do not belong), which cannot be ordered on the real line. Measuring ethnic diversity using some particular concept of ‘continuous distance’ among ethnic groups is very difficult and the dynamics of the ‘we’ versus ‘you’ distinction is more powerful than the possible antagonism generated by the ‘distance’ between them. In addition, any classification of ethnic groups implies a criterion to transform the differences of characteristics of groups into a discrete decision rule (e.g. same family or not).
Let us illustrate the problem by the following example. According to the classification of the World Christian Encyclopedia (Barret, 1982), the ethnic subgroups of the Luba, the Mongo, and the Nguni belong to the Bantu ethnolinguistic group. The Akan, the Edo and the Ewe belong to the Kwa ethnolinguistic group. This has as the consequence that the ‘cultural distance’ (defined informally by the Encyclopedia) among the subgroups of the Bantu group is smaller than the distance between two subgroups belonging to two different groups.
In terms of a discrete metric and if we use the family classification as the basis for differences across groups, the subgroups of the Bantu family are inside a ball of radius r that defines the discrete metric, while the subgroups in the family Kwa are outside that ball. Therefore, we can consider that any classification involves implicitly a concept and a measure of ‘distance’ that is discretized. For this reason we may want to consider whether an individual belongs or does not belong to an ethnic group only, when we are concerned with measuring ethnic diversity. Moreover, in the case of ethnic diversity, the identity of groups is less controversial than the ‘distance’ between them, which is much more difficult to measure than the distance between their incomes or wealth. It is thus reasonable to treat the distance across groups as generated by a discrete metric (1, 0). Two measures can be calculated in such a discrete distance world: the Herfindahl index for fractionalization and the Reynal-Querol (RQ) index for polarization.
18.2.1 The Herfindahl Index and Ethnic Fractionalization
Many papers use as an index of ethnolinguistic fractionalization the Herfindahl concentration index subtracted from 1.3 It is written:
 (18.1)
where πi is the proportion of people that belong to ethnic (religious or cultural) group i and N is the number of groups. The broad popularity of this index is based on its intuitive appeal: it captures the probability that two randomly selected individuals from a given country do not belong to the same ethnolinguistic group.4 Most empirical papers analyzed in Section 18.3 use this index to represent ethnic or ethnolinguistic diversity and the data to compute it often come from the Atlas Narodov Mira (1964) compiled in the former Soviet Union in 1960. Such an index was computed for the first time by Taylor and Hudson (1972).
Fearon (2003) argues that cultural or linguistic distances between ethnic groups are as important as their identification as groups and suggests that distances should be included in the index. This had already been proposed by Greenberg (1956). On these issues, see Chapter 19 in this volume.
18.2.2 The RQ Index and Ethnic Polarization
The issue of how to construct an index that is appropriate to measure polarization in the context of groups with discrete differences and, at the same time, capture potential conflict, is the basic point discussed in Montalvo and Reynal-Querol (2002, 2005a).
Assume that there are two countries, A and B, with three ethnic groups each. In country A the distribution of the groups is (0.51, 0.48, 0.01) while in the second country, B, it is (0.33, 0.33, 0.34). Which country will have a higher probability of social conflicts? Using the index of fractionalization, the answer is B since it is the situation with the highest level of fractionalization. Montalvo and Reynal-Querol (2002, 2005a) and Reynal-Querol (2002) argue that the answer is A since, in this case, a majority is confronted by a large minority. They use the RQ index of ethnic polarization, originally proposed by Reynal-Querol (1998, 2001), which also uses a discrete metric, but captures polarization instead of fractionalization. The RQ index considers, implicitly, that the distances are 0 among individuals belonging to the same group and 1 if they belong to different groups. The same assumption is made, with respect to the metric, by the fragmentation measure. This is the basic feature that distinguishes the fractionalization index from the Gini index. The original purpose of this index was to capture how far the distribution of ethnic groups in a particular area is from the (1/2,0,0,…,0,1/2) distribution (bipolar), which represents the highest level of polarization. The RQ index (derived in Section 18.4.1 of this chapter) takes the following form:
 (18.2)
where πi is, as before, the proportion of people that belong to ethnic (religious or cultural) group i and N is the number of groups.
18.3 Ethnic Diversity and Economic Outcomes
18.3.1 Ethnic Diversity and Growth
Mauro (1995) brought ethnic diversity to the attention of economists by using it as an instrument of corruption. The seminal work by Easterly and Levine (1997) shows that ethnic diversity helps explain cross-country differences in public policies and other economic indicators. The motivation for their paper is that, although much of the literature points to a diverse set of potential causes of sub-Saharan Africa’s tragedy ranging from bad policies to poor education, or political instability, the literature does not explain why some countries choose growth-enhancing policies, while others adopt growth-retarding policies. The question Easterly and Levine try to answer is why so many public policies go so badly wrong in Africa. They examine a simple hypothesis: do cross-country differences in ethnic diversity explain a substantial part of differences in public policies, political instability, and other economic factors associated with long-term growth? They analyze the direct effect of ethnic diversity on economic growth as well as its indirect effects on public policy choices that, in turn, influence long-term growth rates. Although the paper tries to explain Africa’s growth tragedy, it uses a sample that also includes other developing countries. Their main result indicates that going from complete homogeneity to complete heterogeneity is associated with a fall in growth of two percentage points. After this seminal work, many papers have considered ethnicity as an important determinant of economic outcomes.
Collier (2000) seeks to ascertain whether the effects of ethnic diversity on economic performance depend on the political context. To analyze this, he develops a model to determine the effect of ethnic diversity in two different institutional set-ups: democracy and autocracy. The model implies that ethnic diversity leads to a reduction of the growth rate of the economy in a dictatorship, but it has no negative effect on growth in a democratic country. To test empirically this theory he uses two datasets: a cross-section of 94 countries between 1960 and 1990, and a database of World Bank projects in 89 countries. Collier finds that, in agreement with theory, ethnic diversity has no effect on the growth rate of democracies, while in dictatorships, it brings about government choices that reduce growth rates. Therefore, diversity would be damaging to growth when political rights are limited. In addition, Easterly (2001) finds that when ethnic diversity is high, poor institutions in a country have even stronger negative effects on growth and policy. In countries with sufficiently good institutions, however, ethnic diversity does not reduce growth or worsen other outcomes (schooling, criminality and assassinations, financial depth, etc.). Good institutions also reduce the risk of wars and genocides that may otherwise result from ethnic fractionalization.
Later papers dealing with specific countries find similar effects. Sparber (2010) illustrates that racial diversity in the United States5 generates both gains and losses. Creative decision-making and customer services are boosted by racial heterogeneity, but losses associated with common action are exacerbated since heterogeneous societies oppose wealth redistribution. Lee (2011) poses two questions. Have more diverse English cities grown faster? Is it important to have a multinational or an ethnically diverse population? He uses data on growth of employment in 53 English cities from 1981 to 2001. The empirical evidence shows that cities with more diverse populations grow faster, but that the effect is driven by country of birth diversity rather than by diversity of ethnicity. Neither diversity by country of birth nor ethnic diversity are significant when they appear alone among the regressors. When both are included simultaneously, Lee shows that cities with a large number of migrants appear to witness higher employment growth, but ethnically diverse cities are less successful.
Dincer and Wang (2011) focus on the effects of ethnic diversity on economic growth across Chinese provinces between 1982 and 2007. They find a negative relationship between diversity and economic growth throughout Chinese provinces. Although diversity does not fully explain the growth differentials among Chinese coastal and inland provinces, the high level of ethnic diversity in inland China appears to be an important factor nevertheless.
Other authors have considered different ways to measure diversity and found similar results. Alesina et al. (2011) argue that the borders of many countries are the result of processes that have little to do with whether people desire to be together or not. The paper’s principal contribution is to provide two new measures that aim at capturing how ‘artificial’ political borders are. They both try to extract from the usual measure of ethnic fractionalization the part that is associated with the political construction of artificial states. One measure of artificiality of a state considers how straight land borders are, assuming that it is more likely for straight borders to be artificial and less likely to follow geographic features. The second focuses on borders that separate ethnic or linguistic groups. The idea is to measure the degree to which ethnic groups were divided by artificial borders. It is operationalized as the share of the population of a country that belongs to a partitioned group. It is interesting to notice that these two measures have a correlation close to 0 despite the fact that they want to measure closely connected phenomena. The basic idea is that artificial states perform worse than non-artificial states. The main results are that the variable that captures the partition of groups is a significant determinant of gross domestic product (GDP) per capita, while the one capturing the straightness of borders is less robust, but is nevertheless also often correlated with GDP per capita. The sign is the one expected by the theory: the more straight the land borders and the higher the share of population of an ethnic or linguistic group separated by borders, the lower the GDP per capita. The same negative effect is found in analyzing other dependent variables such as the rule of law, government effectiveness, etc.
Sparber (2010) also exploits variation across US regions from 1980 to 2000 to establish whether racial heterogeneity leads to gains or losses for states and cities. Evidence is more ambiguous at the state level than at the city level, since the causal connection between diversity and gross state output per worker only appears in random effects specifications. Campos et al. (2011) address a potential problem that is pervasive in much of this literature. They study the importance of the assumption that ethnic diversity does not change over time. Using data from censuses or micro-censuses, they create indices for four points in time for a sample of 26 transition economies and find weak evidence for a direct effect of diversity on the standard augmented Solow growth model. However, more importantly, the panel estimates show that ethnic fractionalization as well as polarization are endogenous and significantly negatively related to growth.
18.3.2 Ethnic Diversity and Public Goods
Another issue that has been widely studied is the effect of ethnic diversity on the provision of public goods. Alesina et al. (1999), who were the first to bring this problem up, argue that certain public goods supplied by US cities, such as education and roads, are inversely related to ethnic fragmentation. In cities where ethnic groups are polarized and where politicians have ethnic constituencies, the proportion of the budget spent on public goods is low. Representatives of ethnic base interest groups are likely to value only the benefits of public goods that accrue to their groups and discount the benefits for other groups. This can occur for two reasons. One is because different ethnic groups have different preferences over the type of public goods to be produced using tax revenues. The second is that for each ethnic group the utility level for a given public good is reduced if other groups also use it. Political actors undervalue the provision of public goods and choose to divert more public resources to private patronage. The authors test their hypotheses using three cross-section samples of expenditures on public goods (education, roads, and trash pick-up) in US urban localities, cities, metropolitan areas, and counties. They find that ethnic fractionalization is negatively associated with the budget share of all three ‘productive’ public goods.
Alesina et al. (2003) test whether a tradeoff between economies of scale and heterogeneity might help explain the number and size of school districts, municipalities, special districts, and school attendance areas in the United States. They use counties as basic units and focus on income, race, ethnic, and religious heterogeneity, using data from US Population Censuses and over 50 additional sources. They provide both cross-sectional and panel evidence. Their results suggest that the tradeoff between economies of scale and heterogeneity is important in determining the number and size of local political jurisdictions. In order to avoid racial heterogeneity in their local jurisdiction, people are willing to sacrifice economies of scale. The same applies for income heterogeneity, although the tradeoff is smaller in magnitude and less robust. Little evidence is found of a tradeoff between economies of scale and religious heterogeneity, or white or Hispanic ethnic heterogeneity. They find evidence that individuals avoid heterogeneity as they do not wish to interact with people who are different and also because different people prefer different public goods. The results are not sufficiently conclusive to allow them to apportion the blame neatly, but their conclusion is that both explanations hold.
Miguel and Gugertyb (2005) examine the relationship between ethnic diversity and local primary school and community water well funding in western Kenya, and show that ethnic diversity is negatively related to local public goods provision in this part of rural Africa. The paper contains two main innovations: the use of historically determined patterns of ethnic settlement to identify the relationship between diversity and collective action, and quantitative evidence on the role that social sanctions play in sustaining the provision of local public goods. The theoretical model highlights how inability to impose social sanctions in diverse communities leads to collective action failures. They also find that in diverse areas, school committees impose fewer sanctions on defaulting parents.
More recently, Baldwin and Huber (2010) address an important problem that is pervasive in this literature. They argue that the standard measure of ethnolinguistic fractionalization is utilized in the vast majority of cross-national studies concerned with ethnic diversity and governance. This measure contains information regarding group identity and size, but incorporates no other information concerning their substantive characteristics. Baldwin and Huber examine two significant kinds of differences between groups (cultural and economic) to understand the empirical relationship between such differences and the provision of public goods in 46 countries. Their analysis compares existing measures of cultural differences with a new measure that captures economic differences: between-group inequality. They find a strong and robust relationship between the level of provision of public goods and between-group inequality, which is not so if traditional measures of ethnic diversity or cultural differences between groups (such as the languages spoken) are used.
18.3.3 Ethnic Diversity, Cooperation, Trust, and Networks
Trust and cooperation are another topic of interest among researchers who study the impact of ethnic diversity. Alesina and La Ferrara (2000) study the links between heterogeneity of the population (in terms of income, ethnics, and race) and the level of participation in social activities (religious groups, hobby clubs, youth groups, sports groups, etc.) as a proxy for social capital. The propensity to participate in such activities depends on a community’s composition and its degree of heterogeneity. Evidence on US cities suggests that income inequality and racial fragmentation are strongly inversely related to participation. Ethnic fragmentation also has a negative influence, but to a lesser degree than racial fragmentation. The groups most affected by heterogeneity are those in which members directly interact to a significant extent and excludability is low. Individuals who are most vocal in opposing racial mixing choose to participate less in racially mixed communities. The conclusion of the paper is that racial heterogeneity decreases social capital.
Alesina and La Ferrara (2002) study who trusts others more and why. They use US General Social Survey (GSS) data for 1974–1994 in which respondents are asked whether they think that ‘most people can be trusted’. They define as ‘trusting’ those individuals who answer that ‘most people can be trusted’, and as ‘non-trusting’ those who say that ‘you can’t be too careful’ or ‘it depends’. They regress the variable Trust on a set of individual characteristics, plus year and state dummies. They find that the factors that most greatly reduce trust are: (i) a recent history of traumatic experiences, (ii) the belonging to a group that has historically been discriminated against, such as minority groups (blacks in particular) and, to a lesser extent, women; (iii) economic failure in terms of income and education; and (iv) living in a community that is racially mixed and/or has a high degree of income disparity. Interestingly, they also find that trust is not significantly affected by religious beliefs and ethnic origin. The effect of heterogeneity on trust is partly due to the fact that individuals trust those most similar to themselves (Alesina et al., 2005).
Other studies concentrate on network relationships rather than on proxy measures for trust. For example, Biggs et al. (2002) analyze the often-hypothesized idea that economic exchange can be facilitated by ethnic networks. They use data from a survey collected in 1993 on 207 Kenyan manufacturing firms in four sectors that together account for 72% of the country’s manufacturing output. They find that ethnicity does not affect access to formal sources of finance, whereas firm size, collateral, and checking account history do. However, membership in an ethnic group is significant with regard to access to informal sources of finance such as supplier credit. Bigsten et al. (2000) also attempt to explain why an increasing share of small Kenyan firms is informal. They consider a range of explanatory variables, from human capital to economic networks and ethnicity, and investigate how they relate to informal–formal sector differences. They focus on three main issues: choice of formality status at start-up, differences between formal and informal firms in productivity, and differences in growth and investment rates of African and Asian firms. The data analyzed consist of a sample of small firms in four Kenyan manufacturing sectors from the Regional Programme for Enterprise Development (RPED) survey, initiated by the World Bank. They find that while it is more likely for African-owned firms to start informally, it is less likely for those owned by either professionals or older persons. African informal firms are more efficient than African formal firms, but both are less efficient than Asian-owned formal firms. They conclude that ethnicity is important in explaining the choice of becoming formal or informal, while the network implications of ethnicity account for the differences in productivity, investment and growth prospects.
At the theoretical level, Fearon and Laitin (1996) argue that formal and informal institutions usually work to contain or ‘cauterize’ disputes between individual members of different groups. Using a social-matching game model, they show that there are two ways for local-level interethnic cooperation to be supported: spiral equilibria and in-group policing equilibria. In spiral equilibria, disputes between individuals are correctly expected to spiral rapidly beyond the two parties and fear of this induces cooperation ‘on the equilibrium path’. In in-group policing equilibria, individuals ignore transgressions by members of the other group, correctly expecting the culprits to be identified and sanctioned by their own ethnic brethren. Laitin (2002) investigates the determinants of participation in groups and the role of heterogeneity (in particular wealth inequality) for group functioning. He considers a simple model that formalizes the impact that increased inequality has on individual and aggregate levels of participation, comparing two possible mechanisms of group functioning: ‘open access’ and ‘restricted access’. Using data from households in rural Tanzania, Laitin shows that people living in villages with higher inequality are less likely to be members of groups and that this effect is more pronounced for relatively wealthier individuals. Greater dispersion in levels of wealth would seem to be associated with greater homogeneity in group composition and with ‘negative’ outcomes with regard to group functioning.
Another set of papers looks at altruistic behavior. Hungerman (2009) explores whether governments can counteract the impact of diversity on altruistic behavior. In theory, the relationship between diversity and crowding-out depends on the effect of diversity on the incentives of individuals to give. The author investigates whether government intervention is more effective in diverse communities. For identification purposes, he exploits the Supreme Court-mandated 1991 expansion of the Supplemental Security Income (SSI) program. Using a new dataset of United Methodist churches from 1984 to 2000, the paper shows that the expansion of SSI crowds out charitable spending by churches. Crowding-out occurs almost entirely in relatively homogeneous communities; there is only modest evidence of it in racially diverse communities. Thus, while diverse communities have the lowest levels of altruism, in this instance they are the most amenable to government intervention.
18.3.4 Ethnic Diversity and Other Economic and Political Outcomes
The consequences of diversity on many other economic outcomes have also been studied. Fafchamps (2000) investigates whether the lack of ethnic diversity that is observed in the business communities of many developing countries can be perpetuated by market interaction alone. Black entrepreneurs and firms headed by females encounter greater problems in obtaining supplier credit, whereas ethnicity and gender play no significant role in access to bank overdrafts and formal loans. In access to trade and bank credit, a determinant role is played by variables measuring socialization and information, which have an overwhelming effect on the granting of trade credit to clients. Network effects explain patterns of market interaction. Black and female entrepreneurs are penalized for their lack of connections with the business establishment, and for the difficulties they have to distinguish themselves from the mass of small, inexperienced micro-enterprises run by blacks or women. Thus, many firms managed by blacks and women are partially or completely excluded from trade credit practices, which affects their growth. Kochan et al. (2003) also provide interesting results on the effects of ethnicity on business. Since 1996, under the auspices of a non-profit organization called the Business Opportunities for Leadership Diversity Initiative (BOLD), a group of industry chief executives and human resource professionals have been working together to help American corporations learn how to leverage their cultural diversity for competitive advantage. To examine the relationships between gender, racial diversity, and business performance they designed a large-scale field research project. They find that racial and gender diversity do not have the positive performance effect of diversity in organizations proposed by optimists (i.e. not consistently or under all conditions), but neither do they necessarily have the negative effects by those with a more pessimistic view.
Ottaviano and Peri (2005) consider the impact of cultural diversity on the economic life of US cities. Their paper investigates whether the wage of the average US-born is affected by linguistic diversity and also tries to quantify the effect on particular subgroups (black versus white workers, more educated versus less educated). Fractionalization of mother tongues of workers serves as a proxy for cultural diversity. By studying 160 US Metropolitan Statistical Areas between 1970 and 1990, they are able to isolate a significant and robust positive correlation between wages and employment density of US-born workers, and richer linguistic diversity. The effect is stronger for highly educated workers and white workers. By comparing wage and employment density distributions across US cities, they argue that this correlation is compatible only with a dominant positive correlation between productivity and diversity. Furthermore, instrumental variable estimation supports the idea of causation going from the latter to the former. They conclude that benefits from integrated immigrants (i.e. who have been in the United States for a longer period of time and speak good English) are greater than those from new immigrants. Such results are in accordance with previous studies that find that ethnic diversity is bad for the provision of local public goods, since more diverse societies are less willing to pool resources for collective purposes. This suggests that integration and assimilation may be prerequisites for reaping the full gains of cultural diversity. Ottaviano and Peri (2006) investigate the economic consequences of the growing diversity of American cities on US natives. They estimate two regressions in which cultural diversity, measured by fractionalization or by the share of foreign-born residents, affects average wages received and the average rent paid by US-born workers. The main finding is that on average, cultural diversity has a net positive effect on the productivity of US-born citizens because it is positively correlated with both the average wage they are paid and the average rent they pay. This partial correlation manages to survive the inclusion of many variables that proxy for productivity and amenity shocks across cities.
Finally, attention has also been given to the effect of fractionalization on cities. Ottaviano and Prarolo (2009) study a model in which multicultural cities emerge as the result of cultural diasporas when knowledge creation is fostered by diversity and cultural identity is endangered. This danger is weakened when individuals are able to maintain strong links with people of their own culture no matter where they reside. Improvements in communication and transportation foster the emergence of multicultural cities in which diversity promotes productivity.
Kokkonen et al. (2010) take a different perspective. They focus on the contextual effects of ethnic diversity. They seek to ascertain whether frequent interethnic personal contacts can help Western countries overcome the strains associated with increasing international immigration. They focus on schools in Sweden – a setting in which interethnic personal contacts are inevitable, but not necessarily positive in character. To estimate the contextual effects of diversity, multilevel modeling was used to analyze the 1999/2000 CIVED dataset, which covers 3000 high school students from 94 schools. The authors conclude that interethnic contacts do not have the positive effects assumed and described in much of the literature. Nevertheless, their findings regarding the deteriorating fundamentals of social life are less pessimistic than suggested by many recent reports.
Finally, Laitin (2000) concentrates on the political impact of ethnic heterogeneity. He argues that one major problem in testing its influence on political outcomes is the lack of consensus on how to measure the degree of heterogeneity. The measures are beset by empirical problems such as obtaining standards of what ‘knowing’ a language means and theoretical problems such as whether the ability to communicate is sufficient to construct an indicator of cultural homogeneity. The paper suggests a typology to define language communities. Data collected from post-Soviet republics illustrates the possibilities of these type of data on the basis of the types defined in the paper. Unfortunately, the number of observations is too small to perform a good statistical analysis.
All these studies use fractionalization to capture ethnic diversity. However, this implies that the larger the number of groups, the larger the impact on economic growth, the provision of public goods, etc. It could, however, be that the effect of diversity is larger when there are only two competing groups. This can be much better measured by polarization indices, which is the topic of the next section.
18.4 Heterogeneity and Conflict
18.4.1 What do Theoretical Models Predict?
The question tackled here is whether polarization measures are better suited to predict conflict than fractionalization measures. If we want to analyze whether social heterogeneity (based on differences of income, ethnicity, religion, etc.) affects conflict, we need to understand the theoretical relationship between the distribution of groups and social conflict. To do this, it is convenient to construct a theoretical model that relates an index of social heterogeneity with some indicators of potential conflict.
It is difficult to find a model that justifies the relationship between fractionalization and conflict. The simple interpretation of the index of fractionalization as the probability that two randomly drawn people will be from different ethnic groups is the basic reason why the index has been widely used. Therefore, in principle, if two individuals of different groups have a high degree of antagonism, then, each time they meet, the probability that they will fight is large. If their respective groups stand by their members then a high degree of fractionalization means a high probability of conflict.6
However, the degree of antagonism is endogenous to the distribution of group sizes. Horowitz (1985) argues that the worst possible situation is characterized by a majority that is confronted with a large minority. In this case the degree of antagonism is likely to be very high because the size of the groups is similar. In his seminal contribution on ethnic conflict, Horowitz argues that the relationship between ethnic diversity and civil wars is not monotonic: there is less violence in highly homogeneous and highly heterogeneous societies, and more conflicts in societies where a large ethnic minority faces an ethnic majority. If this is indeed the case, then an index of polarization would predict the likelihood of conflict better than an index of fractionalization.
Rent-seeking models are a popular device to capture the microeconomics of conflict, since they conclude that social costs are higher, and social tensions emerge more easily, when the population is distributed in two groups of a large size. Therefore, they provide a theoretical justification for using polarization measures in the context of conflict. Esteban and Ray (1999) develop a behavioral model that links the level and pattern of social conflict to the society-wide distribution of individual characteristics. Their model can be applied to groups that differ in characteristics such as wealth, ethnicity, religion, and political ideology. Conflict is seen to be closely connected with the bimodality of the underlying distribution of characteristics. However, in general, the conflict distribution relationship is nonlinear and surprisingly complex. Recently, Bhavnani et al. (2008) developed an agent-based computational framework to conduct simulations on the onset and duration of civil wars of different conceptualizations of ethnicity, different patterns of ethnic dominance and polarization, and new measures of ethnic salience.
From a theoretical perspective, the RQ index described in Section 18.2 was derived by Montalvo and Reynal-Querol (2005b) from a simple model of rent-seeking. They assume that the society is composed of N individuals distributed in M groups. Without loss of generality, let ∑ ni = N = 1. Then, πi, the proportion of individuals in group i, will be equal to ni. Society chooses an outcome over M possible issues, where issue i is the outcome (say, a pure public good for group i’s members) most preferred by group i.
Define by uij the utility derived by a member of group i if issue j is chosen by the society. In a pure contest case,7 uii>uij = 0, for all i,j with i ≠ j. Therefore, individuals will only spend resources on their most preferred outcome, i. Owing to the rent-seeking nature of the model, Montalvo and Reynal-Querol assume that agents can try to alter the outcome by spending resources in favor of their preferred outcome. Therefore, there will be M possible outcomes depending on the resources spent by each of the M groups.
Now, define xi as the effort or the resources spent by an individual or group i and assume that the individuals in each group act in a coordinated fashion, ignoring the possibility of free-riding within each group. The total resources devoted to lobbying are ![]() . Following this interpretation R can be thought of as a measure of the intensity of social conflict.
. Following this interpretation R can be thought of as a measure of the intensity of social conflict.
Assume that the cost of resources or effort x for each individual is quadratic: c(x) = (1/2)x2. The basic element of any rent-seeking model is the contest success function, which defines the probability of success as: 8

where pj is the probability that issue j is chosen, which depends on the resources spent by each group in favor of each outcome, provided that R > 0.
Then each member of group i has to decide the amount of resources he or she wants to spend in order to maximize his or her expected utility given that he or she does not care about non-preferred outcomes, in which case the contest success function to be maximized is:

subject to pj=πjxj/R.
Assuming a pure contest case and uij = 0 for all j ≠ i, and at least one group spends positive resources, xj > 0, for some j ≠ i, the first-order conditions that solve the problem of maximizing the expected utility, once the probabilities have been substituted in the expected utility function by its definition as a function of π, x, and R, are:
![]()
Adding all the first-order conditions leads to:

Assume that individuals only get utility from their most preferred issue and that utility is characterized as uii = k. Then:
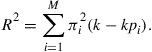
We state the following two propositions, which are proved in the Appendix.
Proposition 1.
If there are only two groups the normalized (squared) total cost can be written as ![]() , which is the RQ index of polarization.
, which is the RQ index of polarization.
Proposition 2.
If there are M groups of equal size, the normalized (squared) total cost can be written as ![]() .
.
We should notice that this derivation is constrained by many assumptions (pure contest and two groups or equal size groups) and, therefore, should be taken as an application that illustrates the relationship between the RQ index and the rent-seeking literature. However, we should also point out that the usual derivation of Herfindahl’s index in the industrial organization literature uses a very constrained set-up and relies strongly on the symmetry of firms.
18.4.2 Heterogeneity, Conflict, and Development: Empirical Analysis
This section describes the empirical literature on the relationship between diversity, conflict, and economic development. Sen (1973), among others, claims that there is a very close relationship between inequality and conflict. However, this connection has been very elusive in empirical research. Collier and Hoeffler (1998) provide one of the first empirical analyses. They find that neither income inequality nor ethnic fractionalization are statistically significant in explaining the onset of a civil war, but that fractionalization is weakly significant in explaining its duration. Nevertheless, even then, the effect is non-linear: the square of the index of fractionalization is also statistically significant. Collier (2000) distinguishes between dominance, in which one group constitutes a majority, and fractionalization, in which there are many small groups. He shows that fractionalization is normally unproblematic in democracies, although it can be damaging in dictatorships. Collier and Hoeffler (2004) confirm the empirical irrelevance of income inequality (measured by the Gini index or by the ratio of the top-to-bottom quintiles of income using the same data as Deninger and Squire, 1996). Fearon and Laitin (2003) also find that inequality (measured by the Gini index) is not statistically significant and that fractionalization actually makes societies safer, while dominance increases the risk of conflict.
As argued earlier, this may show that the correct measure to approach potential conflict is polarization. Therefore, the negative empirical results of most of the literature do not imply that cultural heterogeneity has no effect on conflict. Montalvo and Reynal-Querol (2005a,b) find that ethnic polarization, measured by the RQ index, has a statistically significant effect on the incidence of civil wars and that ethnic fractionalization has a negative effect on economic development, but find no empirical support for the negative effect of diversity on indirect channels of development such as investment or civil conflicts. Both results had already been reported in the literature. Montalvo and Reynal-Querol’s (2005b) alternative approach finds that ethnic and religious polarization have a large and negative effect on economic development through the reduction of investment, the increase of government consumption, and the increase in the probability of civil conflicts.
Other studies relate the intensity of civil wars (usually measured by the number of casualties) and social diversity. Using data on the casualties across space and over time in districts of Nepal, Do and Iyer (2010) conclude that there is some evidence that greater social polarization (measured by caste diversity) is associated with higher levels of conflict, but that linguistic fractionalization and polarization have no significant impact on conflict intensity. Some other studies, such as Lim et al. (2007), argue that ethnic and religious fractionalization (and polarization) are measures of diversity that do not consider the spatial structure of ethnic and religious groups. Their model focuses on the geographic distribution of the population as a predictor of conflict. Violence is expected to arise when groups of certain characteristic size are formed and not when groups are much smaller or larger than that size. Therefore, highly mixed regions and well-segregated groups are not expected to generate violence.9 By contrast, partial separation with poorly defined boundaries is more prone to conflict. Lim et al. (2007) perform simulations based on census data and an agent-based model10 for India and the former Yugoslavia. They are able to predict (with a high level of accuracy) the regions of reported violence, by just using a pixelated geographic map of the location of ethnic groups.
There is less evidence of the effect of ethnic diversity on genocides and mass killings. Harff (2003) constructs a dataset on genocides and politicides, and tests a structural model of the antecedents in both situations. She identifies six causal factors and tests, in particular, the hypothesis that larger ethnic and religious diversity increases the likelihood that communal identity will lead to mobilization, and, if conflict is protracted, prompts decisions to eliminate the group that is maybe responsible for actual or potential challenges. However, she finds no empirical evidence to support this hypothesis. The variables used to capture potential conflict are measures of diversity (ethnic fractionalization). For this reason, and in line with most of the literature on the determinants of civil wars, Harff (2003) concludes that the effect of ethnic diversity on genocides is not statistically significant. Easterly et al. (2006) analyze the determinants of mass killings, which, they clarify, should not be confused with genocides. They find that mass killings are related to the square of ethnic fractionalization. Finally, Montalvo and Reynal-Querol (2008) find that there is a strong relationship between ethnic polarization and the risk of genocide.
18.5 Conclusions
The cultural heterogeneity of a society can have negative and positive effects on economic development. On the one hand, and this is the mechanism emphasized in the literature, cultural diversity makes cooperation more difficult, which, in turn, negatively affects economic development. However, on the other hand, ethnic diversity may also enter into the production function: people with different productive skills and different approaches to solving problems may generate positive effects on productivity, and accelerate the rate of innovation. The channels thought to explain the negative impacts are, however, elusive. In particular, the literature has failed to find consistent evidence of the effect of ethnic heterogeneity on conflict. Recent research argues that this does not imply heterogeneity to be irrelevant in explaining conflicts. It is the particular nature of the popular index of fractionalization that may be the culprit. In fact, ethnic polarization as summarized by the polarization index is statistically significant in explaining the probability of conflict, the share of investment, and the level of government expenditure in fractionalized societies.
Acknowledgments
M.R.–Q. is grateful for funding from the European Research Council under the European Community’s Seventh Framework Programme (FP7/2007–2013) ERC grant agreement number 203576. The authors acknowledge the financial support of grant SEJ2007–64340 from the Spanish Ministerio de Educacion and the Government of Catalonia.
Appendix: Proofs of Propositions
Proof of Proposition 1
It is easy to show that if M = 2, then the resources spent by each individual of any group are the same, so that x1 = x2 and pi = πi. Therefore:

As R is a measure of the total resources or the effort spent for lobbying purposes, it can be interpreted as an index of (potential) conflict.
Notice that for k = 4 this (normalized) index lies between 0 and 1, and can be rewritten as:

which is precisely the RQ index. ![]()
Proof of Proposition 2
Since all the groups have the same size, then pi = πi. Therefore:
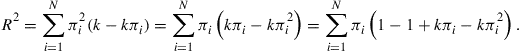
To normalize the index let again k be equal to 4. Then:

which is the RQ index.![]()
References
1. Alesina A, Baquir R, Easterly W. Public goods and ethnic divisions. Quarterly Journal of Economics. 1999;114:1243–1284.
2. Alesina A, Devleeschauwer A, Easterly W, Kurlat S, Wacziarg R. Fractionalization. Journal of Economic Growth. 2003;8:155–194.
3. Alesina A, Easterly W, Matuszeski J. Artificial states. Journal of the European Economic Association. 2011;9:246–277.
4. Alesina A, La Ferrara E. Ethnic diversity and economic performance. Journal of Economic Literature. 2005;43:762–800.
5. Alesina A, La Ferrara E. Who trusts others? Journal of Public Economics. 2002;85:207–234.
6. Alesina A, La Ferrara E. Participation in heterogeneous communities. Quarterly Journal of Economics. 2000;115:847–890.
7. Alesina A, Spolaore E, Wacziarg R. Trade, Growth, and the Size of Countries. In: Aghion Philippe, Durlauf Steven, eds. Handbook of Economic Growth. Amsterdam: North-Holland; 2005.
8. Atlas Narodov Mira, 1964. Glavnoe Upravlenie Geodezii i Kartografii. Moscow.
9. Baldwin K, Huber JD. Economic versus cultural differences: forms of ethnic diversity and public goods provision. American Political Science Review. 2010;104:644–662.
10. Barrett D, ed. World Christian Encyclopedia. Oxford: Oxford University Press; 1982.
11. Bhavnani R, Miodownik D, Nart J. REsCape: an agent-based framework for modeling resources, ethnicity and conflict. Journal of Artificial Societies and Social Simulation. 2008;11:7.
12. Biggs T, Raturi M, Srivastava P. Ethnic networks and access to credit: evidence from the manufacturing sector in Kenya. Journal of Economic Behavior and Organization. 2002;49:473–486.
13. Bigsten, A., Kimuyu, P., Lundvall, K., 2000. Informality, ethnicity and productivity: evidence from small manufacturers in Kenya. Working Papers in Economics 27. Department of Economics, Göteborg University, Göteborg.
14. Bossert W, D’Ambrosio C, La Ferrara E. A generalized index of fractionalization Economica. 2010;78:723–750.
15. Campos NF, Saleh A, Kuzeyev V. Dynamic ethnic fractionalization and economic growth. Journal of International Trade and Economic Development. 2011;20:129–152.
16. Collier P. Ethnicity, politics and economic performance. Economics and Politics. 2000;12:225–245.
17. Collier P, Hoeffler A. On economic causes of civil wars. Oxford Economic Papers. 1998;50:563–573.
18. Collier P, Hoeffler A. Greed and grievance in civil wars. Oxford Economic Papers. 2004;56:563–595.
19. Deninger K, Squire ND. A new data set measuring income inequality. World Bank Economic Review. 1996;10:565–591.
20. Dincer OC, Wang F. Ethnic diversity and economic growth in China. Journal of Economic Policy Reform. 2011;14:1–10.
21. Do Q, Iyer L. Geography, poverty and conflict in Nepal. Journal of Peace Research. 2010;47:735–748.
22. Easterly W. Can institutions resolve ethnic conflict? Economic Development and Cultural Change. 2001;49:687–706.
23. Easterly W, Levine R. Africa’s growth tragedy: policies and ethnic divisions. Quarterly Journal of Economics. 1997;112:1203–1250.
24. Esteban J, Ray D. On the measurement of polarization. Econometrica. 1994;62:819–851.
25. Esteban J, Ray D. Conflict and distribution. Journal of Economic Theory. 1999;87:379–415.
26. Fafchamps M. Ethnicity and credit in African manufacturing. Journal of Development Economics. 2000;61:205–235.
27. Fearon J. Ethnic and cultural diversity by country. Journal of Economic Growth. 2003;8:195–222.
28. Fearon J, Laitin D. Explaining interethnic cooperation. American Political Science Review. 1996;90:715–735.
29. Fearon J, Laitin D. Ethnicity, insurgency, and civil war. American Political Science Review. 2003;97:75–90.
30. Fernández R. Culture and Economics. In: Durlauf S, Blume L, eds. The New Palgrave Dictionary of Economics. second ed. New York: Palgrave Macmillan; 2008.
31. Greenberg J. The measurement of linguistic diversity. Language. 1956;32:109–115.
32. Guiso L, Sapienza P, Zingales L. Does culture affect economic outcomes? Journal of Economic Perspectives. 2006;20:23–48.
33. Harff B. No lessons learned from Holocaust? Assesssing risks of genocide and political mass murder since 1955. American Political Science Review. 2003;97:57–73.
34. Horowitz D. Ethnic Groups in Conflict. Berkeley, CA: University of California Press; 1985.
35. Hungerman DM. Crowd-out and diversity. Journal of Public Economics. 2009;93:729–740.
36. Kochan T, Bezrukova K, Ely R, et al. The effects of diversity on business performance: report of the diversity research network. Human Resources Management. 2003;42:3–21.
37. Kokkonen A, Esaiasson P, Gilljam M. Ethnic diversity and democratic citizenship: evidence from a social laboratory. Scandinavian Political Studies. 2010;33:331–355.
38. Laitin DD. What is a language community? American Journal of Political Science. 2000;44:142–155.
39. Laitin DD. Inequality and group participation: theory and evidence from rural Tanzania. Journal of Public Economics. 2002;85:235–273.
40. Lee N. Ethnic Diversity and Employment Growth in English Cities. Urban Studies. 2011;48(2):407–425.
41. Lim M, Metzler R, Bar-Yam Y. Global pattern formation and ethnic/cultural violence. Science. 2007;317:1540–1544.
42. Mauro P. Corruption and growth. Quarterly Journal of Economics CX 1995;681–712.
43. Miguel E, Gugertyb MK. Ethnic diversity, social sanctions, and public goods in Kenya. Journal of Public Economics. 2005;89:2325–2368.
44. Montalvo, J.G., Reynal-Querol, M., 2002. Why ethnic fractionalization? Polarization, ethnic conflict and growth. UPF Working Paper 660, Universitat Pompeu Fabra, Barcelona.
45. Montalvo JG, Reynal-Querol M. Ethnic polarization, potential conflict and civil wars. American Economic Review. 2005a;95:796–816.
46. Montalvo JG, Reynal-Querol M. Ethnic diversity and economic development. Journal of Development Economics. 2005b;76:293–323.
47. Montalvo JG, Reynal-Querol M. Discrete polarization with an application to the determinants of genocides. Economic Journal. 2008;118:1835–1865.
48. Ottaviano GP, Peri G. Cities and cultures. Journal of Urban Economics. 2005;58:304–307.
49. Ottaviano GP, Peri G. The economic value of cultural diversity: evidence from US cities. Journal of Economic Geography. 2006;6:9–44.
50. Ottaviano GP, Prarolo G. Cultural identity and knowledge creation in cosmopolitan cities. Journal of Regional Science. 2009;49:647–662.
51. Reynal-Querol , M. , 1998 . Growth and religious conflict. Ph.D. Thesis, LSE.
52. Reynal-Querol, M., 2001. Ethnic and religious conflict, political systems and growth. PhD Dissertation, LSE, London.
53. Reynal-Querol M. Ethnicity, political systems and civil war. Journal of Conflict Resolution. 2002;46:29–55.
54. Sen AK. On Economic Inequality. Oxford: Clarendon Press; 1973.
55. Sparber C. Racial diversity and macroeconomic productivity across US states and cities. Regional Studies. 2010;44:71–85.
56. Tabellini G. Culture and institutions: economic development in the regions of Europe. Journal of the European Economic Association. 2010;8:677–716.
57. Taylor C, Hudson MC. The World Handbook of Political and Social Indicators. second ed. New Haven, CT: Yale University Press; 1972.
1For further discussion of these issues, see Chapter 19 by Ginsburgh and Weber in this volume.
2See Esteban and Ray (1994) for a theoretical description.
3The same index was independently proposed by Greenberg (1985).
4Bossert et al. (2010) recently proposed a generalized index of fractionalization.
5Racial fractionalization indices for state-industry cells for 1980, 1990, and 2000 are derived from census data.
6It could also be the case that to build a rebel army there is need for social cohesion. In a diverse society, with a high degree of fractionalization, the opportunity of rebellion and conflict may be limited by the recruitment pool.
7In pure contests each group is assumed to dislike equally the outcomes of all the other groups.
8This is a particular case of the ratio form of the contest success function. In general the ratio form is p1/p2=(x1/x2)z, where z defines diminishing returns (if z ≤ 1) or increasing returns (if z > 1) to competitive efforts x. We set z = 1.
9Notice that this hypothesis implies that measures of fractionalization, even if they are constructed at detailed geographical levels, will not be highly correlated with conflict while polarization may be.
10An agent-based model is a class of computational model for simulating the interactions of autonomous agents, or groups of agents, to assess their effects on the system as a whole. It combines game theory, complex systems, and programming tools. Randomness is introduced using Monte Carlo methods.