Viewing Logs, Reports, and Statistics
Moodle can provide teachers and administrators with detailed logs and participation reports of all the activities in a course. These tools are quite useful when you need to track students' activities in a course. You may want to analyze your course reports on a regular basis to monitor, for instance, when your students engage with the material and how long they spend in the course and with certain resources and activities. This analysis is more important if your course is completely online than if your course is a hybrid course or part of blended learning initiative. Logs can inform you about whether students find certain material you give them helpful. For example, if learners don't look at quiz review notes, you may be wasting your time preparing them.
After you retrieve the log files and they're displayed for you, they also provide you with active links to other parts of the course, such as links to user profiles, to specific pages in activities, or to resources.
![]() If you have administrative privileges, you can access site reports to keep tabs on all the roles for every course in the site, which is handy if you wear an administrative hat and have to prepare reports for your bosses. The site report tool works the same way as the course report tool except that you access it from the Site Administration block on the front page of the Moodle site.
If you have administrative privileges, you can access site reports to keep tabs on all the roles for every course in the site, which is handy if you wear an administrative hat and have to prepare reports for your bosses. The site report tool works the same way as the course report tool except that you access it from the Site Administration block on the front page of the Moodle site.
Viewing course logs
The log files for each course show all activity within the course. You can view what resources and activities are being used, when they are being used, and for how long. Course logs show activity within the course. Instructors can use this information to see what resources are being used and when. You can check individual student activity or the whole course.
To access your course log, follow these steps:
- Click the Reports link in the Administration block on your course front page.
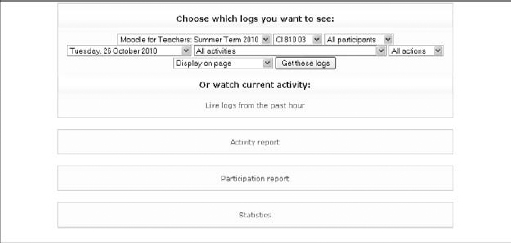
Moodle takes you to a new page with a list of filter options displayed in drop-down lists, as shown in Figure 14-13. Below the drop-down list are links to various reports that are covered in the next section.
Figure 14-13: Use the logs and reports setup page to choose data.
Moodle doesn't give a report on the complete time learners stayed in an activity. That would be quite nice. However, if you need to make sure someone stayed with a task for any particular time, you can work it out by checking the start time and the time he left the activity or logged out. Of course, students are clever, and if they know that you're monitoring time spent, they may just log in, open the activity, and then leave or watch TV.
- Select your filter options for the required data.
You can use the available filter options to choose the logs required for your reporting needs. Moodle collects a lot of data, so you need to narrow the search by using the filters listed in Table 14-2.
Table 14-2 Log Filters and Their Functionality
Filter Description Course Teacher role is required in order for the log filters to appear. This drop-down list includes all courses in which the instructor is a teacher. Participant You can choose to see all participants or individual users registered for the selected course. Day You can choose any day of the course from the first day the course started. Activity All the activities and resources you set up for your course are listed by topics or weeks. You can choose all activities or individual ones. Action The default is to view all actions. This filter allows you to select Viewed, Updated, Deleted, or All Changes Made. Display/Download Moodle enables you to display the log files on the page (which is the default) or download them as a text file, in Excel format, or ODS (Open Document Spreadsheet). - Click the Get These Logs button located on the right side of (or below if you're working on a small screen) the Display drop-down list.
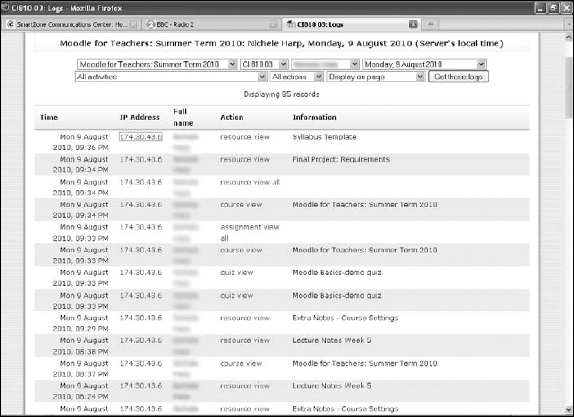
Moodle retrieves your data. Figure 14-14 displays an individual student's activity for August 9. Notice the student's name links to her profile, and each activity is also a link to that activity page.
You can return to the logs and reports page by using the navigation bar or the Back button in your browser.
Generating reports
Moodle can generate two different type of reports, one for activities, the other for participants and log files for up-to-date uses. I'm sure that from the various options you will be able to pull out dates to provide you with information you require on how your course is being explored by all your participants.
Live Logs from the Past Hour
Right under the drop-down lists of log filters in Figure 14-13 (shown earlier), Moodle enables you to view live logs from the last hour. Live logs are updated on a regular basis. They display a record of all users and all activities accessed. You don't have a choice of filtering out data. Click the Live Logs from the Past Hour link located in the center of the page.
Figure 14-14: Report for a particular student on a specific date.
Activity Report
If you need a report a particular activity or all activities in your course, you can use the Activity Report tool, which enables you to filter the exact details you need and generate a report. The activities are displayed by the topic and shown by name. The output of the generated report appears in the following order:
- Resource or activity name
- Number of times viewed
- Date last viewed
- Elapsed time since last view
To generate an full activity report, follow these steps:
- Click the Reports link in the course Administration block.
You arrive at the page shown earlier in Figure 14-13.
- Use the filter drop-down lists to narrow your search.
- Click the Activity Report link located under the log files.
You can also generate an individual user activity report, but you first need to access the learner from the participant's block. This activity report gives you a quick overview of how frequently a particular learner is involved in your course and how much time that person spends with a particular activity. To create an individual leaner report, follow these steps:
- On your course front page, go to the People block, located by default at the top-left corner of your front page and click the Participants link.
Moodle takes you to a list of all registered users (participants) in your course.
- Click the learner's name.
Moodle takes to the learner's profile page. You see a number of tabs across the top of the page
- Click the Activity Reports tab.
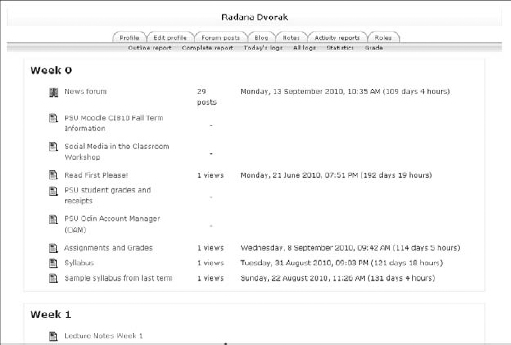
Moodle returns an Outline report, as shown in Figure 14-15 with the learner's name at the top of the page. (In this example, it's me.) Notice the other links under the tabs: Complete Report, Today's Logs, All Logs, Statistics, and Grades. You can look at forums or chats and see how involved your learner has been. You can also generate statistics if required for an individual report on the student.
Figure 14-15: The participant Activity Report.
Participation Report
A Participation Report enables you to monitor learners' participation in the course and individual activities. It doesn't give you an individual participant's report as described in the preceding section, but instead it gives reports for the roles assigned in the particular course. Administrator, Teacher, Student, and Guest are the usual default roles. This type of report can be useful, for example, if you created a VIP guest account for guest authors that participated in a forum discussion. You can generate a report on participation between the guests and learners to determine the success of the activity.
To generate a Participation Report, follow these steps:
- Click the Reports link in the course Administration block.
You arrive at the page shown earlier in Figure 14-16.
- Use the filter drop-down lists to narrow your search.
- Click the Participation Report link located under the log files.
Moodle presents you with a new page with several drop-down lists.
- Select the following options:
- • Activity module
- • Number of days you want the report to cover the activity
- • Roles
- • Actions (Your choices are All Actions, View, and Post.)
- Click the Go button to generate the report.
Statistics
If you or your administrator enables site statistics, Moodle collects statistics about each course and can produce graphs displaying them, which can be handy for departmental reports or other purposes.
To enable the statistics functionality, you need to have administrative privileges. You can find the statistics options by going to the Site Administration block, clicking the Server link, and then clicking the Statistics link. All options on the page provide you with information on each functionality. (For more on this topic, see Chapter 13.)
 Statistics is not enabled because the data can be a heavy burden on the database. If you need statistics for a certain period, make sure that you go back and de-select the functionality after you finish collecting the data.
To view statistics output, follow these steps:
- Click the Reports link in the course Administration block.
You arrive at the page shown earlier in Figure 14-13.
- Use the filter drop-down lists to narrow your search.
- Click the Statistics link located under the log files.
Moodle takes you to the statistics page.
- Choose from the drop-down lists for the following options:
- • Course: You have choices for all your courses.
- • All Activity: Select options from the drop-down list.
- • Time Period: Click the day/time.
- Click the View button.
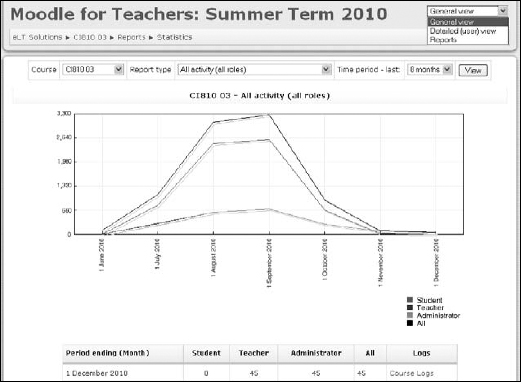
Moodle displays the data graphically along with a table, as shown in Figure 14-16. Notice that you have a menu located in the top-right corner that has three options: General Purpose View, Detailed User View, and Back to Report. The Detailed User View report enables you to select a particular learner, guest, or teacher in your course and collect her data; you have an option to download a graphic file of the data if you require it.
Figure 14-16: The Statistics Output page for All Activities.