
CHAPTER 13
Building Tables, Charts, and SmartArt to Show Data and Process
- Creating tables
- Using table styles and applying other table formatting and design settings
- Handling tables, rows, columns, and cells
- Adding and formatting SmartArt
- Inserting and designing charts
Tables, SmartArt, and charts enable you to illustrate data and processes in documents. They're extremely flexible and easy to create and manipulate. Thanks to numerous galleries, it's easy to create professional-looking tables and SmartArt or chart graphics quickly and with minimal effort. Live Preview also comes into play when you work with tables. This chapter teaches you about these features in Word.
Getting a Quick Start with Quick Tables
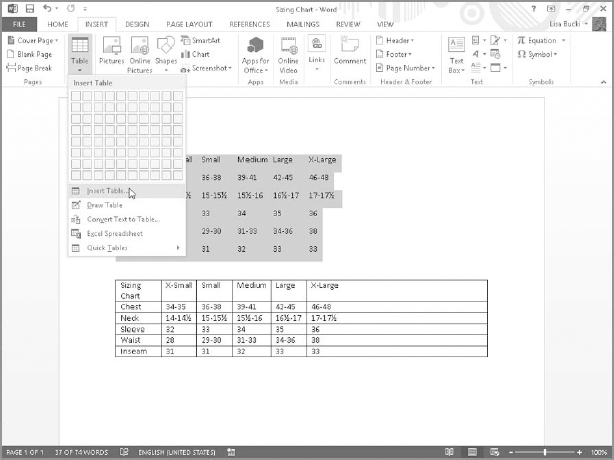
The quickest way to create a table in Word is to use one that already exists. It might not be exactly what you want, but it often will be closer to what you want and save you a lot of formatting and setup versus creating a table from scratch. It helps if you can see a picture, of course, and Word 2013 includes a Quick Tables gallery from which you can select a predefined table to insert in the current document. After you click to position the insertion point at the location where you want to insert the table, click the Insert tab. Click the Table button in the Tables group of the Insert tab, and then point to Quick Tables. The gallery shown in Figure 13.1 appears.
The Quick Tables gallery offers a number of preformatted tables.
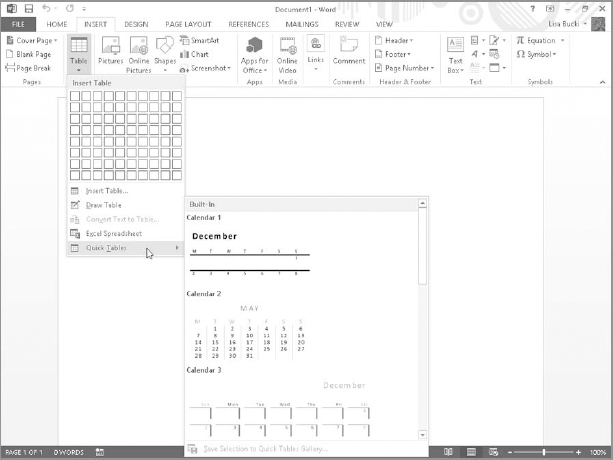
Scroll through the gallery to see if there's a table design you like—something that compares favorably with the table you envision. If there is, click on it. If it has too many rows, you can delete the ones you don't need. If it has too few columns, you can add a few more. If the proportions and other attributes aren't quite right, you can use Word's table tools to make them right. The point is that you hit the ground running.
Table Basics
One way to think about a table is as a container for information. The container consists of horizontal rows and vertical columns. If someone speaks of a five-by-four (5 × 4) table, by convention and agreement this refers to a table that's five columns high and four rows wide. If the terminology is foreign to you, think of rows as you would the windows across each floor of a skyscraper. Think of columns as the vertical columns of windows on the same skyscraper building. Rows go across, and columns go up and down.
Inserting a table from scratch
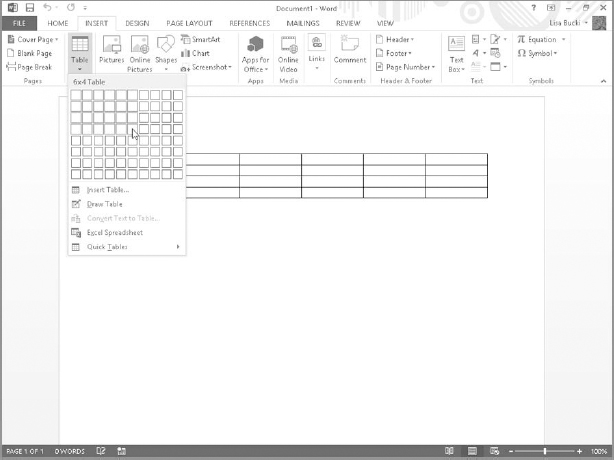
There are three basic methods for creating a table from scratch. One is to use the Table tool to select the numbers of rows and columns you want. On the Insert tab, click Table in the Tables group. Drag the mouse pointer down through the Insert Table grid. As you move the mouse, the selected table dimensions change, and Word shows a Live Preview in the document window, as shown in Figure 13.2. Click the mouse when the table has the number of rows and columns you want.
When a 6 × 4 table is selected in the Insert Table grid, a 6 × 4 Live Preview appears in the document window.
A second method for creating a table from scratch is by using the Insert Table dialog box, as follows:
- On the Insert tab, click Table in the Tables group, and click Insert Table. The Insert Table dialog box shown in Figure 13.3 appears.
The Insert Table dialog box enables you to choose the number of columns and rows and specify additional settings when creating a table.

- Enter or use the spinner buttons to specify entries for the Number of columns and Number of rows.
- Select an option under AutoFit behavior. You can specify a Fixed column width or choose AutoFit to contents or AutoFit to window to make the table adjust to other elements of the document.
- (Optional) If you'd like Word to remember to default to the dimensions you choose, then click to check Remember dimensions for new tables.
- Click OK.
The third method for inserting a table from scratch is to draw it using the Draw Table tool. To begin, choose Insert ![]() Tables
Tables ![]() Table
Table ![]() Draw Table. Drag a rectangle to establish the outer boundary of the table, and then use the Draw Table tool (which will be active at that point by default) to draw out the desired cells. Use the tools in the Table Tools
Draw Table. Drag a rectangle to establish the outer boundary of the table, and then use the Draw Table tool (which will be active at that point by default) to draw out the desired cells. Use the tools in the Table Tools ![]() Design tab's Borders group to set line style, weight, and color for the table borders. Use the Eraser tool in the Table Tools
Design tab's Borders group to set line style, weight, and color for the table borders. Use the Eraser tool in the Table Tools ![]() Layout tab to remove unwanted table parts. See the “Using the table eraser” section later in this chapter for additional information.
Layout tab to remove unwanted table parts. See the “Using the table eraser” section later in this chapter for additional information.
Cell markers and gridlines
When nonprinting formatting marks are displayed (Ctrl+Shift+8 or Home tab ![]() Paragraph
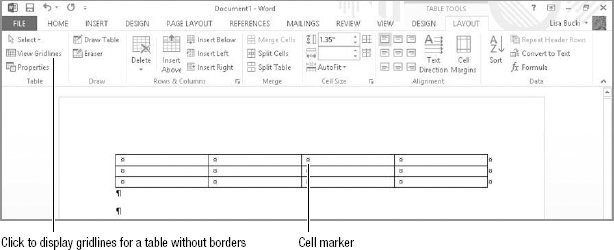
Paragraph ![]() Show/Hide), cell markers display in each cell, showing where the cells are, as indicated in Figure 13.4. You might wonder why cell markers are needed if the table borders show the location of cells. That's because not every table has borders. If a borderless table's gridlines aren't displayed, you might not even know a table is there. Toggling the nonprinting cell markers provide visibility for the table cells. Cell markers, incidentally, display whenever paragraph marks do.
Show/Hide), cell markers display in each cell, showing where the cells are, as indicated in Figure 13.4. You might wonder why cell markers are needed if the table borders show the location of cells. That's because not every table has borders. If a borderless table's gridlines aren't displayed, you might not even know a table is there. Toggling the nonprinting cell markers provide visibility for the table cells. Cell markers, incidentally, display whenever paragraph marks do.
When a table has no borders, it's a good idea to display table gridlines. These are nonprinting marks that show the cell's dimensions. To display gridlines, click the View Gridlines choice in the Table group at the left end of the Table Tools Layout tab. See Figure 13.4.
Show hidden characters to display cell markers.
Managing AutoFit behavior
Notice the AutoFit behavior options shown in the Insert Table dialog box in Figure 13.3. These same AutoFit options are also available when you move the mouse pointer over the table, right-click the table move handle that appears at the upper left, and then point to AutoFit, as shown in Figure 13.5. The AutoFit settings enable you to size the table and its columns automatically.
Right-click the table move handle to display a shortcut menu with table options, including AutoFit.
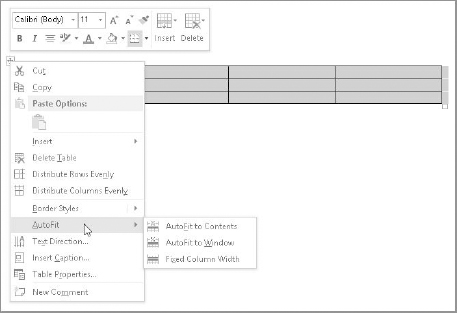
The Fixed Column Width option is straightforward enough. When you choose this option, the column widths remain fixed unless you explicitly change them by dragging or by using the Table Properties dialog box. Note that fixed is not the same as equal. The column widths might be equal also, but that's a different concept.
The AutoFit to Contents command causes a table to automatically resize as you add or remove material. It's not a temporary setting, so table columns widths continue to change when you add or remove text in existing cells.
Think of the AutoFit to Window command as “AutoFit to left and right margins.” This option means that the table will remain as wide as the document text itself. If you add text disproportionately to any given column, that column will automatically resize, making the other columns correspondingly narrower. But the table itself will maintain the width of the document text.
Inserting a table based on existing content
As suggested earlier in this book, there is a correspondence between the word tab and the word table. Although the proportion of the word processing population that was raised on typewriters is rapidly dwindling, those who took typing classes learned how to fashion tables using the tab stops and the Tab key. Tab stops are metal hardware on a typewriter that literally stop the carriage when you press the Tab key.
Microsoft knows that tab and table both have the same root. As a result, Word can readily convert your tab-delineated tables into real tables, and it even can convert information delimited with other characters such as commas. If for some reason you want to convert a table back to text, Word can perform that transformation, too.
Converting text to a table
If the text is set up with tabs between the “columns,” you can use the Insert Table command to convert to a table immediately. Select the text, and then in the Tables group of the Insert tab click Table ![]() Insert Table. Word instantly determines how many rows and columns there are and presents your data in a table. Figure 13.6 shows some selected tabbed text, and a copy of that text below converted to a table with the Insert Table command. Word automatically AutoFits the new table to the width of the document, so you might need to resize columns.
Insert Table. Word instantly determines how many rows and columns there are and presents your data in a table. Figure 13.6 shows some selected tabbed text, and a copy of that text below converted to a table with the Insert Table command. Word automatically AutoFits the new table to the width of the document, so you might need to resize columns.
Word easily converts a tabbed “table” into an actual Word table.
To size the columns in the new table to better fit the text, move the mouse pointer over the table, right-click the table move handle, and choose AutoFit ![]() AutoFit to Contents.
AutoFit to Contents.
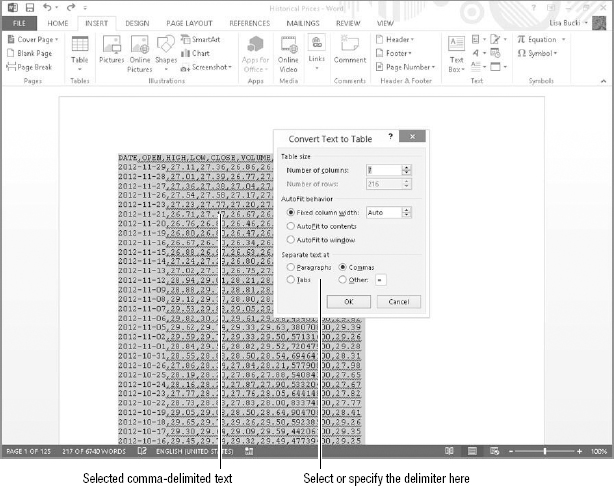
If you want control over the number of rows or columns or have text that's delimited by something other than tabs, you can use the Convert Text to Table dialog box to perform the conversion. For example, you might have a document exported from a spreadsheet or database program as a .csv (comma-separated values) or .txt (plain text) file using delimiters. Or someone may have manually delimited a list with another character, such as an asterisk. Here's how to make sure Word cleanly converts this type of content to a table:
- Select the list of text or data to be converted. You can usually open a comma-separated values file or plain text file directly in Word, but you may have to import other types of files.
- Click Insert
 Tables Table Convert Text to Table. This displays the Convert Text to Table dialog box, shown in Figure 13.7.
 - Adjust the Number of columns or Number of rows settings as needed. These settings will only be active when Word evaluates that there may be more than one way to divide the data.
- Choose an option under AutoFit behavior.
- Specify the proper delimiter under Separate text at. You can choose Paragraphs (for the paragraph mark), Tabs, or Commas; or you can click the Other option and type the custom delimiter character in the accompanying text box.
- Click OK. Word performs the conversion and displays the table.
NOTE
If you opened a .csv or .txt file directly in Word, after you create the table, you'll need to use the Save As command and choose Word Document as the Save as type. If you simply tried to resave the existing file, you'd lose the table formatting, because those file formats don't support it.
The Convert Text to Table dialog box can be a useful diagnostic tool when the simple text to table method presented earlier (Insert ![]() Tables
Tables ![]() Table
Table ![]() Insert Table) yields unexpected results, such as more or fewer columns than you expected. When you get the wrong table dimensions, press Ctrl+Z, investigate the data, make any corrections, and try again.
Insert Table) yields unexpected results, such as more or fewer columns than you expected. When you get the wrong table dimensions, press Ctrl+Z, investigate the data, make any corrections, and try again.
You can get the wrong number of columns if there are too many tabs (sometimes obscured as a result of formatting issues) or if some rows use spaces instead of tabs to achieve the table “look.” Display nonprinting formatting characters by clicking Show/Hide in the Paragraph group of the Home tab. You might, for example, find instances where multiple tabs were typed between columns. This confuses Word, which assumes there are more columns than needed. When this happens dismiss the dialog box, find and remove the extra tabs, and try again. Don't worry about setting a properly aligned tab, because you're converting the tabbed data into a table anyway; the table will handle the alignment for you.
The Convert Text to Table dialog box guesses how many rows and columns you want to create.
Converting tables to text
Sometimes it's necessary or useful to convert an existing table to text. You might want to do this if the data needs to be provided to someone else in a different form. Some statistical programs will accept .csv data, but not Word tables. Or you might simply find it easier to manipulate the data in text form, and then transform it back into a table. Whatever the reason, it's easy:
- Save your document.
- Move the mouse pointer over the table you want to convert, and then click the table move handle when it appears. Word selects the entire table and the Table Tools contextual tabs appear.
- Click the Table Tools Layout contextual tab, and click Convert to Text in the Data group. The Convert Table to Text dialog box appears, as shown in Figure 13.8.
The Convert Table to Text dialog box prompts you to specify a delimiter for text.
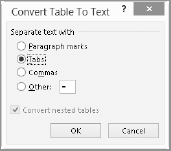
- Choose the desired delimiter, and then click OK. Note that if the table contains nested tables, then the Convert Nested Tables option will be available.
Selecting, copying, and moving in tables
As with plain text in Word, when working with a table you need to be able to make selections so that you can format or manipulate the contents. With a table, it's common to need to select entire columns or rows so that you can apply uniform formatting to them. You also might want to move or copy information in the table, which requires a few special techniques.
Selecting tables, rows, and columns
Word offers multiple techniques for making selections in tables. For example, when you want to select an entire table, you can use one of these quick methods:
- Move the mouse pointer over the table to display the table move handle, and then click it.
- Click anywhere in the table to reveal the Table Tools contextual tabs, shown in Figure 13.9. Click the Layout tab, and then click Select Select Table in the Tables group.
Use the Layout contextual tab to access a number of table selection and manipulation tools.

There is also a keyboard method for selecting tables, but it's a nuisance to remember and to use. With the insertion point anywhere in the table, and Num Lock engaged, press Alt+Shift+5 on the number pad. If Num Lock isn't engaged, press Shift+5 on the number pad instead. You also can click in the table and use KeyTips: press Alt, and then press JLKT, one key at a time. Another method is to use the arrow keys to move the insertion point to the upper-left cell. Press and hold Shift, and use the Down Arrow and Right Arrow keys to extend the selection highlight over all table cells.
Another table selection method involves dragging from outside the table after clicking in the table. Dragging from a location diagonally above and to the left of the table move handle down over the lower-right cell selects the entire table. Or, you can drag from outside the lower-right corner to the upper-left cell until all cells are highlighted.
To select a row without using the Ribbon, move the mouse pointer into the margin to the left of the row until it changes to a right-tilting arrow as shown in Figure 13.10, and click. Drag to expand the selection to include contiguous rows, or Ctrl+click using the Select Row pointer to select additional noncontiguous rows.
To select a column without using the Ribbon, move the mouse pointer just above the column so that it turns into a down-pointing black arrow, and click. Again, drag to expand the selection to include additional contiguous columns, or Ctrl+click to select additional discrete/noncontiguous columns.
You also can use the Select drop-down list in the Table Group of the Table Tools ![]() Layout contextual tab. As shown in Figure 13.9, the menu includes Select Column and Select Row commands that you can choose to select the table column or row that currently holds the insertion point.
Layout contextual tab. As shown in Figure 13.9, the menu includes Select Column and Select Row commands that you can choose to select the table column or row that currently holds the insertion point.
Word's mouse pointer changes shape to indicate what action a click will perform.
Copying table matter
You use the same copy and paste choices to copy a table selection as for regular text. Use Copy and Paste in the Clipboard group of the Home tab, or use the Ctrl+C and Ctrl+V shortcuts.
When copying all or part of a table from one table to another, you need to consider the dimensions of the source and the target. Sometimes when you paste into the new table the whole table is pasted into a single cell rather than individual rows or columns.
As a general rule, when you're pasting table matter the receiving table dimensions should match the source dimensions. If you're trying to paste a 4 × 5 set of cells into a table whose dimensions are 6 × 8, copy the 4 × 5 source to the Clipboard, select the desired 4 × 5 location in the receiving table, and then paste. Pasting without first selecting sometimes works, but sometimes it doesn't. The situation can get even weirder when you're pasting between Word and Excel, so have that Ctrl+Z (Undo) command standing by.
To control what happens with respect to formatting, see the File ![]() Options
Options ![]() Advanced
Advanced ![]() Cut, copy, and paste section. Use the top four pasting options to specify what happens when you paste under a variety of circumstances. If necessary, temporarily enable the desired behavior, perform the paste, and then go back to reset the defaults.
Cut, copy, and paste section. Use the top four pasting options to specify what happens when you paste under a variety of circumstances. If necessary, temporarily enable the desired behavior, perform the paste, and then go back to reset the defaults.
Moving and copying columns
To move one or more adjacent columns within a table, select them and then drag to the desired column. Release the mouse button anywhere in the destination column. The selected column(s) will move to the position of the destination column, which will scoot to the right. To move one or more selected columns to the right of the rightmost column, drop the selection at what appears to be outside the right edge of the table. As shown in Figure 13.11, when you have nonprinting characters displayed, cell markers also appear to the right of the table's right boundary. When moving columns to the right side of the table, drop them on those exterior markers.
Drag to the right of the cell markers outside the table to move a column there.
To copy one or more columns, hold the Ctrl key as you drop. The selection will be inserted at the drop point, using the same location rules that apply when you're moving columns.
When moving a column between tables, it's probably easier to use the Cut and Paste commands in the Clipboard group of the Home tab (or use Ctrl+X and Ctrl+V).
Moving and copying rows
You can move and copy rows in the same way as columns, except with respect to the last row. The last row does not have exterior cell markers. If you drop a selection of one or more rows onto the last row of a table, the selection will be placed above the last row. If you drop it after the last row, the selection will be appended to the table, but the formatting will often change.
Instead, when you want to move rows after the last current row, drop them on the last row. Then put the insertion point anywhere in the last row and press Alt+Shift+Up Arrow to move the stubborn last row up to where you want it.
TIP
Any time you want to move table rows around, Alt+Shift+Up Arrow and Alt+Shift+Down Arrow can be used to push the current row up or down in the table. If you're moving a single row you don't need to select anything. If you're moving multiple contiguous rows, select them first.
Changing table properties
If you need to set precise table settings, click Properties in the Table group of the Table Tools ![]() Layout contextual tab, or right-click a table and choose Table Properties to display the dialog box shown in Figure 13.12. Use the Table tab to control overall layout and behavior; use the other tabs or the mouse to control row, column, and cell characteristics.
Layout contextual tab, or right-click a table and choose Table Properties to display the dialog box shown in Figure 13.12. Use the Table tab to control overall layout and behavior; use the other tabs or the mouse to control row, column, and cell characteristics.
Use Table Properties to control overall alignment, indentation, and positioning of tables.

Preferred width
Check Preferred width and enter a measurement in the accompanying text box to set a target width for the table. The preferred width can't be absolute, however, because tables contain text and data, and are further constrained by paper and margin settings. Note that AutoFit settings override the Preferred width.
Alignment
Table alignment affects the entire table with respect to the current left and right margins. If the table extends from the left margin to the right margin, which is the default for tables inserted in Word, then the alignment controls seemingly will have no effect. This makes it easy not to notice if they're changed. If you later narrow the table, its placement on the page might suddenly seem askew. You can be sure you're centering a table by choosing Center under Alignment on the Table tab of the Table Properties dialog box.
The Indent from left setting on the tab controls how far the table is from the left margin. There is no Ribbon control for this setting, and it cannot be set with the ruler line.
Note that Indent from left is available only when Text wrapping is set to None and Alignment is set to Left. When Around text wrapping is enabled, use Positioning to set the distance from the left, as shown in the section that follows.
Text wrapping and moving a table
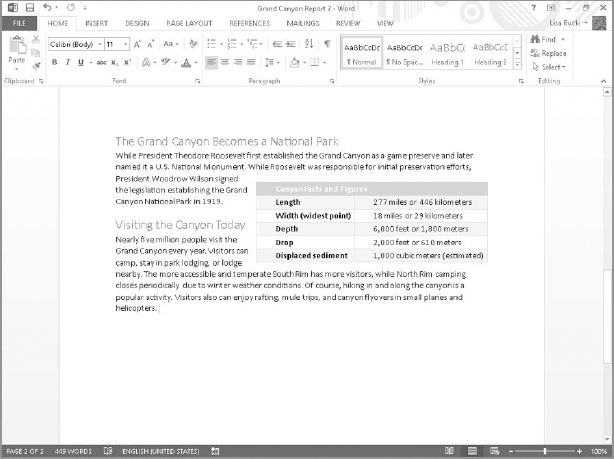
You can insert a table inline with other text, or if it is smaller than the full document width, you can move or drag it into position so that text outside the table wraps around it, as shown in Figure 13.13. To have this flexibility, change the Text wrapping setting in the Table tab of the Table Properties dialog box to Around. Dragging a table into a new position using the table move handle automatically changes the Text wrapping setting from None to Around.
Wrap text around tables for a more integrated appearance.
Clicking the Positioning button opens a Table Positioning dialog box. You can choose Horizontal and Vertical Position settings, and set the Distance from surrounding text for each side of the table. The Move with Text option controls whether the table's vertical position is governed by the paragraph to which it is anchored. If Move with Text is enabled, the vertical position can be relative to only paragraph. Use this setting if the paragraph's content and the table's content are interrelated so that the table would not make sense except when near that paragraph. This often is the setting you want for research reports.
Turn off Move with Text if the location of the table is not logically tied to a particular paragraph. This setting might be more in keeping with the design of a brochure or a newsletter in which the table's contents are relevant to the entire document and should appear in a particular location for aesthetic reasons.
TIP
When you paste a table with Ctrl+V or the Paste button in the Clipboard group of the Home tab, you can click the Paste Options button and choose a format for the pasted table.
Sizing a table, row, or column
Word tables feature several kinds of handles and mouse pointers that enable you to manipulate and select cells, rows, columns, and entire tables, for example:
- If you point to the lower-right corner of a table, the mouse pointer changes to a two-headed diagonal arrow. Drag it to resize the table.
- If you point to the bottom gridline or border for a table row, the mouse pointer changes to a resizing pointer, with a double black horizontal bar and up and down arrows. Drag when you see that pointer to resize the row height. Resizing rows is not usually necessary, because they will automatically change height when you change the font size for the text in the row.
- If you point to the right gridline or border for a table column, the mouse pointer changes to a resizing pointer, with a double black vertical bar and left and right arrows. Drag when you see that pointer to resize the column width.
TIP
Double-click the right column border with the resizing pointer to automatically fit the column width to its contents.
In other instances, you might need to be more precise about row and column sizes. For example, if you have a document such as an annual report or a product quality testing report, it's desirable to make column widths fairly consistent to make the report look more orderly. When that's the case, you can use the Row and Column tabs in the Table Properties dialog box to change the size for the selected row or column:
- Row tab: Leave Specify height checked, and enter a size in the accompanying text box. If you want to make the size more permanent, change the Row height is setting from At least to Exactly. Use the Previous Row and Next Row buttons to move to other rows to format, and click OK when done.
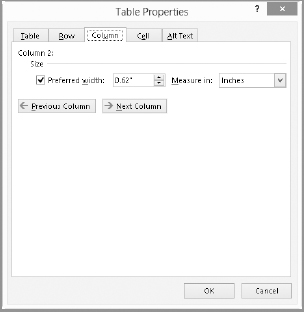
- Column tab: Leave Preferred width checked and enter a specific width (Figure 13.14). Use the Previous Column and Next Column buttons to choose the settings for other columns as desired, and click OK when finished.
Enter precise row and column heights on the Row and Column tabs.
Working with Table Layout and Design
Word 2013's Table Tools ![]() Design and Layout contextual tabs provide you with most of what you need to create tables that are both aesthetically appealing and functional. The Design tab tools enable you to improve the table's appearance. The tools on the Layout tab help you ensure that the table presents information in a logical way that is meaningful to the reader.
Design and Layout contextual tabs provide you with most of what you need to create tables that are both aesthetically appealing and functional. The Design tab tools enable you to improve the table's appearance. The tools on the Layout tab help you ensure that the table presents information in a logical way that is meaningful to the reader.
So far we've looked at a number of basic tools that help you achieve the right structure for your tables. In this section we're going to look at how to mold tables into shape and then polish them for your audience.
NOTE
Many of the Ribbon commands described in this section are also available in the right-click shortcut menu.
Modifying table layout
We all know that situations, ideas, and data change. Let's look at how to cope with changes that impact the structure of data in a table.
All references to the Layout tab in this section refer to the Table Tools ![]() Layout contextual tab to keep the descriptions brief. None of the Layout tab tools provide Live Preview, so carefully review the impact of any layout change and use Ctrl+Z to undo a change immediately if it doesn't have the desired impact.
Layout contextual tab to keep the descriptions brief. None of the Layout tab tools provide Live Preview, so carefully review the impact of any layout change and use Ctrl+Z to undo a change immediately if it doesn't have the desired impact.
Deleting table, row, column, and cell contents
Sometimes you need to trim your tables by deleting rows or columns. Sometimes you have to delete the entire table, which is one of Word's less intuitive processes. If you select a table and press the Delete key, the data inside the table is deleted, but the table rows and columns remain. The same thing sometimes happens when you try to delete a cell, a row, or a column.
TIP
If the table is part of a larger selection of text with text both above and below the table selected, then pressing Delete does remove the table as well as the additionally selected text.
Rather than say this a half dozen times, let's just say it once. If you want to remove the contents of a cell, row, column, or table, select what you want to remove and press the Delete key. In the sections that follow we'll be looking at table structure, not contents.
Deleting a table
You can use any of the following methods to delete an entire table:
- Click anywhere in the table and in the Layout tab click Delete in the Rows & Columns group and click Delete Table, as shown in Figure 13.15. Word deletes the table immediately.
Delete the current cell, column, row, or table using the Layout tab's Delete menu.
- Move the mouse pointer over the table, right-click the table move handle, and then click Cut.
- Select the table using the method of your choice, and then press Backspace.

Deleting rows, columns, and cells
To delete the current row or column, use techniques similar to deleting the table. Select the row(s), column(s), or cell(s) and press Backspace, or choose Layout ![]() Delete
Delete ![]() Delete Rows; Layout
Delete Rows; Layout ![]() Delete
Delete ![]() Columns; or Layout
Columns; or Layout ![]() Delete
Delete ![]() Cells.
Cells.
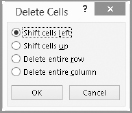
When deleting cells, Word needs a little more information. The Delete Cells dialog box shown in Figure 13.16 prompts you to specify how to shift remaining cells, or whether you in fact really mean to delete the row or column. Make your selection and click OK.
Word prompts to find out how to handle the rest of the column or row when you delete a single cell.
Inserting rows, columns, and cells
To insert a row or column into a table, click in the row or column adjacent to where you want to insert, and then click Insert Above, Insert Below, Insert Left, or Insert Right in the Rows & Columns group of the Layout tab (refer to Figure 13.15), depending on where you want the new row or column to appear.
TIP
To add a new row to the end of an existing table, place the insertion point at the end of the entry in the bottom-right cell and press the Tab key. To add a new interior row, click outside the right side of the table above where you want the new row to appear, and press Enter.
To insert multiple rows or columns you have a couple of options. Select the number of rows or columns you want to insert, and then click the appropriate insert tool. Word will insert as many rows or columns as you have selected.
Word 2013 also includes a new method for inserting one or more rows or columns. Just select the number of rows or columns to insert with the mouse, and then move the mouse pointer to the side of the selection where you want to insert the new rows or columns. As shown in Figure 13.17, a divider with a plus button appears. Click the plus to insert the specified number of rows or columns at the divider. In the example in Figure 13.17, because two columns are selected and the divider is to the right of the selection, clicking the plus would insert two new columns to the right of the selection.
Click the plus button that appears to insert new rows or columns in the specified position.
To insert cells, select the cell(s) adjacent to where you want the new one(s) to appear, and click the dialog box launcher in the bottom-right corner of the Rows & Columns group in the Layout tab. You'll see a dialog box containing the identical options shown in Figure 13.16. Choose your desired action and click OK.
Controlling how tables break
Sometimes you don't particularly care how tables break across pages, but sometimes you do. When you need to keep certain rows together on a page:
- Select the rows in question.
- Click Properties in the Table group of the Layout tab (or right-click the selection and choose Table Properties from the shortcut menu).
- Click the Row tab, and under Options uncheck the Allow row to break across pages check box.
- Click OK.
To force a table to break at a particular point, move the insertion point to anywhere in the row where you want the break to occur, and then press Ctrl+Enter. Note that this doesn't simply force the table to break at that point; it actually breaks the table into two tables. If the Repeat as header row at the top of each page setting on the Row tab of the Table Properties dialog box is enabled for the first row(s) of the original table, it won't be inherited by the “new” table. You'll have to copy the heading row to the new table and reinstate the setting, if needed.
Merging table cells
Sometimes you need to merge columns, rows, or cells. For example, it's common to merge the cells in the top row of a table to create one larger cell to hold a title for the table. Merging cells is easy. Select the cells you want to merge and click Merge Cells in the Merge group of the Layout tab (refer to Figure 13.15).
TIP
You also can use the table eraser in the Layout tab's Draw group. Click the Eraser tool, and then click on the table gridline or border segment to remove. To turn the eraser off, click its Ribbon button again, or press the Esc key.
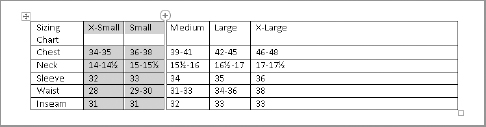
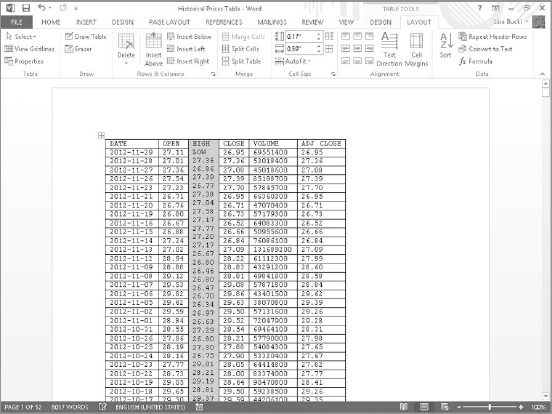
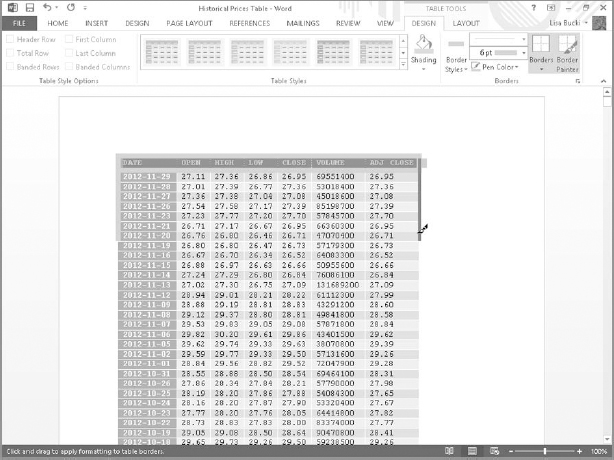
Word can't really merge rows or columns. Suppose you need to merge the cells from two columns into a single column on each row. What you want to end up with is the same number of rows with one less column. If you select both columns and click Merge Cells, however, Word treats that as a request to merge all the cells in the selection, and you end up with one big cell with the entries jumbled together. This is illustrated in Figure 13.18. The HIGH and LOW columns were merged, resulting in one big cell of useless data. There is no way around this. To get the desired result, you would have to select the HIGH and LOW column entries on each row and merge them individually.
Word cannot merge into multiple cells.
NOTE
If you are also an Excel user, you could use Excel to merge columns of data as in the previous example. Excel has functions that enable you to join text from two separate cells into a single entry.
Splitting cells, rows, and columns
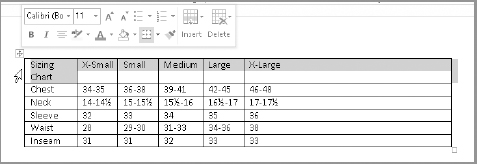
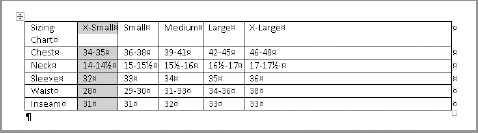
At first it seemed that one cell, row, or column was fine, but later you decide that the logic of the table layout calls for two (or more) cells where there once was one If you split a cell that holds text, the text will remain in the left or upper-left cell in the split group. In Figure 13.19, the cell with X-Large in it was split into three cells, as illustrated by the settings in the Split Cells dialog box.
When you split cells, specify how many rows and columns you want to create.
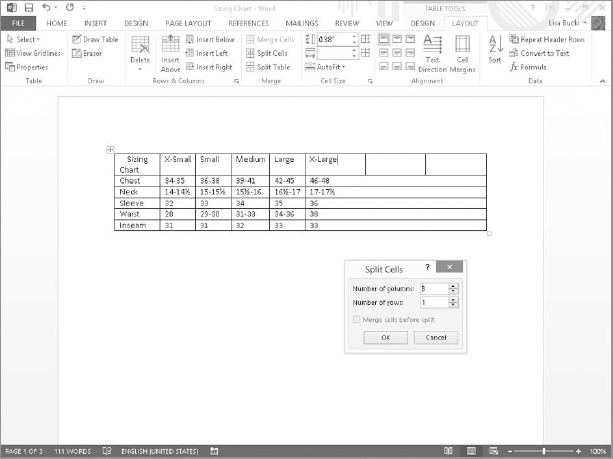
To perform a split, select the cell(s) to split, click Split cells in the Merge group of the Layout tab, make Number of columns and Number of rows entries as needed in the Split Cells dialog box, and click OK.
Horizontal splits or splits where you start by selecting multiple rows or columns are often harder to control. The trick is to make sure that items are horizontally displayed and separated either by at least two spaces or by a tab (press Ctrl+Tab to insert a tab inside a table). It can still be tedious, but it's a bit more direct than using the dialog box, and you have more control and precision.
Cell size
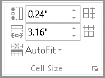
When you're using a table to lay out a fill-in form, cell measurements sometimes have to be precise, especially when you're trying to align a Word document with preprinted forms. When cell height and width need to be controlled precisely, click the Table Row Height or Table Column Width boxes in the Cell Size group on the Layout tab, shown in Figure 13.20. Note that cell height cannot vary for any cell within any given row.
Use the Cell Size group on the Layout tab to specify the precise height and width of rows and columns.
When you need rows to have a uniform height, click the Distribute Rows button to the right of the Table Row Height text box. If rows are of different heights—as sometimes happens when you're converting part of an Excel spreadsheet into a Word table—this command determines the optimal height and equalizes the height of all selected rows or of all rows in the table if no rows are selected.
Similarly, click Distribute Columns (found to the right of the Table Column Width text box) to set selected or all columns to the same width. If different rows have different widths, this command will not equalize the whole table. It works only when all the rows have the same width. If any differ (for example, if row two is 4 inches and all the other rows are 3.5 inches, giving the table a ragged left and/or right edge), it won't equalize them all. To remedy this, drag the right border(s) of shorter or longer rows so that they all align on the left and right.
Alignment
The Alignment group of the Layout tab offers nine cell alignment options, as shown at the left in Figure 13.21. To change how the contents align horizontally or vertically within any cell, click in or select the cells you want to change, and then click the desired tool. As noted elsewhere, many users confuse cell alignment with table alignment. With the whole table selected, this tool will at most set the individual alignment of each cell and won't have any effect on table alignment. Instead, select the whole table and use the Paragraph group alignment tools in the Home tab, or use the Alignment setting in the Table Properties dialog box.
Word offers nine options for cell alignment, as well as the ability to change text direction and cell margins.
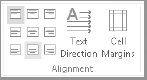
Text direction
To control text direction in selected table cells, click the Text Direction tool in the Alignment group of the Layout tab. This command toggles the text between the normal horizontal layout, to text vertically aligned at the right side of the cell, to text vertically aligned at the left side of the cell. For example, you may prefer to change to one of the vertical alignments when the titles in the top row of the table are wider than the rest of the entries in the column and you're having trouble fitting the table horizontally on the page. Formatting the titles vertically would enable you to make the columns narrower to better fit the table on the page.
Cell margins and cell spacing
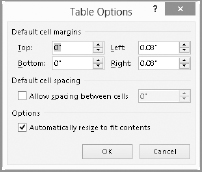
Word provides several kinds of controls for cell margins. Cell margin is the distance between cell contents and cell walls. Proper margins can keep cells from becoming too crowded and unreadable. Additional spacing can also prevent data from printing over the borders when you're using a table to format data for printing on preprinted forms. To set cell margins and cell spacing, click Cell Margins in the Alignment group of the Layout tab, shown in Figure 13.21. This displays the Table Options dialog box shown in Figure 13.22.
Despite the name of the Default cell margins section of the dialog box, it does not set the default cell margins or spacing for tables. It sets the cell margins only for the currently selected table, and the settings you enter apply to all cells in the table.
The Allow spacing between cells setting under Default cell spacing in the Table Options dialog box can be used to create the effect shown in Figure 13.23. This gives the table the appearance of having a distinct box inside each table cell.
If your table is too crowded, increase the default cell margins.
Cell spacing can give tables a dramatic appearance.

Tables that span multiple pages
When a table spans multiple pages, Word can automatically repeat one or more heading rows to make the table more manageable. When the need arises, select the target table's heading rows (you can have multiple heading rows), and click Repeat Heading Rows in the Data group of the Layout tab. The selected heading rows are then repeated where necessary. The setting can be toggled on or off for each individual table. Because the number of heading rows can vary, this setting cannot be made the default for all tables, nor incorporated into a style definition.
NOTE
If you are preparing a document for the Web and working in Web Layout view, the Repeat Heading rows command has no effect, because web pages are seamless and do not have page breaks in concept.
Sorting table rows
Word provides a flexible and fast way to sort data in tables. To sort a table, select the first column (field) to sort by, and click the Sort button in the Data group of the Layout tab. Word displays the Sort dialog box, shown in Figure 13.24. If the table has headings in the first row at the top of each column, selecting the Header Row option under My list has does two things. First, it provides labels in the Sort by and Then by drop-down lists. Second, it excludes the header row from the sort.
The Sort command lets you sort by up to three fields.
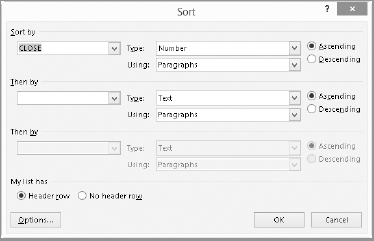
If you did not select a column before opening the Sort dialog box, select the first sort field from the Sort by drop-down list. Open the Type drop-down list and click Text, Number, or Date to match up with the type of data stored in the sort column. Choose Ascending or Descending depending on whether you want to sort from A to Z or lowest to highest or most recent to least recent—or vice versa for any of those. To sort by additional fields, open the two Then by drop-down lists and click a field name to include up to two of them, and set the additional type and sort order settings. Click Options to determine additional settings, including how fields are delimited (for non-table sorts), whether to make the sort case-sensitive, and the sorting language. Click OK to close Sort Options, and then click OK to apply the sort.
Adding table calculations
Word can perform some calculations using the Formula button in the Data group of the Layout tab (refer to Figure 13.19). To use it, first create a cell or row where you want to include formulas, and then select the first cell in which to enter a formula. Note that you only can select multiple cells when the formula will be the same in each one, such as summing all the cells above the selection. Click Formula in the Data group of the Layout tab. Edit the contents of the Formula text box. Or you can click to the right of the equals sign (=) in the Formula text, box and use the Paste function drop-down list to paste in one of the predefined functions and indicate what cells to calculate between the parentheses. If needed, choose a format from the Number format drop-down list; the selection shown in Figure 13.25 formats the number with two decimal places. Click OK to insert the formula in the cell.
These Formula settings calculate an average and set it to display with two decimal places.

As with Excel, you also can use “cell addresses” to specify which cells to calculate on in a table; the column is column A, and the first row is row 1. Unfortunately, even if you do so, you cannot copy or fill formulas across a row or down a column; you have to insert a new formula in each individual table cell, or copy a formula with Excel-style cell addressing and then edit the field and change the cell addresses. If you use Word for math, double-check all calculations using a calculator or Excel. But if you have Excel and you need complex math in tables, then use Excel. You can then link the results to Word. That being said, here are a few more formula examples to give you ideas of how you might use formulas in your own tables:
- Let's say you work as a freelance personal assistant and want to create an invoice that calculates your billing based on various rates you charge for various tasks. You create a table with four columns and enter Task, Hours, Rate, and Item Total in the top row. In the second row you enter Filing, 3.25, and 10 in the first three cells. You then click in the fourth cell of the second row and display the Formula dialog box (Layout contextual tab, click Formula in the Data group). Edit the Formula text box entry to read =B2*C2, because you want to multiply the values in the second and third columns (Hours times Rate) to get the Item Total for the row. Choose a format with the dollar sign and two decimals from the Number format drop-down list, and click OK. The correct total of $32.50 displays for that row. In the next row, you could enter the next Task, Hours, and Rate values, and then use the Formula dialog box to create a formula in the fourth column that calculates =B3*C3, incrementing the row number in the formula for each new row. Then, to create an overall total in the final row, you can enter Total in the third column, and in the fourth column use the Formula dialog box to enter an =SUM(ABOVE) formula, formatted as currency like the formulas above it.
- If you're coaching a little league basketball team, you could create table to calculate quick stats. For example, if you've created a table to track how many points each player scores in each game, you could add a column at the far right and use the Formula dialog box to enter an =AVERAGE(LEFT) formula with the 0.00 Number format choice to average the scores. (The formula dialog box will likely suggest the =SUM(LEFT) formula; edit to replace SUM with AVERAGE.) In this case, because the formula does not refer to specific cells, you can copy and paste it down the column as needed, and then update the table to make sure all the formulas recalculate. (See the Note below.)
- You could make your little league basketball table more fancy by finding the high player score for each game. Add two rows at the bottom of the table, labeling them High and Low in the first column, respectively. Then, in the High row, use the Formula dialog box and the MAX function to create an =MAX(ABOVE) formula for each column. Calculating the low score is trickier, because you have to skip the High row. In each cell of the low row, use MIN function to find the low player scores by specifying a range of cells within the parentheses. For example, if the player scores are in rows 2-10 and the High scores are in row 11, the first formula in the second column of the Low row (row 12) would be =MIN(B2:B10), the formula in the next column of the row would be =MIN(C2:C10), and so on.
Those are just a few simple examples, and as you might imagine if you've done any work with Excel, you can create more complicated formulas in Word by using parentheses to group multiple functions and calculations. To redisplay the Formula dialog box to edit a calculation, click in the calculation so you see gray shading behind it. And use Layout ![]() Data
Data ![]() Formula to redisplay it.
Formula to redisplay it.
NOTE
If you change the values that a table is using to perform calculations, then you will need to recalculate the table. The table formulas are inserted as fields, and unlike the formulas in Excel, they do not recalculate automatically. The safest way to ensure that a table's calculations are up to date is to click a table cell, click the table move handle to select the whole table, and then press F9. Chapter 23, “Automating Document Content with Fields,” teaches you more about fields, such as how to display field codes so that you can manually edit the field, a trick that may come in handy with table formulas.
Modifying table design
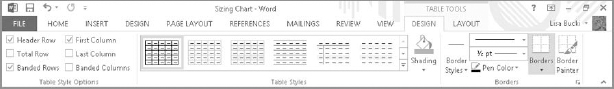
Word 2013 provides a number of powerful tools to help you quickly enhance the look and feel of your tables. One of these tools, Table Styles, features Live Preview. In this section we'll look only at the features contained in the Table Tools ![]() Design contextual tab, shown in Figure 13.26.
Design contextual tab, shown in Figure 13.26.
The Design contextual tab provides access to six Table Style Options and a gallery of Table Styles.
Applying a table style
Word 2013's refreshed and updated preset table styles enable you to change the look of any table with just a few clicks. Table styles provide a wide variety of formatting that you can preview live in your table. You can use styles to ensure a consistent, professional look when you include multiple tables within a single document. You can also modify a table style and save the modified versions for later use.
To apply a table style, click anywhere in the table to format, and then click the Table Tools ![]() Design contextual tab (from here referred to as the Design tab for simplicity. In Table Styles, hover the mouse over various styles and observe the changes to your table. As you move the mouse, tooltips display the name of the selected table style (such as Plain Table 1), as shown in Figure 13.27.
Design contextual tab (from here referred to as the Design tab for simplicity. In Table Styles, hover the mouse over various styles and observe the changes to your table. As you move the mouse, tooltips display the name of the selected table style (such as Plain Table 1), as shown in Figure 13.27.
As you move the mouse over various table styles, the currently selected table displays a Live Preview of the formatting.
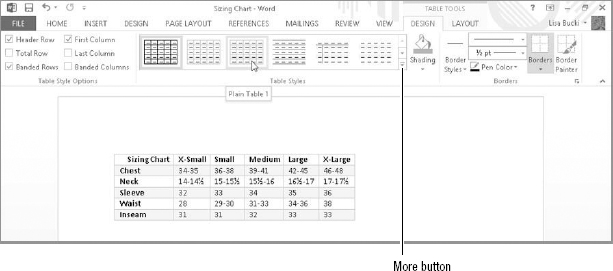
If you see a style you like, click it to apply it to your table. If it's not perfect you can modify it. If you don't see a style you like, click the More button to the right of the table styles. Word displays the full Table Styles gallery, showing Plain Tables, Grid Tables, and (if you scroll down) List Tables categories of table styles, as shown in Figure 13.28. Move the mouse pointer over additional styles to preview their look on your table, and then click the style to apply. Note that you can click Clear near the bottom of the gallery to remove a previously applied table style.
Choosing table style options
The Table Style Options group at the left end of the Design tab provides access to six options, shown in Figure 13.26, that you can apply to your table. For some of these to work, you have to apply a table style that includes shading rather than trying to use them with the plain Table Grid style that is the default for newly inserted tables. After you apply an overall table style, click to check to apply Table Style Options to your tables, or remove checks to turn the corresponding features off:
- Header Row: Applies special formatting to the entire top row in your table.
- First Column: Applies special formatting to the entire first column.
- Total Row: Applies special formatting to the last row, generally a double border above the row as for traditional accounting formatting for numeric totals. The formatting may be omitted for the first cell.
- Last Column: Applies special formatting to the last column, except for the top cell.
- Banded Rows: Alternates shading in rows to create a horizontal striping effect. This helps the reader focus on specific rows.
- Banded Columns: Alternates shading in columns to create vertical stripes, focusing the reader on columnar comparisons.
The Table Styles gallery enables you to test-drive dozens of built-in table styles.

Shading cells
You can apply shading (a background fill color) to individual cells, rows, columns, or to a complete table. You can use shading sometimes to draw attention to one or more elements of a table. For example, if you added a row with calculated averages to the bottom of a table, you might want to call attention to that data with special shading. It's also common to use shading to set off a title row or column.
Select the cells, rows, or columns to shade, and then click Shading in the Table Styles group of the Design tab. Live Preview works with the Shading gallery, as shown in Figure 13.29. Move the mouse pointer over a color to preview it on the selection, and then click when you're ready to apply a color. Figure 13.29 shows light shading applied to the left column of a table, with darker shading being previewed in the top row. Note that when you apply Theme Colors as your shading choices, those colors automatically update whenever you apply a new theme to the document. Use the More Colors command to apply colors that won't change when you change the theme.
Live Preview works with the Shading choices.

TIP
You also can use the Shading button in the Paragraph group of the Home tab to apply shading.
Modifying and saving a table style
To modify the table style applied to the selected table:
- Open the Table Styles gallery and click Modify Table Style near the bottom the gallery. The Modify Style dialog box shown in Figure 13.30 appears.
- Type or edit the name in the Name text box if you want to rename the style. You can use the Modify Style dialog box to apply style formatting, as described in Chapter 7, “Using Styles to Create a Great Looking Document.”
Use the Modify Style dialog box to make changes to a table style.
- Open the Apply formatting to drop-down list and choose the part of the table for which you want to change formatting.
- Use the formatting choices above the preview to format the selected item.
- Repeat Steps 3 and 4 to change additional parts of the style.
- Check an option to store the style Only in this document or in New documents based on this template.
- Click OK.

If you want to create a new style rather than modify one of the existing ones—which is a good choice when you want to keep all the original table styles intact—click the New Table Style choice at the bottom of the Table Styles gallery. The Create New Style from Formatting dialog box that appears has the same settings as those in the Modify Style dialog box shown in Figure 13.30. Enter a table Name, and then open the Style based on drop-down list to choose an existing table style to serve as the model or base for your new style. Make formatting adjustments as described in Steps 3 and 4 here, choose where to store the file, and then click OK to finish creating your new style. The new style will appear in a category named Custom at the top of the Table Styles gallery.
NOTE
You can delete a style that you've created from the Table Styles gallery. Right-click the style thumbnail and click Delete Table Style. Click Yes in the message box that appears to confirm the deletion.
Borders and table drawing (border styles, border painter)
Border lines separate a table into cells, rows, and columns. You've seen in other chapters that borders are not unique to tables, and can be applied to characters and paragraphs as well. They also can be applied to other Word document elements, such as text boxes, frames, and graphics. Any of the border tools can be used to control borders in tables. None of the border tools offer Live Preview, although the Borders and Shading dialog box does provide a generic preview.
You have two strategies for working with borders. You can launch the Borders and Shading dialog box. For a detailed description of how to apply borders using the Borders and Shading dialog box, see the “Borders and boxes” section in Chapter 6, “Paragraph Formatting.”
The second strategy uses an ad hoc approach, by using the Border Styles, Line Style, Line Weight, Pen Color, and Borders tools in the Design tab, shown in Figure 13.31. Use the border formatting tools together to change borders:
Use the Borders Styles tool and its friends to make ad hoc changes to table borders.

- Select the cells, rows, or columns to which you want to apply borders.
- In the Borders group of the Design contextual tab, choose the settings you want from the Line Style, Line Weight, and Pen Color drop-downs; or click the Border Styles button and click a border style in the gallery.
- Click the Borders button down arrow, and then click to specify where you'd like to apply the borders. Click Outside Borders to put borders all around the selection, for example.
Once you've applied a border style you like to selected cells, you can use Word 2013's new Border Painter tool to copy it to other selections, as shown in Figure 13.32. Click Border Painter, and then drag the painter mouse pointer to apply the specified border to cell, row, and column boundaries. Press Esc to turn the Border Painter off when finished.
TIP
Remember that if you remove all table borders, you may want to turn on table gridlines so that you can see cell boundaries. The View Gridlines setting is in the Table group of the Table Tools Layout tab.
When the Border Painter is active, drag to copy border settings to other table locations.
Using the table eraser
The table eraser removes parts of tables. It doesn't merely remove border lines; it deletes the cell boundaries in a table where you specify. You can use the table eraser to turn interior cells into a larger interior cell. Be careful, though. If you try to delete a table's upper-left cell, you might instead delete the whole top row of the table.
To use the table eraser, click in a table and then click Eraser in the Draw group of the Table Tools ![]() Layout tab. Click on cell boundaries to remove as needed. (Remember to press Ctrl+Z immediately if you inadvertently click the wrong border.) To dismiss the eraser, either click the Eraser tool again to toggle it off, or press Esc. The eraser also deactivates if you click outside a table (in regular text).
Layout tab. Click on cell boundaries to remove as needed. (Remember to press Ctrl+Z immediately if you inadvertently click the wrong border.) To dismiss the eraser, either click the Eraser tool again to toggle it off, or press Esc. The eraser also deactivates if you click outside a table (in regular text).
Inserting SmartArt
SmartArt provides you with a much wider selection of diagrams to illustrate processes, relationships, organizational hierarchies, and more. SmartArt also features 3-D formatting that's so dimensional it looks like it took hours for a graphic artist to create it.
NOTE
SmartArt, introduced in Word 2007, replaced the Insert Diagram and Insert Organization Chart features of Word 2003 (and earlier).
Here are the basic steps for inserting SmartArt. I'll elaborate on some of the details after the steps:
- Click to position the insertion point at the location where you want to insert SmartArt.
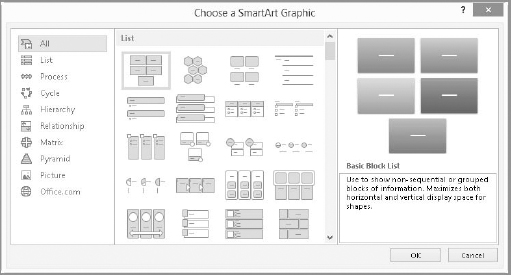
- Click the Insert tab on the Ribbon, and click SmartArt in the Illustrations group. The Choose a SmartArt Graphic dialog box shown in Figure 13.33 appears. It lists eight categories, plus All, which enables you to peruse all the graphic types.
- Click a category, and then click one of the graphic thumbnails that appears. A larger preview and description appear at the right.
- When you find a graphic that looks appropriate, either double-click it or click it and then click OK. Word inserts the shape into your document with the text pane ready to accept information, as shown in Figure 13.34.
Word features more than 160 SmartArt gallery items divided into eight categories.
Enter text to appear in the various shapes in a SmartArt graphic.
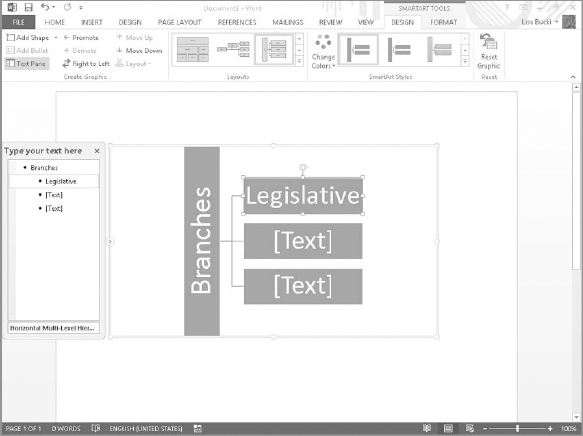
- Click each [Text] placeholder in the text pane at the left. As you type, the text appears in the corresponding SmartArt shape on the right.
- Click outside the graphic when you finish working with it.
There are a variety of ways to enter and format text in the text pane. The following list, though not exhaustive, offers a number of methods that work. Note that some actions can also be performed via the Create Graphic group in the SmartArt Tools ![]() Design tab.
Design tab.
- To move to the next item, press the down arrow. Use the other arrow keys to navigate in the text entry box as well.
- To add a new item to the list, press Enter, either at the end of the list of items or above an existing item.
- To demote the current item, if possible, press the Tab key.
- To promote the current item, press Shift+Tab.
- To delete an item, select it and press the Backspace key.
- To change the font for an item, select the text you want to change, mouse over the selection, and use the Mini Toolbar (see Figure 13.35).
- You can also enter text directly, without using the text pane. Click in the SmartArt item and type.
- The text pane can be moved and resized if it's in the way: Drag it to a more convenient location or drag any of the four sides to resize the text area.
Note that basic paragraph and character formatting can be applied to SmartArt shapes. Indents, bullets, and numbering cannot be applied, nor can styles. You can assign a style to the overall diagram; however, effects are limited unless the SmartArt item is In line with text. To change the font used in all the text in a SmartArt object, display the text pane, click in it, press Ctrl+A to select the contents of the text area, and then right-click and set the desired font.
You also can format text in the text pane or use the Design contextual tab to work with shapes and layouts.

Changing layout, style, and colors
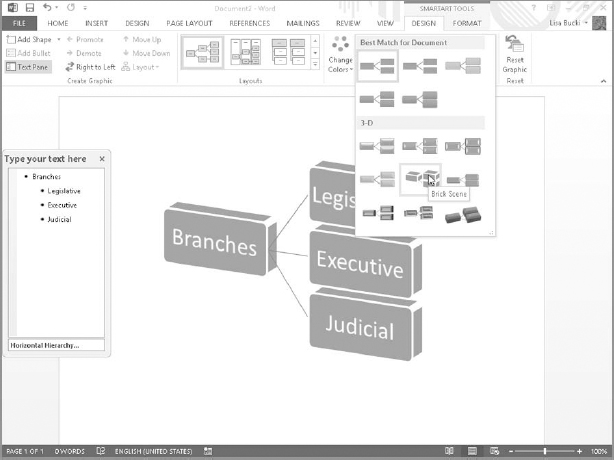
You can change a SmartArt diagram's overall layout, colors, and style at any time using the tools in the Layouts and SmartArt Styles groups of the SmartArt Tools ![]() Design contextual tab. Select the SmartArt graphic by clicking it, and use the Layouts Gallery, shown in Figure 13.36, to choose a different layout. Note that the gallery works with Live Preview. You aren't limited to applying the same class (List, Hierarchy, Process, Cycle,) of layout, either. SmartArt will adapt the different designs using the relationship levels currently applied.
Design contextual tab. Select the SmartArt graphic by clicking it, and use the Layouts Gallery, shown in Figure 13.36, to choose a different layout. Note that the gallery works with Live Preview. You aren't limited to applying the same class (List, Hierarchy, Process, Cycle,) of layout, either. SmartArt will adapt the different designs using the relationship levels currently applied.
You can apply any layout to any SmartArt list.

SmartArt Styles enable you to apply a variety of preset formatting to the selected SmartArt diagram. Click the More button to open the gallery and point to any choice—again, Live Preview helps you to make a selection. As shown in the example in Figure 13.37, the styles offer both 2-D and 3-D options, as well as a variety of sophisticated surface treatments.
Open the Change Colors gallery beside the SmartArt styles to preview and select from a variety of color schemes you can apply to the selected SmartArt graphic.
NOTE
When the entire SmartArt graphic is selected, a Layout Options button appears at the right. Click it and then click the setting to use to wrap text around the graphic. Chapter 14, “Adding Pictures and WordArt to Highlight Information,” will explain more about wrapping text around various objects in Word.
The SmartArt Styles gallery gives you choices for updating the look of the selected SmartArt graphic.
Adding a shape
You have to add and remove shapes in a SmartArt graphic to control the content that appears. You can do so in the text pane as noted earlier. Or you can click the SmartArt diagram to select it, click a shape within the diagram to which the new shape will relate, and then click the Add Shape drop-down list arrow in the Create Graphic group of the Design tab. The choices that appear are Add Shape After, Add Shape Before, Add Shape Above, and Add Shape Below. (Depending on the nature and position of the shape you initially selected, not all of these choices may be active.) Click the desired shape location, and then type the text for the new shape. You also can right-click a shape and use the Add Shape submenu of the shortcut menu to insert a shape.
TIP
If you have a list–hierarchical or not–that you would like to convert into a SmartArt object, select the list and copy it to the Clipboard before choosing the SmartArt tool. Once your SmartArt object appears, click in the text pane. Press Ctrl+A to select the placeholder list, and then press Ctrl+V to paste the list over the placeholder.
Changing shape styles and other formatting
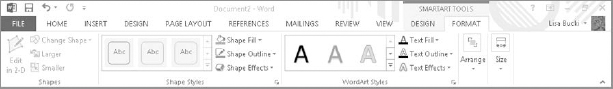
SmartArt provides a number of additional tools for formatting individual shapes within a selected SmartArt object. After clicking the SmartArt diagram, click a shape to select it, and then use the applicable tools in the SmartArt Tools ![]() Format tab, shown in Figure 13.38.
Format tab, shown in Figure 13.38.
Formatting tools are found in the Shapes, Shape Styles, and WordArt Styles groups of the Format tab.
Use the Shapes group tools as follows:
- Edit in 2-D: When you click a shape, a 2-D version appears for more direct editing.
- Change Shape: Change the selected shape into any of dozens of Word's shapes.
- Larger or Smaller: Expand or shrink the selected shape.
The Shape Styles group includes these choices for formatting a selected shape:
- Shape Style Gallery: Choose from three dozen different patterns of outlines and fill.
- Shape Fill: Choose your own custom fill for the selected shape.
- Shape Outline: Choose a custom outline for the selected shape.
- Shape Effects: Choose from a variety of effects—shadow, reflection, glow, soft edges, bevel, and 3-D—to change individual shapes.
NOTE
When the entire SmartArt graphic is selected, some of the above settings apply to the background for the whole shape. For example, you can apply a Shape Fill to the background for the SmartArt object.
The settings in the WordArt Styles group change the appearance of the text in the selected shape. Chapter 14 describes WordArt formatting settings in more detail.
Chart Basics
Use charts to convey how numeric data compares or trends. Like its companion programs PowerPoint and Excel, Word gives you the ability to create sophisticated charts that make numeric data easier for your reader to interpret. This section introduces you to the essentials for creating and formatting charts in Word.
Inserting a chart in a document
Word offers an extensive set of predefined chart types and styles. To insert a new chart in a document:
- Click to position the insertion point at the document location where you want the chart to appear.
- Click Insert and then click Chart in the Illustrations group. The Insert Chart dialog box shown in Figure 13.39 appears.
Choose a chart type here.
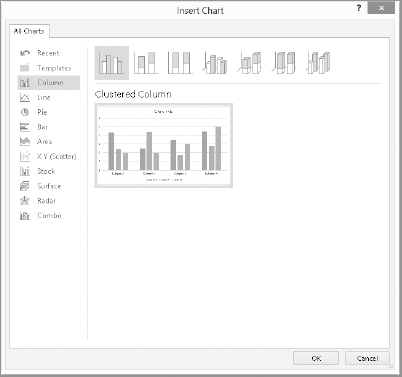
- Click an overall chart type at right.
- Click one of the chart subtype thumbnails along the top to view a preview of the chart.
- When you've found the desired chart subtype, make sure it's selected and click OK. Word inserts the initial chart and opens an Excel-like spreadsheet window with sample data. The sample data suggests how you need to enter your actual data based on the selected chart type.
- Type or paste previously copied information into the window. As in a Word table, press the Tab or arrow keys to move from cell to cell. Simply type over any current entry to replace it, or use Delete and Backspace as needed. Make sure you delete any unneeded example data and that the range selector includes all of the data that you enter. Watch the chart preview as you go to see whether you've done the needed cleanup work.
- When the chart has the appearance you want, as in the example in Figure 13.40, click the Close (X) button on the spreadsheet data window to close it.
Enter chart data in a separate window.

The chart is inserted. Click the chart at any time to reselect it. Notice that when you do, the Design and Format contextual tabs appear under Chart Tools.
Working with the chart design
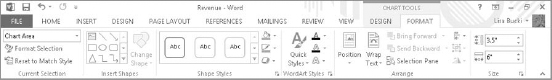
The Design tab, shown in Figure 13.41, is where you make the major decisions that determine overall design, data, layout, and style. It makes sense to make the major decisions about data presentation first, and then tweak as necessary. Notice also that four buttons appear beside the chart, enabling you to work with its formatting. From top to bottom these are:
Use the Design contextual tab to change chart appearance.

- Layout Options: Click to work with text wrapping settings. Chapter 14 explains how object wrapping settings work.
- Chart Elements: Use to work with parts of the chart, such as the title or legend.
- Chart Styles: Work with the chart's overall appearance and colors.
- Chart Filters: You can use this tool to temporarily limit the data the chart displays, as described later.
Changing the chart type
If you're not satisfied with the overall type of your chart, you can change it. In the Design tab, click Change Chart Type. The Change Chart Type dialog box appears. It looks identical in most respects (except for the title bar) to the one in Figure 13.39 that you encountered when you inserted the chart, but there is one essential difference. This time, the previews that you see will preview the data you've entered for the chart rather than the sample data. This lets you know whether a given chart type is appropriate for the data you have. Click OK to apply the currently selected chart subtype and finish changing the chart type.
Changing the chart data
To change the chart data after you've created a chart, select the chart and then click Select Data in the Data group of the Design tab. Office highlights the current dataset in Excel, and displays the Select Data Source dialog box, shown in Figure 13.42.
You can edit the data or change the entire data source.

Edit the data in the worksheet window as needed. Or if you want to make larger-scale changes, the Select Data Source dialog box options work as follows:
- Chart data range: Specify the range of the worksheet that is used by the chart as data.
- Switch Row/Column: Exchange how the data is charted versus the vertical and horizontal axes in the chart; for example, if the rows were previously charted against the horizontal axis, clicking this button rearranges the chart to chart them against the vertical axis. This may not be appropriate for all sets of data. In the example in Figure 13.42, because the chart has only one series, switching would foul up the chart.
- Add: Add a new data series (Total Sales versus Revenue?) to the chart.
- Edit (under Legend Entries): Make changes to the currently selected data series.
- Remove: Exclude the selected data series from the chart.
- Move Up/Move Down: Use the buttons to move the selected series in the chart.
- Edit (under Horizontal): Edit the horizontal category labels.
- Hidden and Empty Cells: Click to see and control hidden and empty cells so you can decide how to handle them (hide them or leave gaps).
- OK: Apply the changes to the chart.
TIP
If you simply need to edit the data and not change the data layout, click Edit Data in the Data group rather than Select Data. If you are also an Excel user, you can learn more about working with the Select Data Source dialog box in Excel Help.
Updating the chart layout, style, and colors
Chart layouts, in the Design tab, provide a varying number of different layouts for each chart subtype. To apply a new chart layout, click the Quick Layouts button in the Chart Layout group (or the More button if a gallery already appears), point to a layout to see a Live Preview, and click the desired layout to apply it. For example, Clustered Column, the first chart type in the Insert Chart dialog, has 11 chart layouts, as shown in Figure 13.43.
Click the More button for Chart Styles to open the gallery shown in Figure 13.44. Use the mouse to see a Live Preview of any of the styles, and then click to apply it.
Each chart type has a different number of associated chart layouts, selectable from the Design tab.

Change the overall chart style in this gallery.

As for SmartArt, you can apply a new color scheme for the chart overall. To do so, click Change Colors in the Chart Styles group of the Design tab, point to a color scheme in the gallery to preview it, and then click the color scheme to apply.
Refining the chart format
The Chart Tools ![]() Format contextual tab provides tools for selecting and formatting individual components of charts. As shown in Figure 13.45, the Format tab's groups provide myriad controls for fine-tuning your charts.
Format contextual tab provides tools for selecting and formatting individual components of charts. As shown in Figure 13.45, the Format tab's groups provide myriad controls for fine-tuning your charts.
The Format tab provides tools for enhancing individual elements in your charts.
Selecting and formatting chart elements
You can click to select elements on a chart such as a series or axis. However, sometimes it's easier and more precise to open the Current Selection drop-down list in the Current Selection group of the Format tab and then click on the element you'd like to select. Then you can click Format Selection to open a dialog box with formatting choices specific to the chart object you selected. Or you can use the tools in the Shape Styles, WordArt Styles, Arrange, and Size groups of the Format tab to make changes to the selected element. Click Reset to Match Style to remove custom formatting from the selected chart element.
Displaying chart elements, including series and axes
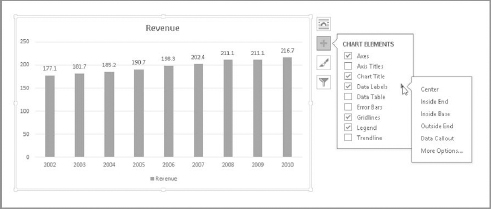
Click the Chart Elements button beside the chart to display the flyout shown in Figure 13.46. Use the check boxes to control which labels (chart title, axis titles, legend, and data labels) appear on the chart. When a triangle appears to the right of any option you check, click it to see additional options for formatting the displayed items. To edit label text such as titles, click in the respective text box and make the desired changes. Click outside the text box when you're done.
You can check which elements you want to appear in the selected chart.
Controlling the background
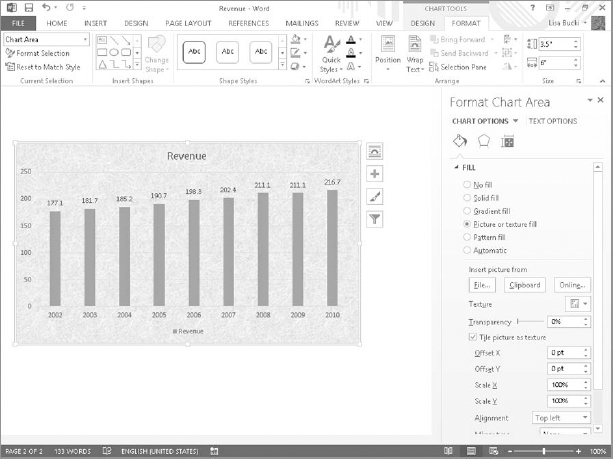
One common feature of a chart to format is the Chart Area or background. After selecting Chart area in the Current Selection group, click Format Selection to display the Format Chart Area pane at the right. Select a fill type to see options for applying that type of fill. For example, in Figure 13.47 a texture has been applied to the background. Click the pane's Close (X) button to close it when you've finished formatting the background.
Choosing a relevant fill for a chart background can liven up an otherwise boring chart.
Filtering the chart
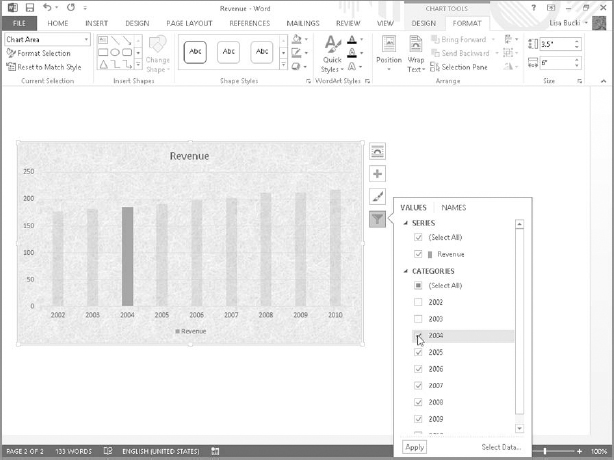
Filtering is a new feature in Word 2013 that enables you to temporarily hide data appearing in the chart. This enables you to, for example, make a copy of a chart and hide some of the data in the copy, so you can create a similar chart without having to create and format it from scratch. Click the Chart Filters button beside the selected chart, and then click to clear the check box beside any data you don't want to appear, as shown in Figure 13.48. Then click Apply, and click in the document to close the filtering choices. Use (Select All) to reselect or clear all of the check boxes.
Clear check boxes to temporarily hide chart data.
Using the Selection Pane
In Word 2013, you can format graphic objects as invisible, as long as they have a Wrap Text setting other than In Line with Text. To determine whether or not an object is set as invisible, open any .docx document that contains graphics with the right Wrap Text settings. In the Editing group of the Home tab, choose Select ![]() Selection Pane.
Selection Pane.
Each object with an applicable Wrap Text setting appears in the Selection pane with an eye icon to its right. Clicking the icon makes the associated object invisible. In Figure 13.49, the top Picture object has been marked as invisible, and the bottom Text Box object remains visible, as indicated by the eye icon still being visible. Use the Show All and Hide All buttons in the pane to show and hide all graphics.
You can use this feature to hide shapes, text boxes, SmartArt, and charts. You cannot unbundle parts of a chart or SmartArt object—it's all or nothing. Click the pane's Close (X) button to close it.
Use the Selection pane to control visibility for floating (not inline) graphic objects.

Summary
In this chapter, you've learned the essentials you need to know about tables, SmartArt, and charts. You should now be able to do the following:
- Insert a table, SmartArt graphic, or chart into a document
- Copy material from one table into another, even if the dimensions don't match
- Use table styles and other formatting settings to add zest and color to your tables
- Create tables from existing non-tabular data
- Use the Ribbon tools to modify table layout and design
- Add and format the text for a SmartArt diagram
- Change a diagram's layout, style, and colors
- Add shapes where needed
- Choose a chart subtype
- Add and update the text for a chart
- Select and format specific chart items, including the background
- Use new chart tools, such as filtering
- Use the Selection pane