Chapter 11
The Social Graph
We’ve talked about the Social Web as consisting of people and content, but it’s the connections among people arising from their shared interest in that content that make the Social Web so attractive. A key concept in understanding those connections, and the subject of this chapter, is the social graph.
Chapter contents
- What is a social graph?
- Characteristics of social graphs
- Social graphs spread information
- The social graph and social customer experience
What Is a Social Graph?
Social graph can be a confusing term. Sometimes people use it interchangeably with social network. But social network is itself confusing: Is a social network a group of connected people or a platform that people use to connect? When people call Facebook a social network, they clearly intend both meanings, but they also understand that the individuals connected on Facebook constitute a social network even without the platform.
You may recall a related problem from the early days of social interaction on the Web: Is a community a group of people or a place online where people connect? As with social network, the answer is it’s both.
Fortunately, social graph has a meaning that is distinct from social network. Consider the following definition:
Definition: The Social Graph is the representation of our relationships. In present day context, these graphs define our personal, family, or business communities on social networking websites.
Jeremiah Owyang, 2007
The key word here is representation. A social graph is a social network, as represented in terms of its connections, generally either visually or in computer code. Figure 11-1 shows an example of a social network represented visually in a social graph.

Figure 11-1: A simple social graph
While visual representations can be useful, not to mention beautiful, representations in code can be extremely powerful. These representations, often without being explicitly called out, power much of our experience on the Web today.
Consider the following, all of which are powered by graphs:
- Book recommendations on Amazon, under the heading “Customers who bought this also bought”
- Suggestions for photos, movies, and places that your friends like, available via Facebook’s Graph Search
- Recommendations you receive from Twitter, after you follow someone new (“Suggestions based on John Doe”)
You may have noticed that only the last example is based on a social graph alone. The first two are based on a social graph and a knowledge graph. Knowledge graphs are like social graphs except the nodes of the graph are content, not people. Often, knowledge graphs and social graphs are mixed. In the case of Facebook, my recommendations are based on my connections to people (social graph) and their connection to knowledge (movies, photos, and so on).
You probably used a knowledge graph before you ever used a social one. After all, that’s how Google decides what content to serve up in response to your search request. When knowledge objects are highly connected (that is, linked), Google gives them preference over those that are not. If other sites link to a site, it’s likely you will find that site useful too. Of course, Google doesn’t ignore the social graph (see the sidebar “Google and the Social Graph”).
The knowledge graph that powers Google is arguably the largest in the world. Microsoft’s search engine Bing also relies on a knowledge graph, to deliver summarized or relevant knowledge in the snapshot pane of the Bing results page. Neither Google nor Bing contains all the knowledge in the world, of course. Each relies on its own knowledge graph to represent—in an always partial but ever improving way—the network of knowledge in the world.
Just as there is no single, all-compassing knowledge graph, there is no single social graph. But unlike the world of search, where competitive platforms are few in number, the social world contains many platforms. Each of these platforms relies on a social graph of its own, a social graph imported from another platform, or both. So there are more social graphs in the world than there are knowledge graphs. Social networks like Facebook, Google+, LinkedIn, and Pinterest; photo messaging apps like SnapChat and Instagram; text messaging apps like WeChat, WhatsApp, and LiNE; and enterprise social platforms like Lithium, Jive, and Telligent all rely on social graphs, since they all permit users to friend, follow, or connect.
Still, all social graphs are not alike. At more than 1 billion users worldwide, Facebook’s social graph is the largest. In an increasingly social world, where every site and application on the Web wants to be social, having access to Facebook’s graph is a huge leg up. Think of all the applications that ask you if you want to find your friends when you first register. They may ask for access to your contact list in Yahoo, Gmail, or other mail applications, but increasingly they connect to the social graph of one or more large social networks.
Access to social graphs of large public networks used to be open. If you wanted your users to be able to find their friends or followers on your site or application, you just used the APIs to do it. Over the years, however, these networks have started to move to requiring consent to link to their graphs—and consent is not always granted. In 2010, Facebook blocked Twitter from connecting to Facebook’s graph. In 2012, Google closed the API to the social graph that powers Google+. Later the same year, Twitter blocked Instagram, signaling a new scrutiny of companies wishing to leverage its network. While it’s still possible for Instagram users to share photos on Twitter, it’s no longer possible to find your Twitter fans within Instagram automatically. While better use of network resources may be part of the reason, there’s little doubt that networks want to avoid sharing such a valuable asset with companies that may compete against them.
What does this mean if you’re running a social customer experience effort? We think it means three things:
- Understand the access permissions and requirements of all the applications you are using.
- Prepare for a landscape that has changed and is continuing to change.
- If you are pulling directly from social network APIs, understand that your access may only be temporary.
This fast-changing environment is one of the major motivators driving the adoption of software as a service (SaaS) social software solutions as discussed in Chapter 9, “Social CRM and Social Customer Experience.” Companies understand the importance of connection to the Social Web at large, and they are rightly wary of taking on the responsibility for ensuring that their connections are always live and operational. SaaS vendors promise that ensuring those connections will be their problem, not their customers’ problem. While the vendors are also subject to changes in policy from the big social networks, their membership in partner or certification programs means they have better visibility over coming changes and perhaps even some influence over the changes that occur.
Will there eventually be open standards to permit the sharing of social data? Google helped initiate such an effort, back in 2007, with the creation of the Open Social initiative, but that effort today focuses on social sharing in social networks inside large corporations. A larger, open public standard seems very far away.
A final word about social graphs, definitions, and standards: We’ve been talking here exclusively about collective social networks, but social networks exist on the personal level as well. Your network of friends and associates can be represented visually too. If you use Gmail, Yahoo, or Outlook, see MIT’s immersion tool to create a visualization of your email network, https://immersion.media.mit.edu. There’s a movement today toward greater control by individuals of their own online identity, content, and history. As you access applications on the Social Web that ask for permission to access your friends list, do you ever wonder, “Am I doing something some of my friends might object to?” Facebook’s Graph Search evoked an immediate reaction from privacy advocates—does this make it too easy to parse and analyze an individual’s behavior? We believe that individual control over social data will increase, not decrease, over the coming years. It’s another topic about which those running social customer experience (SCE) programs should stay aware and informed. Feeling lost? It’s not surprising—this is a complex area that’s changing every day. For a refresher on the basics, see the sidebar “A Social Graph Primer.”
Characteristics of Social Graphs
In the physical world, sociologists sometimes distinguish between different kinds of network relationships that an individual might possess. These include trust networks, which consist of the people whom you rely on and trust; communication networks, consisting of people who keep you informed and up to date; and advice networks, those individuals whom you turn to when you need guidance in decision-making. Social network expert Rob Cross of the University of Virginia, who has studied such networks in large organizations, has determined that you might even have something called an energy network, which consists of people who energize you as a byproduct of your interactions. In an era of declining employee engagement, his research provides one potential clue for getting employees back in the game. Each of these networks can be graphed to provide insight into their formation and operation.
Types of Social Networks
Online, different kinds of networks are emerging as well. In addition to the friend networks we see on Facebook, people are united by common location, interests, values, and status. It’s simple: People like to connect with others like themselves. Social applications like Meetup and Twellow, shown in Figure 11-2, build on an existing social graph based on common values, location, or other shared interests among Twitter members.
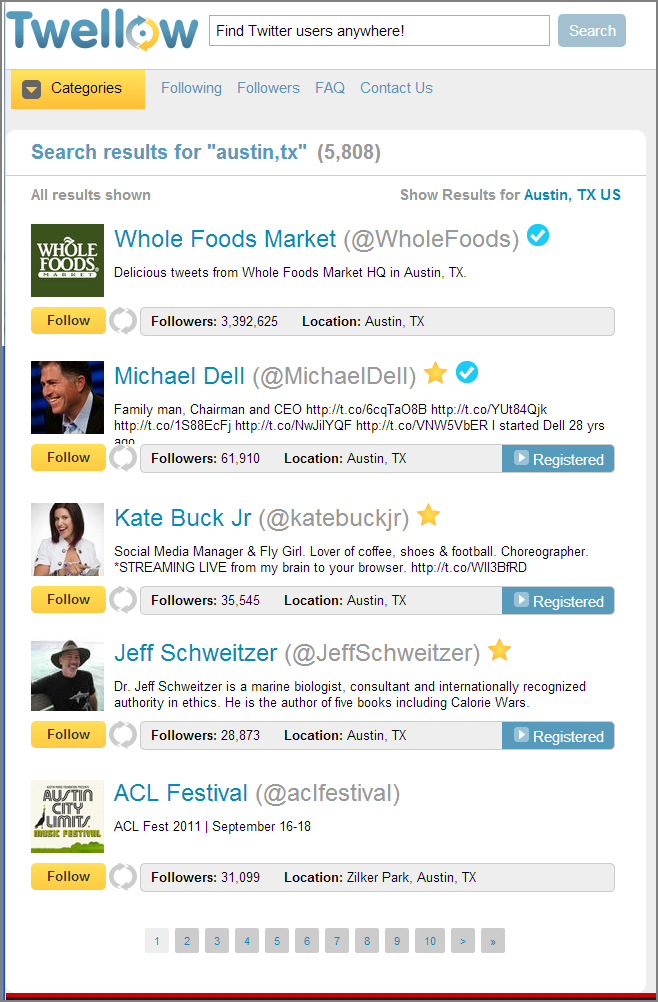
Figure 11-2: Twellow showing Twitter members in Austin, Texas
We all know what a friend network is; Facebook is probably the largest and most familiar example. That doesn’t mean that people don’t have many motivations for connecting on Facebook. It just means that they mostly connect because they are friends offline.
Location Networks
Location networks are exactly what they sound like: networks brought together by people in the same location. For example, on any day of the week, you’re likely to see hashtags in your Twitter stream that clearly relate to a conference taking place in some city or town. These are location networks, albeit temporary ones, that form when people share the same location for a period of time.
Location networks also exist around cities and towns and neighborhoods. Nextdoor (https://nextdoor.com), the “private social network for your neighborhood,” leverages the common interests of people who live in a geographical location. With a focus on real identities, Nextdoor hopes to realize the vision of earlier location-based efforts like Everyblock. While location grows increasingly important every year, it’s interesting to see companies struggle to take full advantage of its potential.
Interest Networks
Interest networks are in some ways the most exciting networks today. Many classify Pinterest as an interest network, since the focus is not on members themselves as much as it is on the things that interest them. There’s an interesting connection here with communities, which are often distinguished from social networks because of their focus on common interest rather than social bonds. We were struck to observe Tara Hunt, social media expert, and Bridget Dolan, head of social programs at Sephora, make almost identical comments about why interest networks and communities provide something social networks don’t. “Facebook is about who I am,” Dolan noted. “Community is who I want to be.” Likewise, Hunt has observed, “Facebook is who I am. Pinterest is who I want to be.” Both Dolan and Hunt point to an aspirational element to interest networks that can be lacking in social networks, which are grounded in one’s current activities, relationships, and lifestyle.
But there’s another reason why interest networks have generated so much excitement. They have shown a much stronger link to commercial activity than have other kinds of social networks. According to BI Intelligence, Pinterest alone accounted for 23 percent of social-mediated e-commerce sales in the second quarter of 2013.
Jon Elvekrog, blogging on Forbes CIO Network, broadened the value proposition for interest networks by identifying “five ways they will transform the Web”:
- Ad matching—using interest graph data, advertisers can compose more accurate segments to improve ad click rates.
- E-commerce recommendations—interest data can help improve poor performance from history alone.
- Customer relationship management—interest data can tell companies what a consumer values the most, insight that can be used to incent or reward.
- Entertainment applications—interest data can help improve movie or book recommendations.
- Marketing and promotions—in summary, more relevant offers.
While it may seem obvious, this tendency to connect around interest actually has a significant impact on the way connections between members—and hence conversations—propagate. The tendency to associate based on interests can manifest itself in the formation of a social graph in distinct and important ways. It’s worth understanding the tendency to preferentially connect with people sharing overt similarity when designing your social media and social business programs. For example, if you are after new ideas and are looking to a customer community to generate and discuss them, be sure that your participants haven’t formed cliques and instead are making connections based on more than specific personal interest. Otherwise, instead of collaboration you’re more likely to end up with competing factions.
Value Networks
In contrast to interest networks, value networks rely on association based on shared interest, lifestyle, passion, or cause. An entire community—in real life—coming together to stack sandbags against a flooding river is a real-life example of a value network. Regardless of social status, the collective community shares in the immediate goal of protecting itself. This plays out online in a social context when women across diverse walks of life come together to talk about common issues and challenges in places like the BlogHer Community. This sort of democratized social interaction is actually at the root of a lot of what happens on the Social Web.
The tendency for people to come together and organize around common issues, given diversity, is particularly important when designing a community application. When people are gathering around large social objects—lifestyles, passions, and causes—it is very likely that it is the shared values and purposes associated with these larger objects that are bringing together a variety of different people, in addition to the primary common interest itself (the specific passion, lifestyle, or cause that is shared). This in turn means that the shared outcomes, activities, and intellectual content produced within the community need to flow back in some form to everyone, regardless of who the actual contributor is. Otherwise, the individual interests will take over and the community will fragment.
Status Networks
The last type of network we’ve observed is a status network. This type of network takes advantage of what’s referred to technically as status homophily—the tendency of similarly credentialed or titled individuals to associate with each other. A CMO’s group on Facebook or a list of social media experts on Little Bird (http://getlittlebird.com/) is examples of relationships built on shared titles or occupations. Networks that encourage this type of relationship development include professional associations, skill-specific support forums—for example, a CIO discussion board or forum—and similar.
The status community, by comparison, is very likely to be driven by the reputation management system within a community, forum, or other social application. The reputation management system provides many of the cues that alert members to their own status or that of others within that community. CTOs joining a C-level tech community know already that the title of CTO or its equivalent is a shared credential. What engages them (in that community) are the solutions, tips, referrals, and best practices that they can pick up and apply in their work. The reputation management system—which provides a visible indication of which members are most likely to have offered viable solutions, for example—will quickly sort out the relative status ranking, beyond title, within this type of community.
Reputation management plays a role in the development of values-based communities too. Status differentiation can and does occur as some contributors within a shared value–driven community will produce more or more useful content than other members. That’s a natural condition, and members expect recognition for their efforts. What’s important, though, is that the community as a whole does not lose sight of the overall values connection as some members are elevated as a result of their greater contribution and participation.
Influencers and the Social Graph
Within any community or social construct—the kind of social space that is defined by the existence of a social graph—some participants are more influential or more valuable than others in any given situation. Reputation management—touched on earlier and in Chapter 4, “The Social Customer Experience Ecosystem”—governs the visible aspects, the signals or markers that identify the influencers, the leaders, and the experts within a social network, generally based on content contribution and the ratings or recommendations of other participants within that community.
Examining a particular member’s social graph on its own provides a potentially different—and not always consistent—view of influence within a social network. The social graph provides insight into influence and reputation through a study of how participants are connected. Somewhat esoteric terms like adjacency (the relative connectedness of individuals in a network) or centrality (the relative importance of an individual in a network) can also be used to determine who matters, to whom, and why within a social network. If you could walk into a party and see this kind of information in your augmented reality browser (neatly displayed behind your sunglasses), how much more effective could you be as a networker? The same principle applies—in much more realistic terms—to your business or organizational use of social graph analysis and visualization tools today.
Understanding “who matters” is great information for a wide range of social applications. However, this type of information is absolutely critical in one broad class of applications: support networks. In a support network, participants depend on each other for solutions, and the consequences of bad information can be much worse than, say, getting bad advice on a movie or a meal out. In a support forum, spotting, elevating, and otherwise ensuring that the experts remain engaged is essential to the long-term success of that support platform.
By examining the social graph, you can locate, groom, and cater to the experts. This ensures that they
- Have what they need to consistently deliver the best answers
- Feel that the time they spend is noted and valued
When expert candidates are identified—for example, by high centrality, that is, having a relatively large number of followers, the community managers might invite them to attend a special training event or to become a part of an insiders program to ensure that they continue to have access to the information they need to deliver quality solutions within the support community.
Adjacency (who is connected to whom) is equally important. Think about how LinkedIn adds value by showing its members the direct or potential path(s) from the people they know to the people they want to know. Indeed, a deeper study or observation of the social graph of your customers and constituents can be very beneficial.
Like participation, influence can also be measured inside the social network using the visible indicators described in Table 11-1 and network-specific tools such as netvizz (a Facebook application). The analytical tools provided natively within Facebook can be used to measure the quality of interactions and activity data overall that is associated with business pages. Influence can also be measured through the use of external tools.
Additional measures of behavior—for example, behaviors that connect what is happening on one particular network with the larger discussions happening elsewhere on the Social Web—include influencer analysis through the use of tools like BuzzStream. Tools designed to spot influencers as they act inside the community are also valuable. Lithium Technologies offers a particularly robust set of expert identification tools that are very helpful in spotting and supporting the experts that emerge (naturally) in a support or similar type of community. Klout (see sidebar) offers an interesting, for-pay service in addition to its free service. Interested individuals can visit Klout and calculate the influence score for their own social presence. On top of that, Klout offers—via its own API—a for-pay service that allows anyone to calculate the relative influence scores for participants in their own social networks.
Table 11-1: Measures of influence
| Metric | What It Means |
| Average number of friends | The degree to which people are connecting to others is useful in understanding the ease with which relationships form. If this is low relative to expectations, look at the mechanism for friending or consider adding automated suggestions for relationships. |
| “Top 10” by friend count | Who are the most connected, and does this change over time? This will help you identify your community leaders. |
| Popular group or topic themes | What are the big interest areas? Knowing this is fundamental to encouraging the development of new applications. |
| Most popular brands, products, services | What are the common interests, focused on marketing and business? What are people talking about that is important (business-wise) to you? |
| Most viewed events and members | What are the popular activities? Combined with popular groups and conversational themes, this information provides specific guidance in ongoing activity development. |
Social Graphs Spread Information
Beyond linking people within a social network, the relationships that are present within a social graph play an important role in the spread of information throughout that social graph and hence play a direct role in the sharing of content across a social network. Looked at another way, without sharing, a social network is a largely theoretical construct: What difference do a thousand connections make if nothing of value is flowing between them? Consider, for example, the value to you, personally, of a network that you may have joined without understanding why—except perhaps that everyone else was joining it—and as a result rarely find yourself using it. You have connections within this network, but of what use are they?
When Dave first joined Twitter he admittedly did not get it. Dave started using Twitter in 2007 at SXSW; he is member number 12,556,112. According to Dave, “Half of my motivation for joining was that everyone else I knew had already joined.” Given a bit of time, however, Dave started to develop actual relationships with people and began linking with people that he knew, or knew of, and with people interested in working on some of the same things he was interested in. And that’s when Twitter made sense—when he was able to use his social graph as it existed within Twitter in ways that benefited not only him but also the growing Twitter community.
The take-away is that only with a meaningful social graph—only with connections between people with shared interests—do the social networks that people belong to become relevant.
The applications built around the direct use of the social graph are important. Dave spoke with Rapleaf’s Michael Hsu—at the time Michael was part of Rapleaf’s marketing team—about applications that mine or otherwise tap the information exposed through the study of a particular social graph. Michael noted applications ranging from driving participation in online gaming—in one application, players with more than five friends in the game were significantly more engaged than those with four or fewer—to the observation that the spread of movie reviews across a network is directly related to the strength and connectedness of the graphs of the individuals who publish reviews. All of this suggests the value of knowing, through measurement, who is connected to whom and how these connections can therefore be used to encourage additional connections.
In a specific example, Rapleaf worked with an online university to identify opportunities to increase engagement (more direct participation in classes) and encourage recommendations to friends for specific classes (new business growth). Using Rapleaf to identify the friends of prospective students who were already students themselves—all with explicit permission—they found a significant increase in the likelihood of new student conversion (320 percent) associated with having a friend who is also a student. This quantitative knowledge, gained through study of the social graph, resulted in the implementation of a bring-a-friend-to-class promotion (your friend gets to attend class with you for free, for one week), an online student center where prospective students can talk with current students, and a formal new student-referral recognition program.
Dave spoke further with Michael, asking about what Michael saw in the near future for applications of social graph analytics and measurement tools:
What’s becoming clear is that an experience that is more “social” and connected for people is an experience that is more rewarding and engaging. It’s one where both customers and businesses win. For customers, this means more relevance, more fun, and more meaningful activity. For businesses, this means more activity, more repeated engagement, better retention, faster word of mouth, and faster acquisition (through all the sharing).
What we’re really going to see is a big push from consumer-facing companies to connect “friends” into their offering. Movie/food review sites, shopping sites, media/newspaper sites, hotels, movie studios, restaurants, and more—everyone will start to integrate friendships and the social graph in creative ways in order to provide more relevance and to personalize content for the user.
Ultimately, the social graph—combined with tools that encourage or facilitate content creation and sharing—powers a social network. Think back to the engagement process—consumption, curation, creation, and collaboration. The tools that support the sharing of information through the social graph drive the engagement process. Ultimately, collaboration is driven by relationships, and the relationships themselves are what form the social graph.
The Tools That Power a Social Graph
The tools that drive the formation of relationships and the engagement process itself range from essentially passive to highly active. During the design phase of your communities, ideation platforms, support forums, and similar, an important concept to remember is that the more active the relationship encouragement is, the stronger in general the resulting social experiences that link participants will be.
In a basic social-software platform—an entry-level discussion or community platform, for example—deployed straight out of the box, participants are generally able to create basic profiles and engage in topic-oriented discussions. These basic social platforms may also include built-in support for photo uploading, creating profile pictures, writing individual blog posts, group formation and discussion, and so on. Note here that these are features that enable members to do things that relate primarily to consumption, curation, and creation. Members of a woodworking forum might be creating and publishing pictures of cabinets, tables, and other projects they have completed or a review of new table saw that has been recently purchased.
We might think these platforms don’t promote social connections as readily as social networks do, but look again: The networks formed here are around content (for example, interest), not personal relationships. The challenge for these platforms as we move into the networked age is not to merely emulate large social network sites by adding tools for building one-to-one relationships but rather to make the relationships being formed around content more salient. If I rate something you contributed, you should readily see that. Moreover, you should see the fate of all your content as it is consumed, rated, and responded to by other members of the community.
These platforms have also lagged social networks in terms of personalization. Some progress has been made with suggested content (related content widgets are becoming standard), but suggested member widgets (given your interest in these topics, you may be interested in these members) are relatively rare. Sorting out precisely who would be good to connect with is left to the participants.
In addition to the rules that power potential relationships (friending suggestions, for example) and engagement in the community, members need ways to find each other, to find people with whom a relationship might be beneficial. At an even more basic level, Facebook’s activity feed and Twitter’s retweet capability—RT in Twitter parlance: the act of forwarding a tweet that you have received from someone you follow to all of your own followers—are themselves useful in discovering potential relationships.
The retweet in Twitter works to build one’s social graph like this: Say Chris follows Pat, and Pat posts something interesting that Chris sees. Chris retweets Pat’s post—a lot like forwarding an email—and as a result Chris’s followers (including those who may not have known of Pat) now see Pat’s post. Chris’s followers discover and follow Pat in this way—potentially increasing the size and reach of Pat’s social graph, all because Chris thought Pat’s post was interesting and simply passed it along.
In this example, it was Chris’s social graph that acted as the conduit for Pat’s post. The ability to easily retweet enabled Chris to share Pat’s post, building Pat’s social graph in the process. The process by which tweets propagate and drive expansion of the social graph within Twitter is shown in Figure 11-3. Pat’s tweet, “something notable,” is retweeted by Chris, one of whose followers sees it and decides to start following Pat as a result. Driving Twitter’s success, among other factors, is the extreme ease with which one can grow a large social graph. As a result, Twitter gets sticky, fast.

Figure 11-3: Growing the social graph
Beyond passing messages along, tools that enable searching, filtering, and aggregating content and sharing it between members serve to expand and refine personal social graphs. Facebook offers this capability through the combination of search and suggested friends (recommendations). Twitter introduced lists of specific members—a feature that built on and has since replaced the popular groups feature in TweetDeck (now owned by Twitter)—that people create and (optionally) share. Someone interested in horseback riding might build a list of riding coaches or professional equestrians to simply keep track of the posts from (just) these people. Twitter then provides the additional ability to share this entire list with others, making it very easy for others to further build their own social graph by following that entire list.
Spread Content Further
In addition to connecting people (members and participants) outright, the social graph is also useful as a conduit in spreading content—thoughts, ideas, words, pictures, and videos—across social networks. In the earlier Twitter example, Chris picked up Pat’s tweet and retweeted it, expanding Pat’s social graph and spreading Pat’s content beyond Pat’s own immediate social graph in the process. Not only was Pat’s social graph expanded in the process, but Pat’s content was spread further when Pat’s and Chris’s individual social graphs were momentarily merged through Chris’s retweet of Pat’s content.
In this way, the social graphs of members can be used to spread content further, to and between members across distinct social networks whose social graphs intersect. What does it mean to say that two social networks—or the individual social graphs contained within them—intersect? Simply, it means that two members, each with their own social graph, have someone (generally, another person) in common. Looked at a different way, if Marcia is a member of both Facebook and Twitter, then Marcia’s personal social graph actually spans two networks, and you can describe Marcia as a point of intersection between these distinct graphs.
Going further into the larger graphs that span social networks, Facebook introduced a set of tools built around its API that makes it easy to connect content (and hence participants) in social networks or content sites outside of Facebook with its members inside of Facebook. It works like this: Using a small code block that can be automatically generated on the Facebook Developers pages (see the sidebar “Social Graph APIs”), content developers on almost any network can introduce Facebook’s Like function to their content that is outside the Facebook social network. When someone clicks a Like button associated with a specific piece of content that is outside of Facebook, a status update is published inside Facebook, alerting others who are themselves Facebook members that this content exists and that someone they know likes it. As people inside (and outside) of Facebook see these notices, and as a result click the Like button that is associated with that same content, the like rating of that content goes up, furthering its spread.
The kinds of connections and content visibility offered via Facebook’s Like plug-in can be a very powerful way to increase the visibility of content outside of Facebook. For example, you may have a blog or a branded community; the content created for those applications can be shared onto your Facebook business page. This capability drives social graph growth through content spreading and exposure. This sharing can also drive friending based on the common likes of specific content, again adding to the value of your social technology implementation. This extends as well to recommendations and other forms of content that can also be personalized as they are shared, adding an additional element of clutter-cutting credibility to the entire process.
By extension, what works for published content (across networks) also works for content served into networks (content like ads, for example). Using the social graph, content that is being syndicated or published into a social network can be optimized based on the likes and dislikes of those in a particular member’s social graph. Going a step further, advertisements that leverage the social graph can actually display the fact that others within a particular person’s social graph like this advertised product or service. It’s a sort of 2.0 version of “All your friends are doing it, so perhaps you’d like to try it as well.”
Measure Content Spread
One final measure may be of interest: Referring back to the discussion of homophily—the tendency for like-minded individuals to link together in a social network—there are ways to measure the degree to which this is happening. This is useful to know because it suggests, for example, the degree to which a particular site is bringing individuals together at a rate that is different from what would happen by chance.
In other words, by studying the effects of homophily in a social setting, the degree to which the social network itself is successfully driving friendships or other relationships over and above what would be expected provides an indication of the value and performance of the relationship tools—the ability to search and discover interesting connections, for example—and hence a measure of how likely the community is to grow and the degree to which it is delivering social (versus purely functional) value to its members.
The Social Graph and Social Customer Experience
The social graph—and navigating and investigating it—are central to using social technology in business. Contained within the social graph are the relationships and structures that define influencers, the connections that suggest shared interests, and the pathways over which content, ratings, and reviews can be spread throughout a social network. So, the first step in creating a robust network or social application is to ensure that as members connect with each other, relationships form and thereby enable social actions.
Make Sure People Connect
So how can you encourage participants in your social projects to connect? There are a few basics to consider, and you can always take a tip or two from the best practices used by other social networks in encouraging members’ development of their own social graphs.
Recall the importance of profile completion. If members can’t identify each other, they won’t connect and build relationships. Think about it: Would you accept a LinkedIn connection request from “asdf ghjkl” in “anytown, usa”? (Dave actually received that request and promptly moved it to the trash.) If members are not completing profiles, add the tools that help them to do this, as is done on LinkedIn. LinkedIn shows you, as a member, the specific steps to take next to complete your social profile. Ensure that the networking platform you select supports something similar, either out of the box or easily added by you. Many social applications offer a programming extension or an API to enable you to extend the capabilities of the core platform.
In addition to the tools that focus directly on social interactions and the things that facilitate them, consider contests, reputation and profile completion bonuses, and other incentives that encourage profile completion and social interaction. Think back to Chapter 7, “Five Key Trends,” and the discussion of gamification to understand the importance of encouraging this kind of behavior. Relationships are possibly the single most important gating factor in the development of a strong community experience. Figure 11-4 shows LinkedIn’s profile page and the tools available to continuously improve and strengthen profiles to encourage connections (LinkedIn’s primary business value). As noted, relationships and the content sharing they enable are absolutely key to the progression toward engagement with your brand, product, or service.

Figure 11-4: Profile completion
Make Sure Activity Is Visible
Very few want to party alone; translated, it means that building a vibrant social presence is accelerated when activity, lots of activity, is obvious. This activity takes the form of posts, comments, contribution, and connections. Facebook, for example, regularly recommends that friend requests be sent between members who are not currently friends but have a number of mutual friends within the network. If Tom knows Jane, and Jane knows Mike, maybe Tom would have common interests with Mike as well. Note that this is not always the case. More than a few ill-advised friend suggestions have occurred as a result! But don’t let that stop you. The underlying point is that through the analysis of how people are connected, reasonable suggestions can be made as to who else might benefit from also being connected. Offering that bit of helpful connection advice can make a big difference in how well your community applications develop over time.
In addition to recommending friends, Facebook also uses its awareness of its members’ own social graphs to encourage engagement between current friends—for example, to keep “everyone involved in the party.” Facebook community managers noticed that more than a few members had, as they described it, dropped out. After an initial period of activity following their joining Facebook, the activity levels of some individuals declined to near zero.
To counter this decline in activity noted with some of its members, in 2009 Facebook introduced its reactivation program, called Reconnect, as an initiative to rekindle activity. However, rather than simply sending an email that said, “Hey, what’s up? We haven’t heard from you in a while,” Facebook turned to the social graphs of its members.
The Reconnect initiative worked like this: First, Facebook looked for people in your social graph whom you hadn’t talked to in a while. Then, it prompted you to reach out and share something with them. After some growing pains—suggesting, for example, that someone reconnect with an ex—the program effectively increased the overall member participation. With access to the social graph in the community networks that you create and a bit of programming work, you can add the same capability to your own social efforts. Figure 11-5 shows Facebook’s recommended activities, including a suggested friend and a suggestion to reach out to someone.

Figure 11-5: Suggested activities
More recently, and to the same end, Facebook added its timeline feature. By providing members with an easy way to look back and rediscover prior content, Facebook has made evergreen articles (content that has a longer than usual lifespan, for example, a post about infant care) and similar posts relatively more important in the otherwise immediate context of most social networks.
An even simpler method of encouraging relationships and participation can be borrowed from Twitter and the way it encourages profile completion: Encourage the provision of data that will help members find each other. Look at the profile data that has been entered across your social network. Pay attention to what is required and what is optional and to the information you may not be asking for that is common in other networks. If people are accustomed to providing specific information in other networks, they may also be willing to provide it within yours. Take the time to find out. More information is generally better when it comes to encouraging relationships.
In particular, take steps to encourage members to responsibly provide personally identifiable information. You’ll want to clearly explain why and clearly disclose how it will be used and be sure this is reflected in your privacy policy. Likely too you’ll need the underlying trust of your members. The big note here is that you are not doing this to share this information directly with others but rather to provide others who already have this information an additional, easy way to discover friends. Got that? Here’s an example: If you include an option for entering an email address in the profile—and keep it private, hidden from general view—it can still be used for member discovery by someone who knows that (person’s) email address, providing an additional (and very efficient) method of finding friends already on Twitter. Figure 11-6 shows the email and similar data that can be used to help connect people on Twitter.

Figure 11-6: Twitter: getting found
Taking this one step further, by including an option for email addresses your social site—through built-in or built-on software extensions—you can look into a new member’s address bookwith explicitly granted permission and then suggest automatically friending or following any discovered matches between the new member’s address book entries and those of other members on your site.
For marketing purposes, having a business presence on professional networks like LinkedIn can make sense, and in fact this is now considered entry stakes for most businesses and organizations, in the same way that having a website is considered for most as a must-have. Stepping up from the basics, accessing and putting social graphs to work is the basis for more substantive business applications built on or around personal and professional networks.
Figure 11-7 shows an application of the LinkedIn social graph API, developed at 2020 Social in New Delhi. Using the combination of the LinkedIn display ads and the LinkedIn API, the application looks at the first-degree connections of the person exposed to the display ad in LinkedIn. If the LinkedIn member clicks the ad, the landing page then lists the names of the employees of 2020 Social who are also first-degree connections of the member. If you click it, you see the employees of 2020 Social that you know. Taken together, the ability to examine the LinkedIn social graph and present relevant social data (first-degree connections who are also employees of 2020 Social) creates a very powerful landing page experience and one that taps directly the value of the relationships contained in LinkedIn connections via the social graphs of its members.

Figure 11-7: 2020 Social’s LinkedIn landing page
On-Domain: Community and the Social Graph
Social networks form according to a variety of primary applications—for example, for personal or cause-related activities (think Facebook, whose core appeal is for personal social interaction) or business use (as in Element14’s engineer community where electrical designers review and purchase semiconductor components). Personal networks can attract large numbers of people who then engage in conversations and share purchase experiences or discuss and form groups around the interests and causes they support. Purpose-built business networks, such as Element14’s or the American Express Open Forum Small Business community, have clear business applications, built around the passions and lifestyles of the member professionals who use them.
KickApps, a community platform acquired by Perfect Sense Digital in 2012, built this exact capability into their platform. Called the KickApps Social Graph Engine, the functional value is the optimization of incoming advertising according to the collective likes and dislikes of the member’s friends, expressed through an individual’s social graph.
Connected Communities
As a final point in the application of the social graph, consider the imminent rise of the universal social graph and its potential impact on business and cause-based organizations. While the Social Web is certainly about connecting and sharing—and to a much greater degree than websites, whether business or personal, ever were—there is still an element of one winner must emerge. What was once AOL and then Friendster, then MySpace followed by Facebook and Twitter, and then…will continue to morph.
Off in the distance lies the universal social graph—the single-location collection of your various profiles and personas. Think of personas as tuned personal profiles, sort of like your accountant (one persona) who takes to the highway on a Harley-Davidson Softail every other weekend (a different persona, related to the same underlying individual, or profile). The universal social graph approaches the challenge of maintaining multiple profiles, friend lists, and activity feeds by collecting them all around an individual and then plugging an appropriate identity into specific social applications as needed.
Of more-than-trivial consequence, the fact that most social networks require individual participants to create an entire, complete profile for use exclusively inside that specific social network actually limits cross-network participation. As a practical matter, how many profiles do you really want to maintain? This is a question that more and more social networking participants are beginning to ask, and eventually you will have to address this in the design of your social business applications.
As an alternative to the network-centric profiles of Facebook and similar networks, consider Ning, now owned by Glam Media. Ning members create a single identity and then use that as the basis for membership across the various Ning communities that they choose to join. A Ning member may be associated with one or more sports communities, a professional group, a college alumni network, and one or more lifestyle- or cause-based Ning communities. Regardless, it’s the same individual who is linked in all of these.
Very important here—and a key in understanding the differences in potential implementations between a Ning-based presence versus Facebook, for example—is that Ning is not simply a single sign-on protocol applied to a collection of individual networks. Instead, Ning is an example of an approach to social networking that begins with the personal profile and then attaches that profile to the various social applications that have relevance to the individual represented by that profile. This is definitely a trend to watch because it is yet another push in the movement away from centralized social hubs and “websites-as-islands” and toward a social experience that is defined first by the identity of the participants (via the profile) and then second by the context (specific social applications) in which they participate.
The take-away from this discussion is this: As you set out and plan your social technology, consider how (and if) members of your support forum, for example, will join it and share content as appropriate outside of that network—for example, in another community where they may be advocating the use of your products for which they are (also) seeking support through your support forum. Whether through a mechanism like Facebook’s Open Graph, Ning’s approach of “one identity, multiple communities,” or the use of OpenSocial (a social networking toolset developed by Google, MySpace, and others), you will want to make it easy for your participants to share experiences and move content across social networks just as they do within a single network. As business applications involving social technology develop further, the ability to easily traverse intersecting social graphs will gain in importance.
Review and Hands-On
Chapter 11 provided a deeper look into the social graph and the role that it plays in connecting individuals, in driving new relationships, and in spreading content. Chapter 11 drew a subtle distinction between two other nearly interchangeable terms: a social network (an interconnected set of people, relationships, and activities built around a common theme or platform) and the social graph (as defined here as a social network as represented visually or in code).
Review of the Main Points
The key points covered in Chapter 11 are summarized here. How might you incorporate these points into the design or use of the social applications you are planning for your business or organization?
- The social graph is key to the sharing of content and the spreading of shared experiences across social networks.
- The social graph can be used in business, both as an indicator of who is connected to whom and as an indicator of who might like to meet whom or where specific content should be pushed.
- There are different kinds of social graphs, including those based on interests, and also different kinds of social networks.
- The behavioral aspects of the social graph can be measured and used to monitor and tune the larger social network.
The social graph—while not as immediately obvious or as visible as shared content or the direct use of a social application—is an absolute key in developing and maintaining a vibrant social experience for the benefit of the participants in that shared experience. The role of the moderators, the design of the interaction points, and the degree to which participants can discover potentially valuable relationships are all driven by the existence and makeup of a participant’s social graph(s).
Hands-On: Review These Resources
Review each of the following, and then take note of what you learn and insights you gain. How can you apply (or specify the use of) these items in your own projects and the further development of your understanding of social technology?
- Facebook Open Graph plug-ins for use in social-media-based marketing: http://developers.facebook.com/plugins
- Tools, papers, and resources available through membership in the INSNA and the larger discussion of social network analysis: www.insna.org/
Hands-On: Apply What You’ve Learned
Apply what you’ve learned in this chapter through the following exercises:
- Map your first-degree network in your office, and then do the same in some personal aspect of your life, a civic organization, for example. Who is in both networks? What content is shared between these networks as a result?
- Look at your friends in some of the social networks you belong to. How many of these friends or people you follow are people you knew prior to joining versus the number you met after joining? How were those you met after joining referred or suggested?
- Develop a set of specific metrics for your social business applications that involve the social graph. Create a regular report, and track these measures over time.