
Chapter 8
Computational Tools for ADMET Profiling
Denis Fourches1, Antony J. Williams2, Grace Patlewicz2, Imran Shah2, Chris Grulke2, John Wambaugh2, Ann Richard2 and Alexander Tropsha3
1Department of Chemistry, Bioinformatics Research Center, North Carolina State University, Raleigh, NC, USA
2National Center for Computational Toxicology, Office of Research and Development, U.S. Environmental Protection Agency, Research Triangle Park, Durham, NC, USA
3UNC Eshelman School of Pharmacy, University of North Carolina at Chapel Hill, Chapel Hill, NC, USA
Chapter Menu
8.1 Introduction
Large quantities of ADMET-related chemical biological data have been released in the public domain in the past decade [1, 2]. This growth was mainly due to (i) large federally sponsored high-throughput screening (HTS) programs (e.g., Tox21, ToxCast) [3–6] with on-going efforts to test thousands of chemicals against hundreds of relevant short-term assays; (ii) development of online repositories (e.g., ChEMBL, PubChem) [7, 8] that actively collected, integrated, and stored chemogenomics data extracted from literature and/or directly deposited by researchers; and (iii) contributions from pharmaceutical companies that publicly released enormous amounts of internal screening data not considered to be strategic anymore (e.g., GSK PKIS and antimalarial sets) [9, 10]. Importantly, there is a novel growing source of absorption, distribution, metabolism, excretion, and toxicology (ADMET) data contributed by academic screening centers (e.g., Harvard Institute of Chemistry and Cell Biology - ICCB, UNC-Chapel Hill's Center for Integrative Chemical Biology and Drug Discovery - CICBDD) [2, 11]. The latter are not only transforming drug discovery but also enabling ADMET-relevant high-throughput screening campaigns driven by multidisciplinary government-academic teams [11–13].
With the skyrocketing amount of data available in the public domain, it has been hypothesized that ADMET prediction models would become more and more reliable. Yet it is not clear whether the current generation of ADMET predictors have already benefited from this data profusion. It is also unclear what level of accuracy the current models are providing when predicting complex endpoints (e.g, cytochrome 3A4 inhibition, renal clearance, P-gp inhibition) for compounds not present in the models' training sets. With the evolving deployment of ADMET predictors on mobile devices, all key actors of the drug discovery pipeline, from synthetic and medicinal chemists to regulators, will have easy access to computational ADMET tools requiring, on the surface, little-to-no knowledge in cheminformatics. This begs the questions of whether such tools are sufficiently reliable to accurately assess the ADMET profile of a new chemical, whether medicinal chemists can use these models to bias the molecular design process, or whether regulators are willing to consider current ADMET models as ready-to-use property forecasting tools. These are complex issues and the goal of this chapter is to address some of them from the perspectives of both academic molecular modelers and computational and toxicology research scientists at regulatory agencies worldwide.
In this chapter, we discuss (i) different modeling techniques and approaches (e.g., chemical curation workflow, QSAR modelability index, chemical (biological) read-across) that have proven helpful in obtaining predictive ADMET models, (ii) the utility of those models for regulatory purposes and their potential relevance to adverse outcomes pathways (AOPs), (iii) the numerous challenges (e.g., biological data curation, activity and toxicity cliffs, multi-endpoint modeling, in vitro/in vivo continuum) yet unsolved by the current generation of cheminformatics approaches and associated software tools, and (iv) perspectives for developing the next generation of computational ADMET predictors (e.g., accessibility with mobile devices, metabolite profiling, structure-exposure-activity relationships).
This chapter is not exhaustive and it reviews some computational models and approaches that have been developed for ADMET profiling. Since there are a number of excellent published reviews on ADMET [14–16], this chapter solely aims to give the authors' point of view on the predictive value and overall relevance of key cheminformatics techniques introduced and tested in a number of case studies.
8.2 Cheminformatics Approaches for ADMET Profiling
In this section, we highlight some of the cheminformatics approaches and protocols that have demonstrated usefulness and high relevance for ADMET profiling in various published case studies and/or have attracted the attention of the research community. Again, this is not an exhaustive list of methods. Recent reviews by Beck and Geppert [14] and Moroy et al. [17] will be interesting reading for those who wish to delve further into this topic.
8.2.1 Chemical Data Curation Prior to ADMET Modeling
There is community-wide excitement regarding the rapid growth and availability of chemical-biological data in the public domain. However, serious alerts concerning the poor quality and irreproducibility of these chemical and biological records have appeared in the recent literature [18–21]. Chemical curation is essential because the reliability of cheminformatics models is totally dependent on the quality of the data used for model development. Several studies [22–26] have demonstrated that the prediction performances of models can be negatively influenced by inaccurate representations of chemical structures and uncertainties in experimental data. Therefore, prior to any analysis or modeling studies of ADMET records, a thorough curation of the dataset needs to be accomplished, followed by chemical structure standardization.
Ascertaining the accuracy of the chemical data in large datasets is an arduous task, which is often impossible to complete fully. The chemical curator must evaluate the linkage between each chemical structure and the value of the response variable that will be modeled. Assuming the dataset is an aggregation extracted from a public database (e.g., PubChem, ChEMBL), to map the provenance of every dataset record to its originating reference and verify the chemical identity associated with each value would be very time consuming. Even if that mapping were done, verifying the correctness of the chemical identifiers associated with the value in the originating publication would require accessing supplier information (e.g., material safety data sheets, certificates of analysis) or analytical chemistry results for the sample tested. With this level of curation, the rate of model development would grind to a crawl, so determining the reasonable amount of curation necessary for the intended modeling purpose is vital.
A dataset intended for building a model to be used in a regulatory context needs a different level of curation compared to a dataset intended for screening or hypothesis generation. At a minimum, it is appropriate to evaluate the consistency of the provided chemical identifiers from the dataset. If a dataset record contains a name, registry identifier (e.g., Chemical Abstract Service Registry Number, European Inventory of Existing Commercial Chemical Substances Number), and a chemical structure, it should be determined when the identifiers may be conflicted (i.e., map to different substances) on the basis of other public sources of chemical information. A curator can then examine the inconsistencies, choose either to keep the record and assign it to the structure that seems most likely, or eliminate the record from the set because of the uncertainty caused by the conflict. Many of the cases encountered may involve distinct chemical structures being associated with names or registry numbers that are less well defined (e.g., a mixtures of positional isomers represented by a single isomer). The decision to use a representative structure is made based on the curator's discretion, but the implications of imprecise mappings of data to structures for model interpretation and application should be clearly conveyed. More details are given in the final section of this chapter from the perspective of chemogenomics data curation (i.e., generally referring to the collection of large amounts of chemical-biological target activity data generated in HTS programs).
Once the dataset has been curated, the structural representation of the chemicals must be standardized so that chemicals are represented by consistent rules. It is essential to ensure, for example, that (i) a given functional group (e.g., nitro and sulfo groups) is consistently represented for each molecule in the dataset, (ii) salts and counterions are either properly formatted or treated according to well-defined rules, and (iii) there are no duplicate chemicals in the modeling set to be utilized for training a QSAR model.
We [24, 26–29] have worked to establish best practices for chemical data curation and data preprocessing prior to modeling, largely focused on compiling accurate chemical structures. For example, EPA's recently expanded the Distributed Structure-Searchable Toxicity (DSSTox) database that is powering EPA's newly released Chemical CompTox Dashboard (https://comptox.epa.gov/dashboard). The latter focuses heavily on ensuring accurate and consistent associations of chemical structures used in modeling with source chemical identifiers, such as chemical names and Chemical Abstracts Service (CAS) registry numbers, which are most commonly linked to published biological data.
General rules for chemical data treatment and curation have been established from the experience gained from processing and analyzing various types of ADMET datasets. The following are the rules with respect to chemical structures:
- 1. Chemical descriptors must be computed from standardized 2D structures, which helps to ensure that the different chemotypes (e.g., nitro groups and other specific tautomeric substructures) present in chemical structures are consistently represented in the same form.
- 2. Establishing consistency of chemical structures assigned to substances across multiple chemical databases helps to flag potentially incorrect structures, especially when it comes to chemicals with complex stereochemistry.
- 3. Resolving the presence of structural duplicates is essential prior to QSAR modeling using either structural descriptor – (which is derived from the mol-file) or identifier – (e.g., InChI) based methods to detect structural duplicates in a given dataset. CAS registry numbers, chemical names, and/or SMILES are not well suited to this task.
- 4. Modelers and final users of ADMET predictions should ensure that models are based on well-documented, carefully curated chemical datasets. Otherwise, they themselves should spend time browsing manually through the chemical datasets, looking for structural inconsistencies or evident mistakes in the molecular structures. It has been shown that even a relatively small fraction of erroneous structures in a dataset of less than 10% leads to a significant decrease in model accuracy [30].
8.2.2 QSAR Modelability Index
The prediction performances of a QSAR model are directly influenced by the dataset used to build the model, especially its size, structure diversity, and the uncertainties and distribution of chemicals' experimental activity (e.g., ratio of actives to inactives, range of quantitative potency values). The reliability of models is also dependent on the modeling workflow used to generate, select, and validate the models. The types of variable selection techniques, cross-validation protocols, application domains, or consensus scoring approaches also impact the nature and the quality of the ADMET models. A single study can employ multiple types of machine learning techniques, descriptor calculations, and modeling workflows in order to identify the most predictive QSAR models for a given ADMET endpoint. With the increasing size of chemical datasets, such Combi-QSAR approaches [31] are becoming more onerous and expensive to conduct. Moreover, it has been shown that the prediction performances of various QSAR models tend to reach a maximum for a given chemical dataset no matter how many modeling techniques are employed [32, 33].
Recently, the concept of “dataset modelability” has been introduced. It implies a pre-modeling estimate of the feasibility to achieve highly predictive QSAR models for a given dataset of chemicals tested for the same biological endpoint. Golbraikh et al. [34] envisioned the concept of modelability based on the analysis of multiple datasets that included significant fractions of activity cliffs (i.e., very similar compounds with very different activities) [35], these cliffs being directly responsible for the poor prediction performance of the QSAR models built using these datasets. The authors introduced the “MODelability Index” (MODI) as a quantitative scoring technique to quickly evaluate whether reliable global QSAR models could be obtained for a given dataset. MODI is computed as follows. The first nearest neighbor (i.e., the most structurally similar compound in the dataset) is determined for each compound of the set on the basis of the computation of the chemicals' dissimilarity using a series of molecular descriptors. Then, the algorithm analyzes whether or not each compound and its first neighbor belong to the same activity class (e.g., both compounds are annotated as being CYP3A4 inhibitors). If the two compounds do not belong to the same activity class, then they can be recognized as activity cliffs. The MODI algorithm analyzes how many pairs of such activity cliffs are present in each category of chemicals according to the following formula:

where K is the number of classes (![]() for a binary dataset), Nisame is the number of compounds of the ith activity class that have their first nearest neighbors belonging to the same activity class i; Nitotal is the total number of compounds belonging to the class i. It was shown that if the value of MODI for a particular dataset does not exceed 0.6, then it is impossible to develop a model with an accuracy exceeding 60% with even the most sophisticated modeling algorithms.
for a binary dataset), Nisame is the number of compounds of the ith activity class that have their first nearest neighbors belonging to the same activity class i; Nitotal is the total number of compounds belonging to the class i. It was shown that if the value of MODI for a particular dataset does not exceed 0.6, then it is impossible to develop a model with an accuracy exceeding 60% with even the most sophisticated modeling algorithms.
There are other dataset indices, such as the ligand-based SALI [36] and structure-based ISAC [37] that were developed specifically for identifying and quantifying activity cliffs in chemical datasets. These indices are complementary to MODI and allow for a better assessment of the readiness and suitability of global QSAR approaches for a given dataset. Thus, it is important to evaluate the feasibility of model building for any dataset before significant efforts are expended in an effort to develop reliable and externally predictive models.
8.2.3 Predictive QSAR Model Development Workflow
There have been several recent reviews outlining critical steps and best practices for developing rigorous and externally predictive QSAR models (e.g., [38–40]). Here we outline some key steps of the modeling workflow for achieving models of the highest statistical significance and external predictive power. We emphasize, however, that model development and validation are critical but not exclusive components of the modeling process. Other factors, such as data accuracy or dataset modelability, can strongly affect modeling outcomes irrespective of the rigor of the data mining and statistical modeling techniques used. Additionally, the ultimate success of the ADMET model depends on (i) the accuracy of primary experimental data used for model development, (ii) the accurate linkage of chemical structure representations to such data, (iii) the rigor of the computational tools and proper use of statistical model validation techniques, and (iv) the mechanistic transparency, interpretability, accessibility, and ease of use of both computational tools and models by the research and regulatory community.
An example of an established, structure-focused strategy for QSAR model development and validation [38] is shown in Figure 8.1. It describes the workflow for delivering validated QSAR models that can be employed for virtual screening, yielding computational hits that should be ultimately confirmed experimentally. It starts by carefully curating chemical structures and, if possible, associated biological activities to prepare the dataset for subsequent calculations (see Section 8.5.1). Then, an n-fold external validation protocol is typically employed, where the dataset is randomly divided into n nearly equal parts, with ![]() parts systematically being used for model development and the remaining fraction of compounds used for model evaluation. The sphere exclusion protocol [41] is then used to rationally divide the remaining subset of compounds (the modeling set) into multiple training and test sets that are used for model development and validation, respectively. Note that the division of the modeling set into training and test sets can also be done randomly, with the modeling set compounds being initially sorted (or stratified) according to the endpoint, from the most to least active molecule.
parts systematically being used for model development and the remaining fraction of compounds used for model evaluation. The sphere exclusion protocol [41] is then used to rationally divide the remaining subset of compounds (the modeling set) into multiple training and test sets that are used for model development and validation, respectively. Note that the division of the modeling set into training and test sets can also be done randomly, with the modeling set compounds being initially sorted (or stratified) according to the endpoint, from the most to least active molecule.

Figure 8.1 Predictive QSAR modeling workflow [38].
Once the dataset is split into training and test sets, multiple QSAR techniques are employed based on the combinatorial exploration of all possible pairs of descriptor sets and various supervised data analysis techniques (combi-QSAR) to select models characterized by high accuracy for predicting both training and test sets data. The model acceptability thresholds are typically characterized by the lowest acceptable value of the leave-one-out (LOO) cross-validation R2 (q2) for the training set and by the conventional R2 for the test set; default threshold values of 0.7 are used for both q2 and R2. All validated models are finally tested as one ensemble using the external validation set. A critical step of the external validation is the use of an applicability domain (AD), which is defined uniquely for each model used in the consensus (ensemble) prediction of the external set. If the external validation demonstrates significant global predictive power of the models, they can be employed for virtual screening of available chemical databases to identify putative active compounds. More specific details about the algorithms and related approaches have been given in earlier publications [38, 39].
Models resulting from the QSAR workflow (Figure. 8.1) can be used to prioritize the selection of chemicals for experimental testing and validation. Clearly, experimental validation constitutes the ultimate test of the model-based prediction success. The focus on experimental validation, in turn, shifts the emphasis on ensuring good (best) statistics for the model that fits known experimental data toward generating testable hypotheses about purported bioactive (e.g., toxic) compounds.
When possible, all derived QSAR models should be benchmarked against other existing predictors available in the public domain developed with the same datasets, as well as (with new datasets) against commercial packages. Consensus approaches integrating models developed with different QSAR methods and/or often by different groups are becoming increasingly popular. One of the first examples of such collaborative development of highly accurate QSAR models was in application to aquatic toxicity [32], where the best QSAR model emerged on combining individual models developed by six different groups. Recently, a similar approach was applied to the collaborative modeling of estrogen receptor activity [42], where the final model integrated contributions from more than a dozen different groups. A significant advantage of this consensus approach, in addition to its higher statistical accuracy due to the use of ensemble modeling, is the potentially higher community acceptance of the resulting models as “gold standards,” given the community involvement in building the models. The biggest limitation of the consensus modeling approach, as applied in practice in the above-mentioned studies, is the need to maintain access to a complicated assembly of distinct models, some based on proprietary software, in order to generate new predictions. Such models could be maintained by publicly accessible web servers such as OChem (https://ochem.eu) and ChemBench (http://chembench.mml.unc.edu) that enable the development of consensus models according to the above workflow. This workflow is used to develop each model contributing to the ensemble, which ensures the rigor of the consensus model.
8.2.4 Hybrid QSAR Modeling
An important challenge for computational toxicology is achieving fast and accurate estimation of environmental hazards and human health risks with minimal to no dependence on animal testing [43, 44]. To address this challenge, the EPA launched the ToxCast project in 2007 to repurpose “off-the-shelf” HTS methods, commonly employed in the pharmaceutical industry, toward the evaluation of hundreds, to now thousands of chemicals in the environment that pose potential exposure and toxicity risks [45]. Additionally, EPA has partnered with the National Institutes of Environmental Health Sciences' National Toxicology Program (NIEHS/NTP), the National Institutes of Health's National Center for Advancing Translational Sciences (NIH/NCATS), and the US Food and Drug Administration (FDA) to form the Tox21 consortium (http://tox21.org). The Tox21 project aims to develop novel, alternative approaches to toxicity testing, minimizing the use of animals, with the goal of moving the field of predictive chemical toxicology forward under the paradigm of in vitro to in vivo extrapolation [46]. These projects have generated extensive quantitative in vitro HTS data for thousands of environmental chemicals, drugs, food additives, and so on, as well as for approximately 100 drugs that failed clinical trials due to toxicity issues in hundreds of experimental systems [47]. As of today, 8599 unique substances have been tested in Tox21 across about 100 assay endpoints, whereas ![]() substances comprising the ToxCast chemical library have been screened in up to 800 assay endpoints [48, 49].
substances comprising the ToxCast chemical library have been screened in up to 800 assay endpoints [48, 49].
ToxRefDB is another EPA database that contains the in vivo regulatory repeat dose study data for roughly 1000 chemicals, with an overlap of roughly 750 chemicals with ToxCast and Tox21 [50]. In addition, toxicogenomics data, consisting of microarray gene panel screening, provides another dimension of experimental knowledge that is potentially useful for predictive chemical toxicity modeling and is becoming increasingly available [51, 52].
In addition to screening data, guideline study data, both in vivo and in vitro, are becoming increasingly available, often encouraged by new regulations. In that context, the European REACH regulation [53] comes with data requirements for chemicals that both manufacturers and importers must satisfy. And, these requirements are mainly dictated by annual tonnage production levels. As of the end of 2016, the REACH database lists 9801 unique substances studied across 3609 assays [54]. In addition, there is a significant amount of in vivo animal data deposited, thus far.
The proliferation of publicly available in vitro and in vivo bioactivity data for hundreds to thousands of chemicals creates an opportunity for innovative computational frameworks that integrate chemical and biological factors for systematic investigation of endpoint toxicities. New workflows for hybrid modeling are beginning to address the challenges of processing and exploiting diverse experimental data streams in the context of the in vitro–in vivo extrapolation paradigm. The success of such integration depends on whether the alternative data streams (e.g., HTS assays) provide unique and relevant information to complement traditional, structure-based QSAR models. Figure 8.2 shows a plot comparing compound similarity in chemistry space versus the space of multiple qHTS descriptors: each point represents a pair of compounds, with x-axis values representing chemical similarities in the space of qHTS descriptors (i.e., biological profile similarity) and y-axis values conveying the chemical structure similarity of the same pair (computed as a Tanimoto coefficient). This plot clearly indicates that the two distinct sets of compound features are uncorrelated and may be complementary in a sense that the same pair of compounds could be viewed as chemically similar but produce vastly different biological responses (activity cliff); or vice versa, compounds with similar biological profiles could have highly dissimilar chemical structures. This suggests that the concomitant use of short-term assays and chemical descriptors in a hybrid modeling strategy may prove advantageous in establishing models of the highest predictive power. Conventional QSAR models often have limited power due to the complexity of the observable biological effect, which can be mediated through multiple biomolecular interaction networks. Additional factors limiting ADMET QSAR models include low-quality data, over-extrapolation, and poor endpoint definition [55, 56]. Thus, it is unlikely that significant gains would come from using novel machine learning techniques or new chemical descriptors to model the same dataset. The hope is that major improvements can be achieved by utilizing alternative data sources, such as short-term biological assays, that can serve as inputs for modeling of the higher-order biological effects, along with traditional chemical descriptors [57–59].

Figure 8.2 Chemical and biological similarities do not correlate. Each point represents a pair of compounds characterized by pairwise chemical similarity (y-axis) versus biological similarity (x-axis). Examples of a priori outliers that should be flagged and analyzed separately are shown.
In Figure 8.3, we outline several strategies for integrating in vitro biological data streams and chemical descriptors to predict in vivo effects. These approaches include simple consensus (a), mixed-feature (a), and hierarchical (c) modeling, and multispace optimization (d); for more comprehensive reviews, see Refs [59, 60]

Figure 8.3 Strategies for utilizing diverse data streams for predicting higher-order biological effects.
8.2.4.1 Simple Consensus
This is the most straightforward approach where two models of the same endpoint are developed independently using either chemical descriptors or biological assay data. Both models are applied concurrently to predict external datasets and the predicted values are averaged (for continuous modeling) or annotated using some voting scheme (e.g., by majority for categorical data).
8.2.4.2 Mixed Chemical and Biological Features
This approach employs both chemical structural data (i.e., chemical descriptors) and in vitro assay data (i.e., biological descriptors) as joint chemical-biological descriptors; the approach is illustrated by studies of carcinogenicity and acute toxicity [57, 58] described below. This approach was used to build improved models for predicting carcinogenicity and employed bioactivity data generated for a set of 1408 compounds tested across six human cell lines [61]. A total of 383 compounds were identified for which data were available from both the Berkeley Carcinogenic Potency Database and HTS studies. Compounds classified by HTS as “actives” in at least one cell line were likely to be rodent carcinogens (sensitivity 77%); however, HTS “inactives” were far less informative (specificity 46%). Using chemical descriptors only, kNN QSAR modeling resulted in 62% overall prediction accuracy for rodent carcinogenicity applied to this dataset. Importantly, the prediction accuracy of the global model was significantly improved (to 73%) when chemical descriptors were augmented by the HTS data, which were regarded as biological descriptors.
Another study [57] used cell viability qHTS (i.e., quantitative HTS, screened at multiple doses) for the same 1408 compounds across the 13 cell lines used. A total of 690 of these compounds were identified for which rodent acute toxicity data (i.e., toxic or nontoxic) was also available. The classification kNN QSAR modeling method was applied to these compounds using either chemical descriptors alone or as a combination of chemical and qHTS biological (hybrid) descriptors as compound features. The external prediction accuracy of models built with chemical descriptors only was 76%. In contrast, the prediction accuracy was significantly improved to 85% when using hybrid descriptors. These studies suggest that combining qHTS profiles, especially the dose-response qHTS results, with conventional chemical descriptors considerably improves the predictive power of computational approaches for rodent acute toxicity assessment. A similar approach can be employed for the modeling of any ADMET endpoint where both in vitro and in vivo results are available.
A clear limitation of the hybrid chemical-biological modeling approach is that experimental HTS data are required in order to use models for the prediction of in vivo effects for new chemicals. However, the barrier to generating such data is steadily decreasing as programs such as ToxCast and Tox21 continue to generate new HTS data for many chemicals. Another possible avenue to be explored is the development of a panel of rigorous QSAR models predicting the outcome of HTS assays; if successful, such models could replace experimental testing of new chemicals and could expand into areas of chemical space that are less amenable to HTS testing (e.g., DMSO insolubles, volatiles, commercially unavailable chemicals) such that predicted activity values could be used in hybrid QSAR modeling.
8.2.4.3 Two-Step Hierarchical Workflow
As previously indicated, the development of hybrid models that require experimental data as inputs can be justified only if the barrier to generating such data is low. Ideally, however, and for many practical applications (e.g., to virtual screening), experimental data would only be required for the training set, with structure-only models used to predict activity for new compounds. A hierarchical modeling workflow [62] illustrating this type of workflow is shown in Figure 8.4. First, in vitro to in vivo correlation profiles are generated for all compounds in the modeling set. These compounds are then clustered into several subsets based on the discovered relationships and, lastly, QSAR models are developed for individual subsets. The modeling set compounds are, thus, partitioned into two or more subclasses, enabling development of a classification QSAR model using chemical descriptors only for predicting membership in each subclass. Thus, for an external compound, the first classification QSAR model is used to assign it to one of the subclasses, and the second QSAR model is used to predict quantitative compound toxicity. This workflow would not rely on the experimental assays once the development of initial models is completed. Potentially, this approach allows one to analyze thousands of pairwise in vitro to in vivo relationship plots based on the ToxCast database.

Figure 8.4 Two-step hierarchical k-nearest neighbor (kNN) QSAR workflow to develop an enhanced rat acute toxicity (LD50) model by using cytotoxicity data (IC50) as biological profile descriptors.
Studies such as those described above have shown that the accuracy of QSAR models utilizing chemical descriptors only for predicting complex toxicity endpoints can be improved by adding biological descriptors derived from in vitro assays. However, in a recent investigation [63] involving 127 drugs from the Japanese Toxicogenomics Project (TGP), hybrid models did not show higher accuracy than those using toxicogenomic descriptors alone (i.e., chemically perturbed gene expression profiles) for predicting hepatotoxicity. This observation prompted the development of a new way of integrating chemical and biological information to achieve models of higher accuracy and interpretability, which is described in the following.
8.2.5 Chemical Biological Read-Across
The prediction of chemical-induced bioactivity through traditional global QSAR modeling approaches, such as those described above, is essentially based on various perceptions of structural similarity. Although we have described efforts to extend traditional global QSAR modeling approaches through the use of hybrid chemical-biological descriptors, the overall perspective of hybrid QSAR models still remains that of a global modeling approach. A more focused approach, which better aligns with a regulatory perspective in evaluating new chemicals, starts from the chemical of interest and creates a local neighborhood of structure-activity inferences, which in turn can be used to build a weight-of-evidence (WOE) argument. To capitalize on the emerging data streams mentioned above, the chemical-biological read-across (CBRA) approach [64] was developed to infer a compound's activity (e.g., acute toxicity) from those of its chemical and biological analogs. CBRA employs the experimentally obtained biological measurements (e.g., gene expression profiles, cytotoxicity screening, cytochrome P450 inhibition) regarded as biological descriptors, as well as computed chemical descriptors to assess similarity between chemical substances. As various types of chemical-induced bioactivity (e.g., carcinogenicity, hepatotoxicity) can be evaluated by CBRA, there is a need for user-oriented software capable of rapidly conducting and analyzing the outcomes of this approach. The CBRA standalone software (see Figure 8.5) provides a user-friendly graphical interface to (i) upload both chemical and biological descriptors and export CBRA outputs, (ii) build, visualize, and customize the radial plots illustrating the relative similarity of a chemical of interest to previously tested compounds, and (iii) help in analyzing structure-activity relationships. The use of 2D radial plots facilitates the transparency of the analysis by depicting the relative similarities between a query chemical and its closest analogs. By integrating computed structural descriptors and experimentally measured biological responses, CBRA maximizes the use of all available data to ensure both reliability and interpretability of hybrid QSAR models. CBRA requires users to prepare and upload both chemical and biological descriptors, and can process thousands of compounds within the same project. Although the complete biological matrix should contain as many rows as the number of compounds and +as many columns as the number of measured biological properties, incomplete matrices with a small fraction of unavailable measurements are tolerated by the program and are taken into account for similarity calculations.

Figure 8.5 Main window of the CBRA program divided into three parts: (a) selection of input files, (b) colored radial plot, (c) molecular structure viewer, textual information, and options.
CBRA calculates two similarity matrices, one based on chemical descriptors and another based on biological descriptors. Similarity (Si) is computed as a standard Tanimoto similarity coefficient. Then two sets of nearest neighbors are determined by CBRA from the similarity matrices: kchem neighbors in the chemical space and kbio neighbors in the biological space. The predicted activity of a given compound (Apred) is calculated from the similarity-weighted aggregate of the activities Ai of its k nearest neighbors in both chemical and biological spaces (Equation (8.2)).
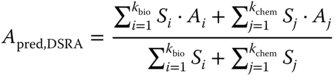
where Ai and Si are the activity and Tanimoto similarity values, respectively, of the nearest neighbors of a compound in bioactivity space, and Aj and Sj are the activity and Tanimoto similarity values of the nearest neighbors of a compound in chemistry space.
Statistical criteria are automatically calculated to determine the prediction performance of CBRA. CBRA software also implements a unique radial plot visualizer (Figure 8.5) to illustrate how Apred is computed and the nearest neighbors for a given compound. Overall, CBRA enables users to conduct chemical biological read-across and visualize the neighborhood of chemicals using innovative radial plots. This technology facilitates the incorporation of diverse data streams to infer, for example, in vivo effects of chemicals from their molecular structures and in vitro biological profiles. This makes CBRA a potentially appealing tool for drug discovery and chemical hazard assessment. Importantly, CBRA technology is freely accessible for academic laboratories and regulators and is easily customizable for supporting specific needs requiring additional code implementation.
A similar approach to CBRA has been independently developed by Shah et al. [65] with the goal to begin formalizing the process of read-across in a regulatory setting, which is traditionally a qualitative expert-driven assessment. They proposed a generalization of the CBRA approach called a generalized read-across (GenRA), which can be based on either chemical-only or biological-only similarity, or a hybrid chemical-biological similarity read-across, depending on biological data availability. Approximately 3200 chemical structure descriptors were generated for a set of about 1780 chemicals and supplemented with bioactivity data from just over 800 in vitro assays from EPA's ToxCast program. The read-across prediction for a given chemical was based on the similarity weighted endpoint outcomes of its nearest neighbors characterized by chemical descriptor and/or bioactivity information. In this study, the read-across predictions were of in vivo toxicity effects as observed across 10 different guideline or guideline-like study types, spanning 574 unique types of toxic effects across 129 targets. Objective measures of performance were also established to evaluate the GenRA predictions, both in terms of the optimal performance for a given number of neighbors and similarity threshold, and in terms of the local neighborhood. The bioactivity descriptors were often found to be more predictive of in vivo toxicity than chemical descriptors alone or even a combination of both, but this was dependent on both the toxicity effect of interest as well as the local neighborhood. Work is currently ongoing to extend the approach to evaluate the utility of other chemical descriptors that can better characterize expert knowledge and to disseminate the approach as a publicly available, web-based tool. The latter will permit a read-across prediction to be made for a given chemical of interest and assess the confidence in the prediction by modifying the number of neighbors and the similarity index.
Figure 8.6 provides a graphical representation of a local neighborhood for a target chemical, in this case Benoxacor. The figure shows the nearest neighbors, where the target chemical is at the root of the tree and the neighbors are organized radially in an anticlockwise manner starting with the most similar chemical and ending with the least similar. The similarity index (Jaccard similarity) is weighted by the type of descriptor. The boxes above each analog provide an aggregated summary of the experimental information per study type, for example, ![]() , where red boxes reflect adverse effects and green reflect no adverse effects. GenRA predictions are represented as orange and blue boxes for predicted adverse effects and no predicted adverse effects, respectively.
, where red boxes reflect adverse effects and green reflect no adverse effects. GenRA predictions are represented as orange and blue boxes for predicted adverse effects and no predicted adverse effects, respectively.

Figure 8.6 Graphical representation of a local neighborhood for Benoxacor [65].
8.2.6 Public Chemotype Approach to Data-Mining
An approach to data mining and subsequent modeling that relies more heavily on a local-chemistry perspective is being pursued within EPA's ToxCast research program using a public set of “ToxPrint” chemical features (https://toxprint.org/). A ToxPrint fingerprint file (i.e., a matrix of binary values [1,0] for each chemical-feature pair) can be generated within the associated public Chemotyper application (https://chemotyper.org/) for an imported chemical SDF file, or can be generated within the commercially available CORINA Symphony software (see https://www.mn-am.com/products/corinasymphony). Both the ToxPrints and Chemotyper were developed by Altamira (Altamira, Columbus, OH) and Molecular Networks (Molecular Networks, Erlangen, GmbH) under contract from FDA. ToxPrint chemotypes (or ToxPrints) are coded in an open, XML-based Chemical Subgraphs and Reactions Markup Language (CSRML), and can be visualized and searched within the Chemotyper application [66]. The ToxPrint set consists of 729 uniquely defined CSRML features specifically designed to provide broad coverage of inventories consisting of tens of thousands of environmental and industrial chemicals, including pesticides, cosmetics ingredients, food additives, and drugs, as well as to capture salient features important to the safety assessment workflow within FDA. The Chemotyper Windows application, with the ToxPrint CSRML file loaded, enables a user to import an SDF file, superimpose ToxPrints onto their chemicals of interest, view and filter chemicals based on one or more ToxPrints, and export a ToxPrint fingerprint file for the user-imported structures. Significant advantages of the ToxPrint chemotype approach over other available fingerprinting methods (e.g., PubChem, MACCS), that are motivating its varied applications within EPA, are the ease with which the public ToxPrints can be generated, visualized, chemically interpreted, shared across projects, communicated, and used to profile inventories and define local chemistry domains. Several examples using ToxPrints to profile, assess relative structural diversity, and compare distinct chemical inventories were presented in a recent survey of the ToxCast chemical landscape [49]. Other ToxCast research applications are employing ToxPrints to detect bioactivity enrichments within local chemotype domains for chemical subsets (e.g., flame retardants) and individual assays (e.g., the Tox21 mitochondrial membrane potential disruption assay). Such enrichments can inform and guide follow-up studies and can be used to generate initial structure-activity hypotheses. In addition, chemotype enrichments computed for hundreds of ToxCast and Tox21 HTS assays provide an objective basis for enhancing and exploring putative bioactivity linkages within local chemical domains defined by the ToxPrints. Eventually, however, it is envisioned that chemotype sets, such as ToxPrints, would be employed across a continuum of methods, that is, for guiding interpretation and use of global QSAR models, defining local applicability domains within global QSAR models, and providing an objective local chemistry basis for comparing distinct models. Workflows that automate the process of using ToxPrint chemotypes for data mining and exploration will also be key to engaging toxicologists and regulators and potentially overcoming some of the existing barriers to adoption of global QSAR models.
8.3 Unsolved Challenges in Structure Based Profiling
The current generation of computational profilers used for lead optimization and chemical risk assessment has shown tremendous progress regarding prediction reliability and broadened applicability domain. Still, important challenges remain, especially when it comes to the identification of erroneous data points prior to modeling, the identification and treatment of activity and toxicity cliffs, and in vitro to in vivo extrapolation. In this section, we recapitulate the main challenges that face predictors and give some indications how to solve them.
8.3.1 Biological Data Curation
As mentioned in Section 8.2.1, public data pose many questions and potential challenges when it comes to determining the quality of a particular chemical measurement. We recently defined the “five i's” danger [27, 28, 67] as using potentially incomplete, incorrect, inaccurate, inconsistent, or irreproducible data points in a given modeling study. To illustrate this point, the study by Prinz et al. [68] observed that only ![]() of published assertions regarding purported biological functions for novel deorphanized proteins were in line with their in-house measurements at Bayer Pharmaceuticals. Similarly, Begley and Ellis [69, 70] conducted a complementary study at Amgen, resulting in an even lower rate of reproducibility of 11%. Ekins et al. [71] recently analyzed the potential bias of dispensing techniques (tip-based vs acoustic) on the quality, reproducibility, and modelability of HTS data. The authors found these two different techniques to significantly influence the experimental responses measured for the same compounds tested in the same assay. Although both dispensing techniques were deemed acceptable, this example emphasizes the dramatic influence of subtle experimental variations in the lack of accuracy and/or reproducibility of the measurements. Of critical importance are the consequences for molecular modelers who depend on the quality of the experimental data used for building models. Therefore, the implementation of key steps for ensuring biological data curation prior to the modeling of ADMET data is also critical.
of published assertions regarding purported biological functions for novel deorphanized proteins were in line with their in-house measurements at Bayer Pharmaceuticals. Similarly, Begley and Ellis [69, 70] conducted a complementary study at Amgen, resulting in an even lower rate of reproducibility of 11%. Ekins et al. [71] recently analyzed the potential bias of dispensing techniques (tip-based vs acoustic) on the quality, reproducibility, and modelability of HTS data. The authors found these two different techniques to significantly influence the experimental responses measured for the same compounds tested in the same assay. Although both dispensing techniques were deemed acceptable, this example emphasizes the dramatic influence of subtle experimental variations in the lack of accuracy and/or reproducibility of the measurements. Of critical importance are the consequences for molecular modelers who depend on the quality of the experimental data used for building models. Therefore, the implementation of key steps for ensuring biological data curation prior to the modeling of ADMET data is also critical.
The three main steps of our biological data curation workflow are recapitulated in the following [27, 28]:
- 1. Duplicate analysis with checking of the bioactivity concordance: The same compound may be present many times in the same database [72]. As an example, we underline cases of identical chemicals purchased from different suppliers tested in the same assays, resulting in different internal identifiers with potentially different experimental responses [73]. If modelers build QSAR models using datasets containing structural duplicates in both training and test sets, the models will be skewed toward enriched local activity domains and, if activities are similar, may artificially inflate prediction performances [26]. To sufficiently account for structure-based details (such as stereo, salt, or tautomeric distinctions), 1D or 2D descriptors, or a unique text-based structure representation, such as an InChI string (or key) should be used on the sets to identify duplicates. Note that distinct chemical names and/or CAS registry numbers in the public domain are commonly mapped to identical structures (e.g., parent to salt, stereo to no stereo), or vice versa (e.g., one name points to multiple structures); hence, these identifiers are particularly unreliable for identifying duplicate records. Once identified, chemical-activity duplicates should be set aside and analyzed further before being included in a training set. Some possibilities requiring further processing include the following:
- a. The ADMET activity value for one compound is dramatically different from the value associated with the duplicated compound. One of the two values may be wrong (e.g., labeling error, incorrect unit). Neighborhood analysis using structure-based clustering could help find which value is more likely to be correct.
- b. The removal of counterions or the normalization of functional groups has modified the representation of one substance (or both) resulting in duplicates. It is recommended that the user verify the original records and check the activity values associated with the two compounds.
- 2. Analysis of the intra- and inter-laboratory experimental variability: The bioactivity of a compound is usually measured in multiple replicates using the same assay. Companies can test thousands of compounds in duplicate or triplicate assays (e.g., metabolic stability). Obviously, such a dataset is critical to analyzing the global experimental variability of a given assay, as well as to spot any local variability within a chemical series. Even in academia, reference compounds can be tested hundreds of times over months and years. These data points, often ignored, can provide critical estimation of experimental variability. Usually, modelers rely on partial information reported in a published article (e.g., “
 units”) [74]. Thus, most modeling studies consider experimental variability to be a constant. As a result, the expected accuracy for any QSAR model of ADMET endpoints cannot exceed the experimental variability. For modelers dealing with screening data, it is recommended that the user analyze the baseline history of the target/endpoint of interest and the reference controls. The baseline history (e.g., per plate, per batch, per week, per month) is critical to identifying false-positives and false-negatives [75]. Inter-laboratory variability can best be assessed if many duplicate compounds are being measured at several independent laboratories.
 - 3. Identification of mislabeled compounds: Individual QSAR models can be used to form an ensemble model, enabling consensus predictions for any chemical. Consensus models have been shown to afford higher prediction performances and broader applicability domains [38]. Importantly, consensus models can also be employed to identify and potentially correct mislabeled compounds in a dataset. A compound can be considered as “suspicious” if (i) all individual QSAR models involved in the consensus model cannot predict its activity accurately; and (ii) that compound is clustered with structurally similar compounds with dissimilar bioactivities.
8.3.2 Identification and Treatment of Activity and Toxicity Cliffs
Activity cliffs [35] (or toxicity cliffs) are extremely challenging for cheminformatics modeling approaches. In a given ADMET dataset, modelers should identify all suspicious pairs and determine if some of these pairs of similar compounds with dissimilar ADMET profiles are true activity cliffs. There are several types of activity cliffs [35] defined by how the similarity of compounds is computed (e.g., 2D, 3D, matching molecular pairs). Each pair of activity cliffs needs to be analyzed according to the following principles:
- 1. Bioactivities for each compound must be checked against the original data source for accuracy and potential mislabeling issues. For instance, a compound originally annotated as a 10 nM inhibitor (very active) might be corrected to a 10 mM inhibitor (inactive).
- 2. The two chemicals must be analyzed and the structural differences interpreted. What functional group or structural feature differentiating the two structures is likely to cause that variation of activity? If one group is identified, what is the best molecular modeling technique capable to taking that structural difference into account to differentiate the two compounds? Three-dimensional differences should also be considered, especially in the context of receptor-ligand interactions disrupted or modified by one compound of the activity cliff pair.
8.3.3 In Vitro to In Vivo Continuum in the Context of AOP
With the advent of adverse outcome pathways (AOPs), there exist many opportunities to reconsider the manner in which QSARs are developed in the future and to evaluate common assumptions underpinning AOPs. A case in point is the AOP for skin sensitization. Research in the field of skin sensitization dates back many decades, which made this endpoint a convenient case study from which to construct the first AOP, published by the OECD in 2012. The AOP outlines the various key events that need to occur in order to induce skin sensitization. The framework has also proved useful to put into context the different nonanimal test methods that are in development or have been formally validated against the specific key events. Recent research has focused on developing integrated testing and assessment approaches to help in assessing skin sensitization potential on the basis of both in silico and in vitro information. Our research used the AOP construct to test the role that penetration may play in limiting sensitization [72]. Typically, skin penetration is modeled using parameters that reflect hydrophobicity and size. Thresholds have been set that state that substances that exceed specific log octanol-water partition coefficient (log Kow) and molecular weight (MW) values will not be sensitizers as skin penetration will be limited. We evaluated a large body of skin sensitization data, as submitted for the purposes of the EU REACH regulation, to test the scientific validity of these thresholds. Highly hydrophilic substances, e.g., ![]() , are expected not to penetrate effectively to induce sensitization, and it is assumed that substances must have a
, are expected not to penetrate effectively to induce sensitization, and it is assumed that substances must have a ![]() to penetrate effectively through the skin to induce sensitization. 1482 substances were identified with skin sensitization data and measured log Kow values. 525 substances had a measured
to penetrate effectively through the skin to induce sensitization. 1482 substances were identified with skin sensitization data and measured log Kow values. 525 substances had a measured ![]() ; 100 of those were sensitizers. There was no significant difference in the incidence of sensitizers above and below this log Kow threshold [76]. Reaction chemistry principles that had been established for lower MW and more hydrophobic substances were found to be as valid in rationalizing the skin sensitizers with a
; 100 of those were sensitizers. There was no significant difference in the incidence of sensitizers above and below this log Kow threshold [76]. Reaction chemistry principles that had been established for lower MW and more hydrophobic substances were found to be as valid in rationalizing the skin sensitizers with a ![]() . Fewer examples were identified when a similar evaluation was performed for substances with a MW
. Fewer examples were identified when a similar evaluation was performed for substances with a MW ![]() . However again there were no special explanations for the 13 sensitizing substances identified with a
. However again there were no special explanations for the 13 sensitizing substances identified with a ![]() ; the same reaction chemistry principles were sufficient in rationalizing the sensitization responses [76]. This study underscores the need to sufficiently scrutinize, using objective methods and modern approaches, commonly held assumptions and guiding principles based on chemical structure and computed properties.
; the same reaction chemistry principles were sufficient in rationalizing the sensitization responses [76]. This study underscores the need to sufficiently scrutinize, using objective methods and modern approaches, commonly held assumptions and guiding principles based on chemical structure and computed properties.
We have also considered the utility of the validated nonanimal test methods and the extent to which they are capable of correctly identifying sensitizers that require activation in order to induce their sensitization response [73]. A dataset of 127 substances with outcomes from the local lymph node assay (LLNA) and alternative test methods were compiled and evaluated. A reaction chemistry evaluation was first performed that determined which substances were nonreactive, directly acting, or indirectly acting. For the substances predefined as indirectly acting, the reaction chemistry mechanisms were evaluated for each of them in more detail to determine whether the substance was likely to act as a pre-hapten or pro-hapten or both. Pre-haptens undergo activation externally before coming into contact with the skin or on the skin (e.g., through air oxidation processes – autoxidation). Pro-haptens undergo activation within the skin, mainly through metabolic processes [77, 78].
8.4 Perspectives
This final section focuses on the future developments and perspectives for the next generation of computational predictors. Indeed, as chemistry-based forecasting tools are increasingly available on all sorts of devices [79–81], more researchers will be drawn into using them directly, without the help of cheminformaticians and computational chemists to explain and interpret the validity of the prediction results. These increasingly feasible use scenarios create increasing pressures for the development of reliable, easy-to-use, and transparent ADMET profilers for various types of chemicals.
8.4.1 Profilers on the Go with Mobile Devices
There is a growing compendium of cheminformatics software tools available and fully functional on tablets, smartphones, and other mobile devices. This is a new step in technology portability that finally addresses one of the initial promises of cheminformatics, which is to assist experimentalists, researchers, or safety assessors in chemical-relevant decision making as close as is possible to the lab bench.
For instance, the following tablet applications are notable: PyMol (developed by Schrodinger; https://itunes.apple.com/us/app/pymol/id548668638) allows users to browse and visualize protein structures and protein-ligand complexes; ChemSpider (developed by Molecular Materials Informatics; https://itunes.apple.com/us/app/chemspider/id458878661) enables structural and text queries on the ChemSpider database; CompTox Mobile (developed by Kirill Blinov; https://itunes.apple.com/us/app/comptox-mobile/id1179517689) puts over 700,000 chemical structures onto a handheld device to be searched by chemical identifier and linking to a rich website of data; Chemical Engineering AppSuite (developed by John McLemore; https://itunes.apple.com/us/app/chemical-engineering-appsuite/id526158171) integrates a collection of chemistry-related tools and databases; and Elemental (developed by Dotmatics Limited; https://itunes.apple.com/us/app/elemental/id518655328) allows users to draw and export compound structures. These applications are the first representatives of a new generation of “cheminformatics apps” with user-friendly, tablet-ready graphical interfaces that will offer direct and intuitive access to diverse chemogenomics data. It is very likely that the features offered by these applications will progressively integrate complex QSAR-based ADMET predictors coupled with sophisticated modules that will be capable of rapidly accessing and cross-searching chemical biological databases, visualizing and analyzing screening results, launching modeling and screening computations on remotely controlled workstations, and sharing chemical information in the cloud. Early examples of these capabilities are demonstrated with TB Mobile (developed by Collaborative Drug Discovery; https://itunes.apple.com/us/app/tb-mobile/id567461644) that makes available a set of molecules with activity against Mycobacterium Tuberculosis and links to pathways (in http://biocyc.org), genes (in http://tbdb.org) and literature (in PubMed); and PolyPharma (developed by Molecular Materials Informatics; https://itunes.apple.com/us/app/polypharma/id1025327772) that uses structure-activity relationships to view predicted activities against biological targets, physical properties, and off-targets to avoid. The Mobile Molecular Datasheet (MMDS) (developed by Molecular Materials Informatics; https://itunes.apple.com/us/app/mobile-molecular-datasheet/id383661863) offers the ability to upload Bayesian models created by the user using open source descriptors and algorithms [82–84].
8.4.2 Structure–Exposure–Activity Relationships
The notion of chemical exposure has been largely ignored by molecular modelers, mainly due the lack of experimental data [85]. Although there are a handful of models for predicting both human and ecological exposure rates based upon basic chemical descriptors, without data to evaluate their predictive performance and domain of applicability, there may not be enough confidence to inform decision making [86]. One obvious data source for empirical evaluation of exposure modeling efforts has been the US Centers for Disease Control (CDC) National Health and Nutrition Examination Survey (NHANES) data, which reports chemical concentrations in urine and blood for a representative sample of the US population [87]. The NHANES exposure data, although extremely useful qualitatively, are notoriously difficult to interpret with respect to model evaluation [88, 89]. Unsurprisingly, efforts to link physicochemical properties and structure directly to exposure have met with, at best, limited success [90, 91]. However, a useful intermediate step between structure and exposure has been the recognition that the route of exposure, which is often dictated by how chemicals are used, can explain large differences in exposures within the NHANES data [91–93]. Among the chemical exposures indicated by the CDC NHANES urine data (which reflects the average exposure for the United States), nearly all those chemicals with urine analytes that were detectable (i.e., above the limit of detection) were used in consumer products and articles of commerce within the home. In contrast, those chemicals that were used exclusively outside the home were largely below the limit of detection except for the very highest quantiles of the US population (e.g., the 99th percentile). Thus, a model analysis performed by the EPA's Exposure Forecasting (ExpoCast) project [92] was carried out, which tested for correlations between both physicochemical properties and coarse descriptors of product use. We found that only the use descriptors and the national production volume were predictive, but that these factors alone could explain roughly 50% of the chemical-to-chemical variance in exposure rates indicated by the NHANES data [91]. New models for indoor chemical exposure have been developed [94] and the ExpoCast project has worked to compile information on chemicals in consumer products [95, 96]. However, again these activities were data limited – only knowledge about chemical ingredients explicitly disclosed by manufacturers were available, which omits chemicals not reported either due to lack of regulatory requirement or lack of information (as in the case where constituents of a product are obtained from a third party). Therefore, new tools have been developed by the ExpoCast project to use machine learning to predict chemical use from structure. Thus, a paradigm of “structure predicts use,” which correlates exposure, currently allows for a tentative, but defensible prediction of exposure in the absence of other information.
8.5 Conclusions
In this chapter, we highlighted several key modeling approaches, techniques, and protocols we believe already contribute to make ADMET prediction models more accurate and robust than ever. As emphasized by the issues of data reproducibility and chemical biological curation, it is clear that data growth and availability alone do not guarantee improved modeling reliability. However, the amount, diversity, and rate at which ADMET-relevant chemogenomics data are currently generated and released in the public domain, support and validate the notion of Big Chemical Data, which could potentially transform the way we store, analyze, visualize, model, and extract knowledge from chemical-biological data. In that context, the development of new integrative modeling approaches, still based on machine learning techniques but taking into account the chemical exposure in a subpopulation, 3D structures of relevant biological targets, HTS screening assay results, in vivo profiles in zebrafish models, or validated AOPs all together represent the next critical step of predictive ADMET modeling. Obviously, these next-generation models will not only allow for better profiling chemical hits early in the discovery pipeline but also help regulators prioritize chemicals to be tested with scrutiny for potential detrimental effects. Finally, we should emphasize the necessity for educators to familiarize students with the aforementioned concepts as early as possible in the curriculum. As these tools will continue to be more and more accessible to non-specialists (especially via mobile devices), the skills required to master the development of predictive ADMET models span several disciplines (e.g., cheminformatics, chemistry, biology, toxicology, bioinformatics) and necessitate dedicated classes and training workshops.
Acknowledgments
D.F. gratefully thanks the NCSU Chancellor's Faculty Excellence Program, the Bioinformatics Research Center, and the NCSU Comparative Medicine Institute.
Disclaimer
This work has been internally reviewed at the US EPA and has been approved for publication. The views expressed in this paper are those of the authors and do not necessarily represent the views or policies of the US Environmental Protection Agency.
References
- 1 Hu, Y. and Bajorath, J. (2014) Learning from “big data”: compounds and targets. Drug Discov. Today, 19 (4), 357–360.
- 2 Fourches, D. Cheminformatics: at the crossroad of eras. In Application of Computational Techniques in Pharmacy and Medicine; Gorb, L., Kuz'min, V. E., Muratov, E. N., Eds.; Springer Netherlands, 2014; pp 539–546.
- 3 Austin, C.P. (2009) The Tox21 collaboration on predictive toxicology the best of times, the worst of times. Toxicology, 1, 1–15.
- 4 Attene-Ramos, M.S., Miller, N., Huang, R. et al. (2013) The Tox21 robotic platform for the assessment of environmental chemicals – from vision to reality. Drug Discov. Today, 18 (15–16), 716–723.
- 5 Sipes, N.S., Martin, M.T., Kothiya, P. et al. (2013) Profiling 976 ToxCast chemicals across 331 enzymatic and receptor signaling assays. Chem. Res. Toxicol., 26 (6), 878–895.
- 6 Kleinstreuer, N.C., Judson, R.S., Reif, D.M. et al. (2011) Environmental impact on vascular development predicted by high-throughput screening. Environ. Health Perspect., 119 (11), 1596–1603.
- 7 Gaulton, A., Bellis, L.J., Bento, A.P. et al. (2012) ChEMBL: a large-scale bioactivity database for drug discovery. Nucleic Acids Res., 40 (Database issue), D1100–D1107.
- 8 Wang, Y., Bolton, E., Dracheva, S. et al. (2010) An overview of the PubChem bioassay resource. Nucleic Acids Res., 38 (Database issue), D255–D266.
- 9 Elkins, J.M., Fedele, V., Szklarz, M. et al. (2015) Comprehensive characterization of the published kinase inhibitor set. Nat. Biotechnol., 34 (1), 95–103.
- 10 Wawer, M. and Bajorath, J. (2011) Extracting SAR information from a large collection of anti-malarial screening hits by NSG-SPT analysis. ACS Med. Chem. Lett., 2 (3), 201–206.
- 11 Schultz Kirkegaard, H. and Valentin, F. (2014) Academic drug discovery centres: the economic and organisational sustainability of an emerging model. Drug Discov. Today, 19 (11), 1699–1710.
- 12 Frye, S., Crosby, M., Edwards, T., and Juliano, R. (2011) US academic drug discovery. Nat. Rev. Drug Discov., 10 (6), 409–410.
- 13 Kozikowski, A.P., Roth, B., and Tropsha, A. (2006) Why academic drug discovery makes sense. Science, 313 (5791), 1235–1236.
- 14 Beck, B. and Geppert, T. (2014) Industrial applications of in silico ADMET. J. Mol. Model, 20 (7), 2322.
- 15 Hou, T. and Wang, J. (2008) Structure–ADME relationship: still a long way to go? Expert Opin. Drug Metab. Toxicol., 4 (6), 759–770.
- 16 Ekins, S. (2014) Progress in computational toxicology. J. Pharmacol. Toxicol. Methods, 69 (2), 115–140.
- 17 Moroy, G., Martiny, V.Y., Vayer, P. et al. (2012) Toward in silico structure-based ADMET prediction in drug discovery. Drug Discov. Today, 17 (1–2), 44–55.
- 18 Howe, D., Costanzo, M., Fey, P. et al. (2008) Big data: the future of biocuration. Nature, 455 (7209), 47–50.
- 19 Frye, S.V., Arkin, M.R., Arrowsmith, C.H. et al. (2015) Tackling reproducibility in academic preclinical drug discovery. Nat. Rev. Drug Discov., 14, 733–734.
- 20 Williams, A.J., Ekins, S., and Tkachenko, V. (2012) Towards a gold standard: regarding quality in public domain chemistry databases and approaches to improving the situation. Drug Discov. Today, 17 (13), 685–701.
- 21 Williams, A.J. and Ekins, S. (2011) A quality alert and call for improved curation of public chemistry databases. Drug Discovery Today, 16, 747–750.
- 22 Mansouri, K., Abdelaziz, A., Rybacka, A. et al. (2016) CERAPP: collaborative estrogen receptor activity prediction project. Environ. Health Perspect., 124 (7), 1023–1033.
- 23 Devillers, J. (2013) The twentieth anniversary of the creation of the SAR and QSAR in environmental research (SQER) journal. SAR QSAR Environ. Res., 24 (1), 1.
- 24 Mansouri, K., Grulke, C.M., Richard, A.M. et al. (2016) An automated curation procedure for addressing chemical errors and inconsistencies in public datasets used in QSAR modelling. SAR QSAR Environ. Res., 27 (11), 911–937.
- 25 Williams, A. (2015) From chemistry to biology database curation. Drug Discov. Today Technol., 14, 1–2.
- 26 Fourches, D., Muratov, E., and Tropsha, A. (2010) Trust, but verify: on the importance of chemical structure curation in cheminformatics and QSAR modeling research. J. Chem. Inf. Model., 50 (7), 1189–1204.
- 27 Fourches, D., Muratov, E., and Tropsha, A. (2015) Curation of chemogenomics data. Nat. Chem. Biol., 11 (8), 535.
- 28 Fourches, D., Muratov, E.N., and Tropsha, A. (2016) Trust, But Verify II: A Practical Guide to Chemogenomics Data Curation. J. Chem. Inf. Model., 56, 1243–1252.
- 29 Karapetyan, K., Batchelor, C., Sharpe, D. et al. (2015) The chemical validation and standardization platform (CVSP): large-scale automated validation of chemical structure datasets. J. Cheminform., 7 (1), 30.
- 30 Young, D., Martin, D., Venkatapathy, R., and Harten, P. (2008) Are the chemical structures in your QSAR correct? QSAR Comb. Sci., 27 (11–12), 1337–1345.
- 31 Kovatcheva, A., Golbraikh, A., Oloff, S. et al. (2004) Combinatorial QSAR of ambergris fragrance compounds. J. Chem. Inf. Comput. Sci., 44 (2), 582–595.
- 32 Zhu, H., Tropsha, A., Fourches, D. et al. (2008) Combinatorial QSAR modeling of chemical toxicants tested against tetrahymena pyriformis. J. Chem. Inf. Model., 48 (4), 766–784.
- 33 Tetko, I.V., Sushko, I., Pandey, A.K.A.K. et al. (2008) Critical assessment of QSAR models of environmental toxicity against tetrahymena pyriformis: focusing on applicability domain and overfitting by variable selection. J. Chem. Inf. Model., 48 (9), 1733–1746.
- 34 Golbraikh, A., Muratov, E., Fourches, D., and Tropsha, A. (2014) Data set modelability by QSAR. J. Chem. Inf. Model., 54 (1), 1–4.
- 35 Maggiora, G.M. (2006) On outliers and activity cliffs why QSAR often disappoints. J. Chem. Inf. Model., 46 (4), 1535.
- 36 Peltason, L., Hu, Y., and Bajorath, J. (2009) From structure–activity to structure–selectivity relationships: quantitative assessment, selectivity cliffs, and key compounds. ChemMedChem, 4 (11), 1864–1873.
- 37 Seebeck, B., Wagener, M., and Rarey, M. (2011) From activity cliffs to target-specific scoring models and pharmacophore hypotheses. ChemMedChem, 6 (9), 1630–1639.
- 38 Tropsha, A. (2010) Best practices for QSAR model development, validation, and exploitation. Mol. Inform., 29, 476–488.
- 39 Cherkasov, A., Muratov, E.N., Fourches, D. et al. (2014) QSAR modeling: where have you been? where are you going to? J. Med. Chem, 57 (12), 4977–5010.
- 40 Dearden, J.C., Cronin, M.T., and Kaiser, K.L. (2009) How not to develop a quantitative structure–activity or structure–property relationship (QSAR/QSPR). SAR QSAR Environ. Res., 20 (3–4), 241–266.
- 41 Golbraikh, A., Shen, M., Xiao, Z. et al. (2003) Rational selection of training and test sets for the development of validated QSAR models. J. Comput. Aided. Mol. Des., 17 (2–4), 241–253.
- 42 Mansouri, K., Abdelaziz, A., Rybacka, A. et al. (2016) CERAPP: collaborative estrogen receptor activity prediction project. Environ. Health Perspect., 124, 1023–1033. doi: 10.1289/ehp.1510267
- 43 Shukla, S. J.; Huang, R.; Austin, C. P.; Xia, M. The future of toxicity testing: a focus on in vitro methods using a quantitative high-throughput screening platform. Drug Discov. Today 15 (23–24), 997–1007.
- 44 Toxicity Testing in the 21st Century: A Vision and a Strategy. Committee on Toxicity Testing and Assessment of Environmental Agents, National Research Council, National Academy of Science. The National Academies Press: Washington, DC, 2007, pp. 1–216.
- 45 Dix, D.J., Houck, K.A., Martin, M.T. et al. (2007) The ToxCast program for prioritizing toxicity testing of environmental chemicals. Toxicol. Sci., 95 (1), 5–12.
- 46 Collins, F.S., Gray, G.M., and Bucher, J.R. (2008) Toxicology transforming environmental health protection. Science, 319 (5865), 906–907.
- 47 Judson, R., Richard, A., Dix, D.J. et al. (2009) The toxicity data landscape for environmental chemicals. Environ. Health Perspect., 117 (5), 685–695.
- 48 Kavlock, R., Chandler, K., Houck, K. et al. (2012) Update on EPA's ToxCast program: providing high throughput decision support tools for chemical risk management. Chem. Res. Toxicol., 25 (7), 1287–1302.
- 49 Richard, A.M., Judson, R.S., Houck, K.A. et al. (2016) ToxCast chemical landscape: paving the road to 21st century toxicology. Chem. Res. Toxicol., 29 (8), 1225–1251.
- 50 EPA (2016) ToxCast https://www.epa.gov/chemical-research/toxicity-forecaster-toxcasttm-data (accessed April 18, 2016).
- 51 Fielden, M.R., Brennan, R., and Gollub, J. (2007) A gene expression biomarker provides early prediction and mechanistic assessment of hepatic tumor induction by nongenotoxic chemicals. Toxicol. Sci., 99 (1), 90–100.
- 52 Uehara, T., Ono, A., Maruyama, T. et al. (2010) The Japanese toxicogenomics project: application of toxicogenomics. Mol. Nutr. Food Res., 54 (2), 218–227.
- 53 de Boer, J. and van Bavel, B. (2009) European “REACH” ( registration, evaluation, authorisation and restriction of chemicals) program. J. Chromatogr. A, 1216 (3), 301.
- 54 Luechtefeld, T., Maertens, A., Russo, D.P. et al. Global Analysis of Publicly Available Safety Data for 9,801 Substances Registered under REACH from 2008–2014. ALTEX 2016 (in press), doi: 10.14573/altex.1510052
- 55 Penzotti, J.E., Landrum, G.A., and Putta, S. (2004) Building predictive ADMET models for early decisions in drug discovery. Curr. Opin. Drug Discov. Dev., 7 (1), 49–61.
- 56 Stouch, T.R., Kenyon, J.R., Johnson, S.R. et al. (2003) In silico ADME/Tox: why models fail. J. Comput. Aided. Mol. Des., 17 (2–4), 83–92.
- 57 Sedykh, A., Zhu, H., Tang, H. et al. (2011) Use of in vitro HTS-derived concentration-response data as biological descriptors improves the accuracy of QSAR models of in vivo toxicity. Environ. Health Perspect., 119 (3), 364–370.
- 58 Zhu, H., Rusyn, I., Richard, A., and Tropsha, A. (2008) Use of cell viability assay data improves the prediction accuracy of conventional quantitative structure–activity relationship models of animal carcinogenicity. EnvironHealth Perspect, 116 (4), 506–513.
- 59 Rusyn, I., Sedykh, A., Low, Y. et al. (2012) Predictive modeling of chemical hazard by integrating numerical descriptors of chemical structures and short-term toxicity assay data. Toxicol. Sci., 127, 1–9.
- 60 Low, Y.S., Sedykh, A.Y., Rusyn, I., and Tropsha, A. (2014) Integrative approaches for predicting in vivo effects of chemicals from their structural descriptors and the results of short-term biological assays. Curr. Top. Med. Chem., 14 (11), 1356–1364.
- 61 Xia, M.; Huang, R.; Witt, K. L.; Southall, N.; Fostel, J.; Cho, M. H.; Jadhav, A.; Smith, C. S.; Inglese, J.; Portier, C. J.; Tice, R. R.; Austin, C. P. Compound cytotoxicity profiling using quantitative high-throughput screening. Environ.Health Perspect. 116 (3), 284–291.
- 62 Zhu, H., Ye, L., Richard, A. et al. (2009) A novel two-step hierarchical quantitative structure–activity relationship modeling work flow for predicting acute toxicity of chemicals in rodents. Environ. Health Perspect., 117 (8), 1257–1264.
- 63 Low, Y., Uehara, T., Minowa, Y. et al. (2011) Predicting drug-induced hepatotoxicity using QSAR and toxicogenomics approaches. Chem. Res. Toxicol., 24 (8), 1251–1262.
- 64 Low, Y., Sedykh, A.Y., Fourches, D. et al. (2013) Integrative chemical–biological read-across approach for chemical hazard classification. Chem. Res. Toxicol., 26, 1199–1208.
- 65 Shah, I., Liu, J., Judson, R.S. et al. (2016) Systematically evaluating read-across prediction and performance using a local validity approach characterized by chemical structure and bioactivity information. Regul. Toxicol. Pharmacol., 79, 12–24.
- 66 Yang, C., Tarkhov, A., Marusczyk, J. et al. (2015) New publicly available chemical query language, CSRML, to support chemotype representations for application to data mining and modeling. J. Chem. Inf. Model., 55 (3), 510–528.
- 67 Moore, K.D., Eyestone, K., and Coddington, D.C. (2013) The big deal about big data. Healthc. Financ. Manage., 67 (8), 60–66, 68.
- 68 Prinz, F., Schlange, T., and Asadullah, K. (2011) Believe it or not: how much can we rely on published data on potential drug targets? Nat. Rev. Drug Discov., 10 (9), 712.
- 69 Begley, C.G. and Ioannidis, J.P.A. (2015) Reproducibility in science: improving the standard for basic and preclinical research. Circ. Res., 116 (1), 116–126.
- 70 Begley, C.G. and Ellis, L.M. (2012) Drug development: raise standards for preclinical cancer research. Nature, 483 (7391), 531–533.
- 71 Ekins, S., Olechno, J., and Williams, A.J. (2013) Dispensing processes impact apparent biological activity as determined by computational and statistical analyses. PLoS One, 8 (5), e62325.
- 72 Baurin, N., Baker, R., Richardson, C. et al. (2004) Drug-like annotation and duplicate analysis of a 23-supplier chemical database totalling 2.7 million compounds. J. Chem. Inf. Comput. Sci, 44 (2), 643–651.
- 73 Veith, H., Southall, N., Huang, R. et al. (2009) Comprehensive characterization of cytochrome P450 isozyme selectivity across chemical libraries. Nat. Biotechnol., 27 (11), 1050–1055.
- 74 Kalliokoski, T., Kramer, C., Vulpetti, A., and Gedeck, P. (2013) Comparability of mixed IC50 data – a statistical analysis. PLoS One, 8 (4), e61007.
- 75 Fourches, D., Sassano, M.F., Roth, B.L., and Tropsha, A. (2013) HTS navigator: freely-accessible cheminformatics software for analyzing high-throughput screening data. Bioinformatics, 30, 588–589.
- 76 Fitzpatrick, J.M., Roberts, D.W., and Patlewicz, G. (2017) Is skin penetration a determining factor in skin sensitization potential and potency? Refuting the notion of a log Kow threshold for skin sensitization. J. Appl. Toxicol, 37 (1), 117–127.
- 77 Patlewicz, G., Casati, S., Basketter, D.A. et al. (2016) Can currently available non-animal methods detect pre and pro-haptens relevant for skin sensitization? Regul. Toxicol. Pharmacol., 82, 147–155.
- 78 Dumont, C., Barroso, J., Matys, I. et al. (2016) Analysis of the local lymph node assay (LLNA) variability for assessing the prediction of skin sensitisation potential and potency of chemicals with non-animal approaches. Toxicol. Vitr., 34, 220–228.
- 79 Clark, A.M., Ekins, S., and Williams, A.J. (2012) Redefining cheminformatics with intuitive collaborative mobile apps. Mol. Inform., 31 (8), 569–584.
- 80 Williams, A.J., Ekins, S., Clark, A.M. et al. (2011) Mobile apps for chemistry in the world of drug discovery. Drug Discov. Today, 16 (21–22), 928–939.
- 81 Ekins, S., Clark, A.M., and Sarker, M. (2013) TB mobile: a mobile app for anti-tuberculosis molecules with known targets. J. Cheminform., 5 (1), 13.
- 82 Ekins, S., Clark, A.M., and Wright, S.H. (2015) Making transporter models for drug–drug interaction prediction mobile. Drug Metab. Dispos., 43 (10), 1642–1645.
- 83 Clark, A.M., Dole, K., Coulon-Spektor, A. et al. (2015) Open source Bayesian models. 1. Application to ADME/Tox and drug discovery datasets. J. Chem. Inf. Model, 55 (6), 1231–1245.
- 84 Clark, A.M. and Ekins, S. (2015) Open source Bayesian models. 2. Mining a ‘big dataset’ to create and validate models with ChEMBL. J. Chem. Inf. Model, 55 (6), 1246–1260.
- 85 Egeghy, P.P., Judson, R., Gangwal, S. et al. (2012) The exposure data landscape for manufactured chemicals. Sci. Total Environ., 414, 159–166.
- 86 Mitchell, J., Arnot, J.A., Jolliet, O. et al. (2013) Comparison of modeling approaches to prioritize chemicals based on estimates of exposure and exposure potential. Sci. Total Environ., 458–460, 555–567.
- 87 Crinnion, W.J. (2010) The CDC fourth national report on human exposure to environmental chemicals: what it tells us about our toxic burden and how it assist environmental medicine physicians. Altern. Med. Rev., 15 (2), 101–109.
- 88 Sobus, J.R., DeWoskin, R.S., Tan, Y.-M. et al. (2015) Uses of NHANES biomarker data for chemical risk assessment: trends, challenges, and opportunities. Environ. Health Perspect., 123 (10), 919–927.
- 89 LaKind, J. S.; Goodman, M.; Naiman, D. Q. Use of NHANES data to link chemical exposures to chronic diseases: a cautionary tale. PLoS One 2012, 7 (12), e51086.
- 90 Gangwal, S., Reif, D.M., Mosher, S. et al. (2012) Incorporating exposure information into the toxicological prioritization index decision support framework. Sci. Total Environ., 435–436, 316–325.
- 91 Wambaugh, J.F., Wang, A., Dionisio, K.L. et al. (2014) High throughput heuristics for prioritizing human exposure to environmental chemicals. Environ. Sci. Technol., 48 (21), 12760–12767.
- 92 Wambaugh, J.F., Setzer, R.W., Reif, D.M. et al. (2013) High-throughput models for exposure-based chemical prioritization in the ExpoCast project. Environ. Sci. Technol., 47 (15), 8479–8488.
- 93 Wallace, L.A., Pellizzari, E.D., Hartwell, T.D. et al. (1986) Total exposure assessment methodology (team) study: personal exposures, indoor–outdoor relationships, and breath levels of volatile organic compounds in New Jersey. Environ. Int., 12 (1), 369–387.
- 94 Isaacs, K.K., Glen, W.G., Egeghy, P. et al. (2014) SHEDS-HT: an integrated probabilistic exposure model for prioritizing exposures to chemicals with near-field and dietary sources. Environ. Sci. Technol., 48 (21), 12750–12759.
- 95 Goldsmith, M.-R., Grulke, C.M., Brooks, R.D. et al. (2014) Development of a consumer product ingredient database for chemical exposure screening and prioritization. Food Chem. Toxicol., 65, 269–279.
- 96 Dionisio, K.L., Frame, A.M., Goldsmith, M.-R. et al. (2015) Exploring consumer exposure pathways and patterns of use for chemicals in the environment. Toxicol. Rep., 2, 228–237.