Chapter 9
Get Published: Testing, Deploying and Distributing Your Applications
The chapters thus far have taken you through everything from introducing the devices, the software development kits, the language, and the tools to a series of chapters on how to write your first iOS mobile device-based application. This knowledge culminates with you having an application, or even a library, that you will want to test, deploy, and publish—typically in that order. In this chapter you'll use the features of Xcode 4 and the iOS Simulator to thoroughly test your application. You'll also test it on a real device before you learn how to deploy and publish your application through the App Store. Specifically, you'll be looking at the following:
- Introduction to the testing features available to you.
- Overview of Xcode 4 and the iOS Simulator's testing capabilities.
- How to deploy your application.
- Preparing to publish your application.
- Publishing via the App Store.
Available Test Features
There are a number of tools and techniques available to you for testing your application, some with very advanced features. At a high level, you typically use a combination of discrete unit based tests plus broader system-wide testing on both virtual (the simulator) and physical (a real one) devices to ensure that your applications work. You'll look at these in turn.
Unit Testing
While creating your example projects and source code files, you may have noticed a checkbox titled “Include Unit Tests.” An example is shown in Figure 9–1 when creating a simple utility-based application called Calculator.
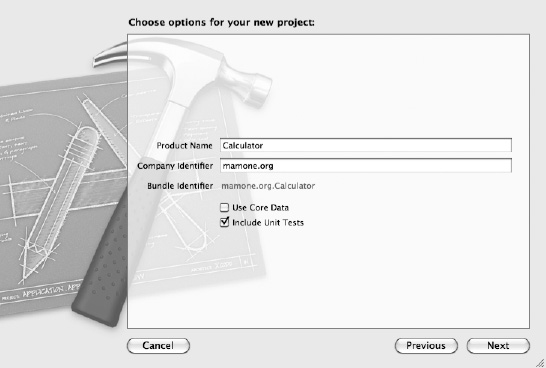
Figure 9–1. Creating a project with unit tests
After your project has been created, you'll notice a folder (in addition to those that are typically created) with the format of <project name>Tests. In this case, that folder is called CalculatorTests; exploring this folder will display a header and implementation file of the same name, which is provided for you to implement your unit tests.
Defining Your Testing Approach
As you're already a seasoned .NET professional, the concept of unit testing will be familiar to you. However, how Xcode embraces this will not, and perhaps other testing concepts such as integration testing or even Test Driven Development may be new to you also. Let's take a brief tour through these terms before you look at Xcode's support.
Unit Testing
To ensure a baseline of understanding, let's briefly recap the term unit test. A unit test is code written specifically to test a particular part of your application's code. In the world of testing you'll have a series of test cases that assert that the module you are running is behaving as expected. For example, if a method was written to add two numbers, you may have test cases that check if the addition is performed correctly and that if you pass invalid parameters it handles such a circumstance elegantly.
This is no different in any other language, certainly not when writing .NET based applications. In the days before Visual Studio supported unit testing or before it even existed, it was common practice to use tools such as NUnit to implement unit tests (Java uses JUnit). Thankfully, Visual Studio has caught up and has a plethora of testing capability including a Unit Test framework with unit tests much like Xcode 4 (but I would argue even more advanced).
Integration Testing
Unit testing is, of course, only the start of your testing journey. It helps to test discrete units of code, but when your application starts to link these together, you're into the realm of integration testing. The key distinction between integration and unit testing is that unit testing usually supposes the quite simplistic stand-alone testing of single “units” and does not require more complex test environments or tools. Xcode doesn't make any specific provision for integration testing, other than writing your own unit tests that integrate other unit tests, but other options are available to you. For example, iCuke allows you to write integration tests without any changes to your application. iCuke uses Cucumber, a behavior-driven test environment (see more in the “Test Driven Development” section) to implement its functionality. Both are fairly complex products and not the core scope of this book, but I recommend you take a look at them. You can find more information on iCuke at https://github.com/unboxed/icuke, and Cucumber at http://cukes.info/.
Test Driven Development
You've now looked at tools that support concepts such as integration testing but rather than focus on testing the code's implementation, an alternative is to look at the functionality or behavior expected. In this example, you start by writing the test case in the first instance, articulating its behavior. Specialist products such as iCuke and Cucumber do this, but you can achieve a more limited Test Driven Development approach using Xcode.
Again, Test Driven Development (TDD) involves writing test cases before any production code. In Xcode, you'd achieve this by generating your class with unit testing support included, but focus on writing your unit tests in the first instance by calling your empty class implementations. These tests will fail initially, but as you implement your class, these should pass if they demonstrate the required behavior.
Given the importance of using unit tests as building blocks for a number of test strategies, let's take a look at how to implement them usingXcode.
Writing and Running Your Unit Tests
So, having created your project with unit tests, you need to perform a series of steps to implement your tests. If you examine the example implementation file provided, you'll notice two methods for processing code before the test begins (setup) and then after the test has concluded (teardown). It also provides an example method for you to change as its default implementation— the method STFail(), indicating that tests have yet to be implemented.
At this point, rather than creating unit tests for the Lunary Lander game, let's focus on a much simpler example to convey the methods and tools. For this simple example, you create a very simple Calculator class with a Header and Implementation file and a single method called add() that returns the addition of the two numbers passed. First you'll define your class declaration as shown in Listing 9-1.
Listing 9-1 . Calc.h
#import <Foundation/Foundation.h>


@interface Calc : NSObject {

}

- (int) add:(int)num1 to:(int)num2;


@end
Next you'll add your implementation of the class, as shown in Listing 9-2.
Listing 9-2. Calc.m
#import "Calc.h"


@implementation Calc


- (int) Add:(int)num1:(int)num2

{

    return (num1+num2);

}


@end
You then implement your unit tests by providing an implementation for the test cases, changing the testExample() method to test the add() method. You can see the example implementation in Listing 9-3.
Listing 9-3. UnitTest Implementation
#import "CalculatorTests.h"


@implementation CalculatorTests


- (void)setUp

{


    [super setUp];


    // Set-up code here.

}


- (void)tearDown

{

    // Tear-down code here.


    [super tearDown];

}


- (void)testExample

{

    Calc *calculator = [[Calc alloc] init];

    int v = [calculator add:5 to:5];

    if (v != 10)

        NSLog(@"add is not working");

    else

        NSLog(@"add is working");

    [calculator release];

}
So, ensuring that you're building against the iOS Simulator, you can now choose to test your product by choosing “Build for Testing” from the Product menu or using the shortcut key combination (![]() U). This will build your application and include the necessary debug information, which when executed for testing using the Test option or shortcut combination of (
U). This will build your application and include the necessary debug information, which when executed for testing using the Test option or shortcut combination of (![]() U) will execute your application and the unit test cases selected (more on this in a minute), outputting a whole bunch of diagnostic information to your debug log from the unit test code. In the example, using the Log navigator (
U) will execute your application and the unit test cases selected (more on this in a minute), outputting a whole bunch of diagnostic information to your debug log from the unit test code. In the example, using the Log navigator (![]() 7), you can jump to the log file for your executed tests. The log should display something similar to the following output. Your testExample method's specific output is in bold.
7), you can jump to the log file for your executed tests. The log should display something similar to the following output. Your testExample method's specific output is in bold.
Test Suite 'All tests' started at 2011-08-20 11:06:32 +0000

Test Suite '/Developer/Platforms/iPhoneSimulator.platform/Developer/SDKs/

iPhoneSimulator4.3.sdk/Developer/Library/Frameworks/SenTestingKit.framework(Tests)'

 started at 2011-08-20 11:06:32 +0000

Test Suite 'SenInterfaceTestCase' started at 2011-08-20 11:06:32 +0000

Test Suite 'SenInterfaceTestCase' finished at 2011-08-20 11:06:32 +0000.

Executed 0 tests, with 0 failures (0 unexpected) in 0.000 (0.000) seconds


Test Suite '/Developer/Platforms/iPhoneSimulator.platform/Developer/SDKs/

iPhoneSimulator4.3.sdk/Developer/Library/Frameworks/SenTestingKit.framework(Tests)'

finished at 2011-08-20 11:06:32 +0000.

Executed 0 tests, with 0 failures (0 unexpected) in 0.000 (0.001) seconds


Test Suite '/Users/mamonem/Library/Developer/Xcode/DerivedData/

Calculator-ecegbkyjngnxqjgpddxmtkxtvkzp/Build/Products/Debug-iphonesimulator/

CalculatorTests.octest(Tests)' started at 2011-08-20 11:06:32 +0000

Test Suite 'CalculatorTests' started at 2011-08-20 11:06:32 +0000

Test Case '-[CalculatorTests testExample]' started.

2011-08-20 12:06:32.581 Calculator[791:207] Add is working

Test Case '-[CalculatorTests testExample]' passed (0.001 seconds).

Test Suite 'CalculatorTests' finished at 2011-08-20 11:06:32 +0000.

Executed 1 test, with 0 failures (0 unexpected) in 0.001 (0.001) seconds


Test Suite '/Users/mamonem/Library/Developer/Xcode/DerivedData/

Calculator-ecegbkyjngnxqjgpddxmtkxtvkzp/Build/Products/Debug-iphonesimulator/

CalculatorTests.octest(Tests)' finished at 2011-08-20 11:06:32 +0000.

Executed 1 test, with 0 failures (0 unexpected) in 0.001 (0.003) seconds


Test Suite 'All tests' finished at 2011-08-20 11:06:32 +0000.

Executed 1 test, with 0 failures (0 unexpected) in 0.001 (0.006) seconds
You can see from the diagnostic information there are many performance-related timings, allowing you to see how performant your methods are. Additionally, you can implement many test cases within your code and are not limited to the single testExample() method. Just go ahead add more methods, each representing a particular test case.
But what if you don't want to execute ALL the test cases every time you test your application? What if you want to test only one or two? This is expected and easily provided for within Xcode. Simply edit your project scheme using the Scheme editor (![]() <), which will display the dialog box that allows you to manage a number of aspects of your application, including the tests performed. Choose the test item in the left-hand panel, and you'll see the tests you can choose from (see Figure 9–2).
<), which will display the dialog box that allows you to manage a number of aspects of your application, including the tests performed. Choose the test item in the left-hand panel, and you'll see the tests you can choose from (see Figure 9–2).

Figure 9–2. Choosing which tests to execute from the Scheme editor
Using this dialogue box, you can choose which of the unit tests are executed when you test your application. Select those that you wish to run using the checkbox provided against each test. When you've selected those tests you wish to take place, select the OK button; this will save your scheme, meaning that when executing your application, these unit tests will be executed. You can then use the Log navigator to examine the output and the test results.
Using the Xcode 4 Debugger
So now you know some of the debugging capabilities of Xcode 4 through the generation and use of unit tests. However, it can do much, much more. The really advanced features such as profiling will be covered a little further into the chapter, so let's take a look at some other slightly less advanced features that are incredibly useful when testing your application.
Xcode 4 features a debugger with very similar capabilities to that of Visual Studio or other integrated development environments. It allows you to place breakpoints in your code—specific points at which execution stops for you to examine your application's state. Breakpoints allow you to walk through your code line by line and examine all aspects of your application's execution including variables, their values, etc. This works when running your application or testing it.
NOTE: When debugging your application, you must compile it for debug output. This lets the compiler add additional information to your code that allows you to perform the debugging features. It also adds a considerable size to your compiled code, so remember to switch it off by compiling your application for Release when you deploy your application.
So, let's use the previous example and ensure that you are building for debug. In the CalculatorTest.m implementation file, let's add a breakpoint. This can be done by simply clicking in the gutter to the left of your source code window. Doing so will place a dark blue breakpoint indicator in the gutter, indicating that your code will stop here when debugging. In Figure 9–3 you can see a breakpoint in the gutter; you can also see other breakpoints that were previously been added but are switched off and inactive. These are indicated by a lighter blue breakpoint indicator and can be re-activated simply by clicking them.
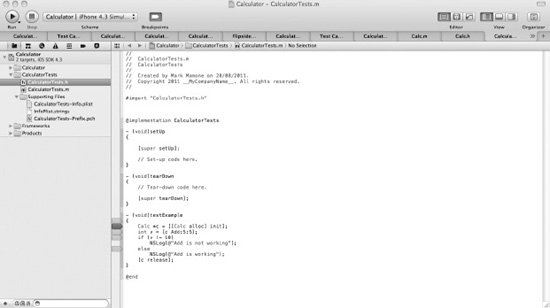
Figure 9–3. Breakpoints, both active and inactive, in the code window gutter
Once breakpoints have been added, you can build your application for testing (![]() U) as before and then test your application (
U) as before and then test your application (![]() U). Your application will launch in the simulator as before. Your unit tests will start to output debug text to the log file, but your application will stop at the breakpoint. When it does this, it will also display the Debug window automatically at the bottom of your screen. This is shown in Figure 9–4.
U). Your application will launch in the simulator as before. Your unit tests will start to output debug text to the log file, but your application will stop at the breakpoint. When it does this, it will also display the Debug window automatically at the bottom of your screen. This is shown in Figure 9–4.
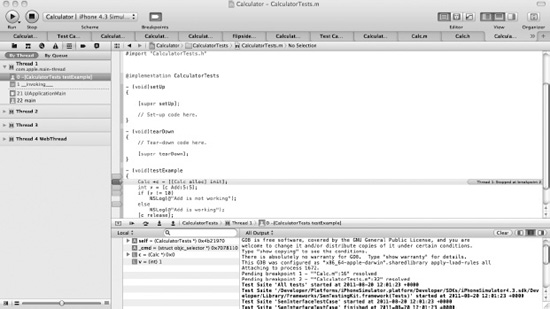
Figure 9–4. Application stopping at a breakpoint and showing the Debug window
The left-most pane shows the navigator windows, which when debugging default to the Thread pane, showing threads (that is parallel units of code execution) of your application and their call stack, with the Debug window below the code pane. The Debug window shows the local variables in the Local pane, which can be explored simply by navigating through them. The application's output is sent to the Console window, stored in a log file, but shown in the Output pane, which can be unfiltered (All Output), of filtered by Debugger output or the Target output.
The header bar for the debug window allows you control how you navigate through your code. Having hit the breakpoint, the icons have the meanings defined in Table 9-1.

You can also use the search box to look for/filter the variables you may wish to examine.
Using the debugger, defining strategic breakpoints, and examining variable values, you can quickly decide whether the path of execution your application takes is as expected; more importantly, you can also look how variables are being initialized and whether this is as you intended.
Finally, if you wish to remove all breakpoints, active or inactive, use the Breakpoint Navigator (![]() 6) to see all breakpoints defined in one place and remove them or activate them. This can be seen in Figure 9–5.
6) to see all breakpoints defined in one place and remove them or activate them. This can be seen in Figure 9–5.

Figure 9–5. Breakpoint Navigator
Other Debugging Options
There are other options available to you when debugging your application—not just traditional techniques such as using the console to output debug text, but advanced features such as Profiling. Let's look at them next.
Using NSLog to Capture Diagnostics
Using the Xcode 4 tool to debug your application is easy and feature rich—much the same as using tools in the .NET environment, such as in Visual Studio. Before such tools were available, you were far more limited, but some of the older tools can still be useful. For example, you may still find it convenient to add some debug code to your application that simply outputs some diagnostic information to the Debug window. This might be appropriate if you don't want to go to the extent of creating unit tests and simply want some detail diagnostics in real time.
In Objective-C, you can use the NSLog command to send diagnostic text to the Debug window (also known as the Console window) and include variable values through parameter substitution.
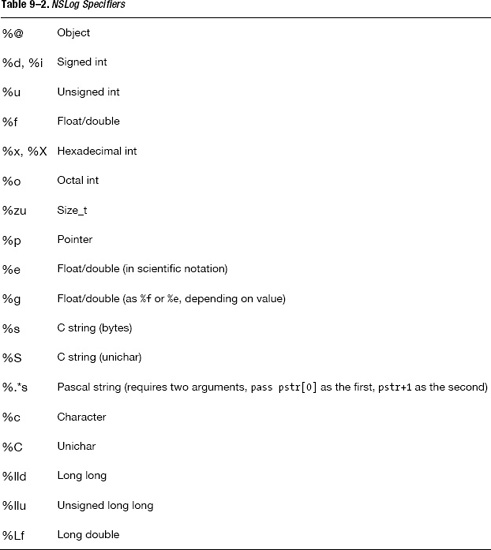
NSLog works like sprintf() works in C/C++ languages, or like Debug.WriteLine in .NET within the System.Diagnostics namespace. This method takes a string, within which “specifiers” are defined and substituted by the parameters you pass to the method following the string declaration. Substitution of the specifiers occurs in the order you pass them. The specifiers are show in Table 9-2.
Profiling Your Application
Profiling goes beyond simple testing and allows you to use the advanced features of Xcode 4 to find detailed code errors such as memory leaks or why a particular piece of code may be running slowly. A full explanation of the Profiler is beyond the scope of this chapter as it's a complex topic and feature-rich tool. However, it's worth considering it at a high level. You can refer to a more advanced reference guide or the iOS Developer Library if you choose to implement profiling in your applications.
Your application should be built for profiling (![]() I) beforehand to ensure that all the necessary instrumentation is available. To launch the profile, you can choose Profile from the Product menu or use the
I) beforehand to ensure that all the necessary instrumentation is available. To launch the profile, you can choose Profile from the Product menu or use the ![]() I shortcut with the application open in Xcode. Once launched, the Profiler will look like that shown in Figure 9–6.
I shortcut with the application open in Xcode. Once launched, the Profiler will look like that shown in Figure 9–6.
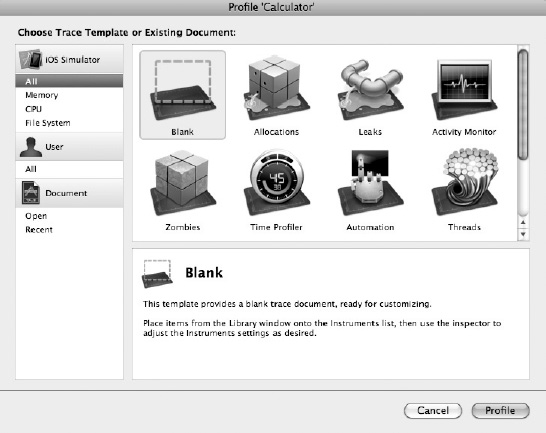
Figure 9–6. Profiling with all its options visible
The tool provides a number of templates that are tailored to understanding your application in a specific manner, whether looking for memory leaks, timing the execution of your code, or looking at how memory is allocated. The amount of data it collects and makes available is immense—comparable with the many .NET-based profiling tools on the market—and it's free in Xcode 4.
Let's take a quick look at one profile template as an example; the most obvious would be the Leaks profile, a common one to use. Select this template for a simple project (see Figure 9–6), such as the Calculator application, and select Profile (the screen in Figure 9–7). The application is running in the Profiler and all allocations are displayed.
NOTE: While profiling provides a number of useful templated instruments such as Memory Leaks, if you're using Automatic Reference Counting (ARC), memory leaks will be a thing of the past.

Figure 9–7. Profiler with All Allocations displayed
If you switch to the Leaks view, you will be presented with a specific view of where memory leaks have been detected. In Figure 9–8, you'll see that the default Calculator application has no leaks, as a good program shouldn't.
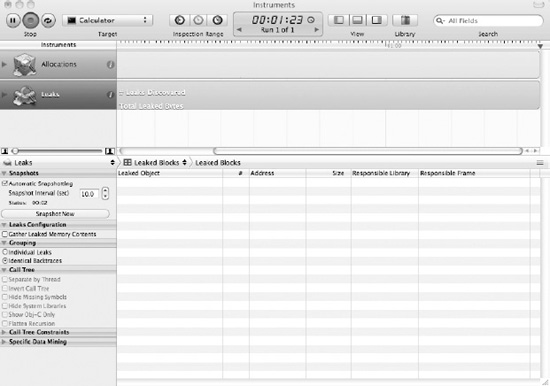
Figure 9–8. Leaks view within the Profiler with no leaks
Not much of a test, so let's be naughty! Let's declare a simple UIImage member variable, allocate memory, and initialize the object with this line:
UIImage *img = [[UIImage alloc] init ];
But don't add the corresponding release statement. Now rebuild your application for profiling and view the Profiler. It should present a screen similar to that in Figure 9–9 when you select the same Leaks view.
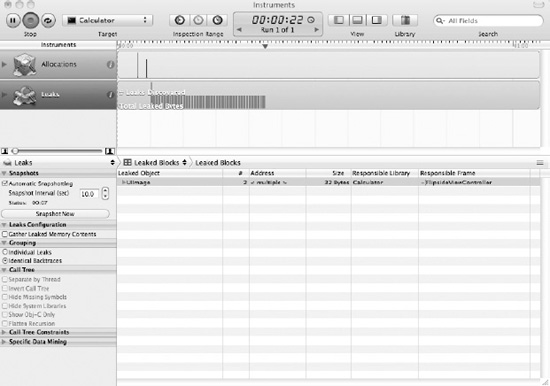
Figure 9–9. Profiler displaying memory leaks
You can clearly see that memory leaks have been detected, as expected; it highlights what type of object is leaking, how much is being leaked, and which library and which view is leaking it. All of this information is invaluable in tracing the fault.
The Profiler and its other templates provide similar detailed information allowing you to fine tune or just understand how your application is executing in minute detail.
Play around some more. This is a great tool for learning the inners of your code, the iOS, and its SDK.
NOTE: You may find profiling useful if you choose to complete your Lunar Lander application. See Appendix A for a discussion on how to complete the game.
Using the Simulator's Debug Features
So, you can do quite a lot with Xcode 4 around debugging, but there are some things that are not possible, especially if they are specific to the device. For example, how do you test how your application behaves to a change in orientation, or how your application scopes with lack of memory? The features of Xcode 4 don't help you with simulating such things. Thankfully, however, the simulator itself has a number of debugging features of its own.
When the simulator is open, the debugging features are located under the Hardware menu. Let's go through them one by one.
Changing the Device
An obvious but useful feature is the ability to change the actual device type. Under the Device menu are options to simulate the iPad and the iPhone, including iPhone 4 Retina versions and other iOS versions provided as part of the iOS SDK, although excluding the iPod Touch. Simply choose the device type you want and the simulator will respond by displaying the relevant device and simulating it.
Changing the iOS Version
The next useful feature is to simulate different versions of the iOS. The SDK comes with the different supported versions of the iOS up to the point the SDK was released, so SDK 4.3 includes all versions of the iOS from 3.2 to 4.3. This is useful for backward compatibility testing against the device and iOS combinations your application targets.
Simulating Movement
Clearly, if you had the physical device, then you could test rotating it and shaking it. This is not so easy with a simulated device. You can rotate your Mac and shake it all you want—it won't help. However, the simulator provides menu options to both rotate the device to the left and right, and to simulate a shake gesture, all so that you can cope with such events in your application and test them in the simulator.
Triggering Low Memory
Your mobile device has a finite amount of memory, and every time you open an application, it will consume some of that memory. Unless you specifically choose to close the application down using the double-click of the Home button, that memory will remain used if you're using iOS 4.0 or above. On the older versions of the iOS, the applications did not retain memory as multitasking wasn't supported. So at some point your application might hit low memory, and it knows this because the iOS sends a low memory event (the didReceivedMemoryWarning event) to your application for it to handle. On receiving this event, you may choose to cope with it by releasing resources you no longer need or can afford to reload, for example.
To trigger such an event in the simulator, you can select the Simulate Memory Warning menu item to fire the event into your application so you can test its response.
Other Features
There are some additional features that aren't really related to debugging your application but act as shortcuts or assistants to the whole testing process. For this reason, I'll mention them for completeness.
- Home simulates pressing the home button.
- Lock simulates locking your device.
- Toggle In-Call Status Bar switches on the in-call status bar, thus reducing the user interface space.
- Simulate Hardware Keyboard switches your Mac keyboard to the keyboard for your iPhone device. It's good for entering text into your application.
- TV Out sends the output to the TV Out port of your Mac using the resolution chosen under this option.
Testing on Real Devices
TheiOS Simulator is an amazingly useful tool, especially for quickly testing your applications on a number of different devices and iOS versions. But it's important to understand that testing on the simulator alone is insufficient. For example, if you want to test the real-world performance of a device with multiple applications running and varying external conditions such as poor signal strength (whether it be Wi-Fi, GPRS, 3G or GSM), then there really is no substitute for testing on a real device.
So, while I encourage you to use the simulator, be sure to test your applications on all devices you intend to target and under a variety of real-world scenarios. You can do this by following the instructions that follow on application deployment, but this does require you to be a signed up and paid member of the Apple Developer Program.
Some of the real-world considerations you might consider when testing your application are as follows:
- Signal Strength: I've touched on this but your wireless network connection (Wi-Fi) or your mobile signal, whatever you might be using, will not always be at full strength, and if your application relies on this kind of network connectivity, you should test different signal-strength scenarios.
- User Interface: Consider what your application's user interface looks and feels like, especially when using gestures, and consider the different characteristics of the human tester. For example, get different people to use it (sometimes called usability testing).
- Speed: Try your application out, not just running on its own, but with other applications running. You can trigger low memory within the simulator, but you can proactively restrict device memory above this. Real-world performance testing is important for this very reason.
Also consider testing your application beyond your own individual testing. For example, it's not unusual to offer a beta program where you offer a limited distribution of your application to beta testers who get the application for free but provide you with feedback.
Deploying Your Application
To deploy your application to a device, any device, you need to sign it; that is, you need to add a digital certificate to your application that proves its authenticity. The iOS on your device will check all applications' authenticity before they are executed. This is a security measure to make sure that no applications make their way onto your device that might cause harm.
So, you need to sign your application, but it's not quite as straightforward as that. As explained earlier in the book, Apple requires that you are a registered and paid-up member of its iOS Developer Program in order for you to sign and submit your application. Thus, in order for you to deploy your application to your iOS device and submit it to Apple's App Store, you will need to join the program at a cost of $99. This will allow you to test your applications directly on the iPhone device and also enables support for ad hoc distribution and for you to publish to Apple's App Store.
NOTE: You will probably know that you can jailbreak your iPhone device; this removes such restrictions and allows you to install applications directly onto your device using a variety of different tools. However, since Apple frowns on such activity, we are not going to promote it in this book. We will leave this for you to investigate if it's something you are interested in. Be warned: requiring a jailbrokeniOS device will limit your distribution options.
Let's go ahead and complete some of the remaining tasks in order to allow you to provision applications to both your mobile device and the App Store. Most of this can be done from the Provisioning page, which you access by selecting the iOS Provisioning Portal in the Member Center, shown in Figure 9–10.

Figure 9–10. Apple Member Center
The Member Center also provides a number of useful resources, including technical support.
Creating a Certificate to Sign Your Application
The provisioning page allows you to upload a certificate request from your computer for it to authorize. You can subsequently use this certificate to sign your applications. To create this request, open the Keychain application from the Utilities folder within your Applications. Once launched, select the “Request a Certificate from a Certificate Authority” option from the menu, as shown in Figure 9–11.
Follow the on-screen instructions and enter your name and e-mail address, choosing to save the request to disk. You'll need this file for the Provisioning page.
Once saved, go back to the Certificates section of the Provisioning Portal. Under the Development tab, you'll notice instructions on how to complete the process and an option to upload your request complete with a Choose File button. Select this, and then point it at the file you just saved from the Keychain request. This will upload the request to Apple for processing. Initially it will show as Pending, but in a relatively short space of time, it will be processed and its status changed to Issued, as shown in Figure 9–12.
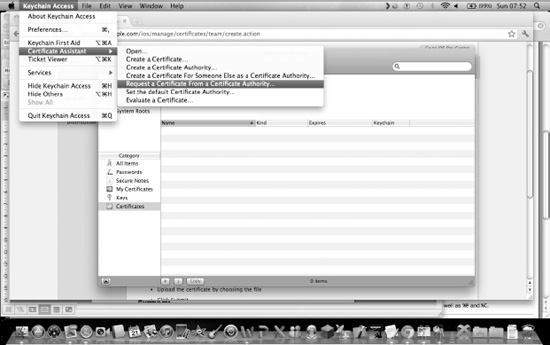
Figure 9–11. Requesting a certificate using Keychain

Figure 9–12. Issued Certificate on the provisioning page
You can now download this certificate and install it within your Keychain by simply double-clicking it and following the on-screen instructions.
Registering Your Device
Next, you will need to register your mobile device for development. Again, this can be done through the Provisioning Portal. First, you'll need the Unique ID of your device. You can use the Devices section in Xcode 4's Organizer to retrieve this ID. With your device connected to your computer, launch Xcode 4 and it will automatically take you to this page, showing the Unique ID that you need. You can see this in Figure 9–13.

Figure 9–13. Using Xcode's Organizer to retrieve your device's Unique ID
Make a note of this device ID, and then go back to the Provisioning Portal and the Devices page. Here you can choose the Add Devices button, shown in Figure 9–14, and enter a name for the device (which can be whatever you want) and the Unique ID, taken from the Xcode screen. Complete this screen and your device will be registered within the Provisioning Portal.
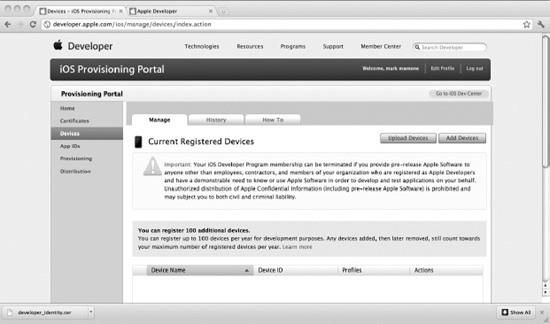
Figure 9–14. Registering a device
You may have noticed the Use for Development button on the Xcode Organizer screen, suggesting it will allow you to use the device for development. Xcode has the ability to create, download, and install on your behalf a Developer Certificate, Distribution Certificate, and a basic Developer Provisioning Profile (known as the Team Provisioning Profile), all with the click of a button.
So, go back to the Organizer screen and choose this option by selecting this button and following the simple on-screen instructions, which simply prompt you for passwords at certain stages. Once complete, your device will be registered under Xcode for development.
Using the Provisioning Portal to Get Started
The Provisioning Portal also provides a Launch Assistant to help you to install the necessary certificates and create the required provisioning profiles, allowing you to start to build applications. It's pretty straightforward and accessed from the Provisioning Portals home page, but I'll take you through it for completeness and to explain some points. First, select Home on the Provisioning Portal and choose the Development Provisioning Assistant. You'll be presented with the screen shown in Figure 9–15 where you will create an App ID.
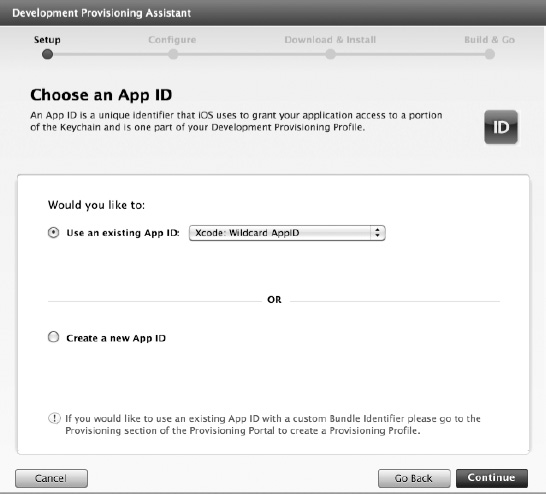
Figure 9–15. Creating an App ID
The first step is to create an App ID, a unique ID associated with your application. You can choose to create an App ID here manually or select the wildcard option from the list that automatically chooses an App ID for any app you deploy. Unless you specifically want to associate a single App ID with multiple apps, I suggest you choose this option.
Pressing Continue will take you to the next stage, shown in Figure 9–16.
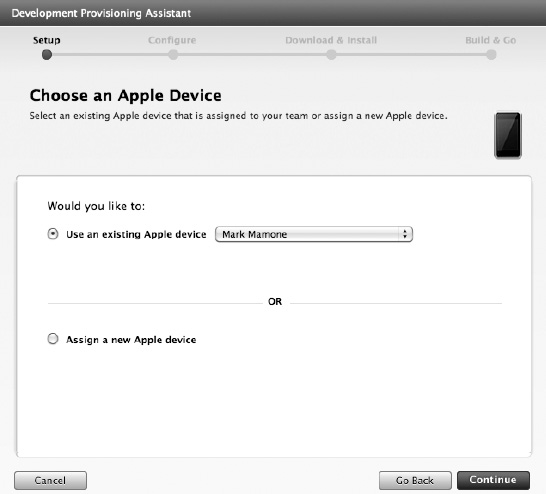
Figure 9–16. Choosing an Apple Device
This stage involves choosing the device you wish to use. Because I've already registered mine, it appears in the Use an existing Apple device list. If it's your only registered device, it is automatically selected. So leave it as is and move on using the Continue button.
The Development Certificate screen in Figure 9–17 opens.
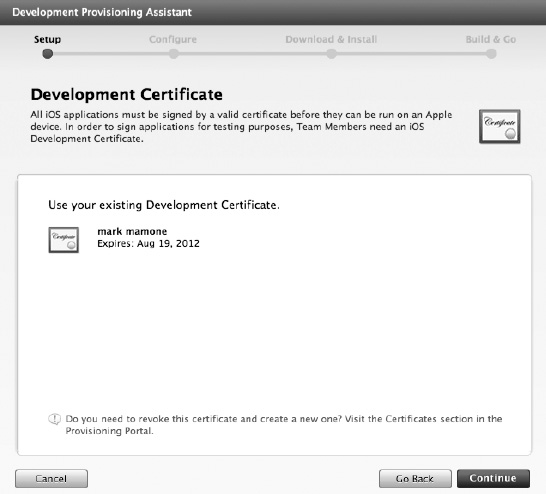
Figure 9–17. Choosing a Development Certificate
This step involves choosing your iOS Development Certificate, which again should already exist from the previous steps. Leave this screen with your existing Development Certificate selected and again move on using the Continue button. The Provisioning Profile page will be displayed next, seen in Figure 9–18.
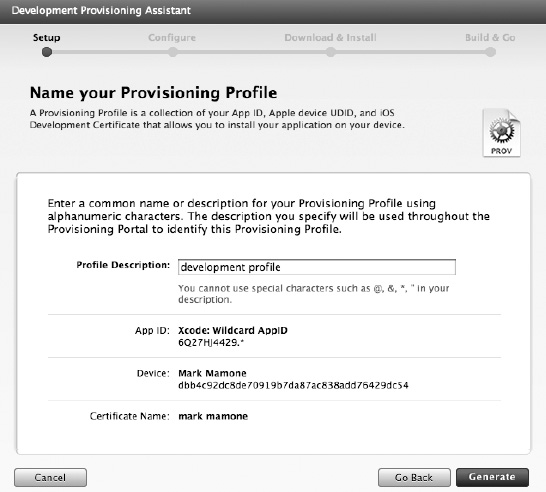
Figure 9–18. Provisioning Profile page
A Provisioning Profile is a collection of data collected under a named profile and required for you to install applications on your device. On this screen, give your profile a name and the rest is auto-populated. Then choose the Generate button, which will generate the profile. When complete, you'll see a screen similar to that in Figure 9–19.
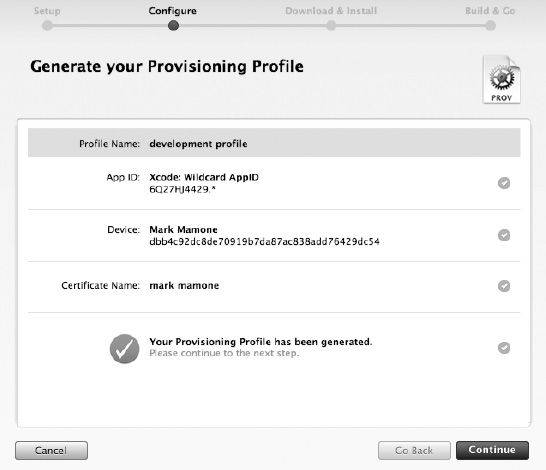
Figure 9–19. Provisioning Profile generated
You can then continue. You'll be presented with instructions on how to install the Provisioning Profile, shown in Figure 9–20.
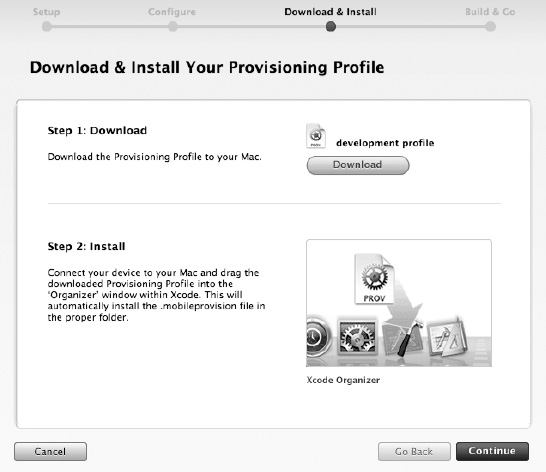
Figure 9–20. Installing your Provisioning Profile
Follow these instructions and your Provisioning Profile will be installed. Finally, check that the installation has completed by looking in Xcode's Organizer to see that the profile is present. It should be from the work Xcode has already done anyway.
Build and Deploy Your Application
So you've done all the preparatory work. Now let's build an application and deploy it on your device. Open up an application you wish to deploy in Xcode. I started with the initial Hello World program, but in your case it will be the application you wish to deploy. In Xcode, the main thing you need to do is to sign the application. Remember all the steps you went through to create the certificates and Provisioning Profile?
So, open up your application and select Build Settings in the main pane (see Figure 9–21). In the Code Signing section, choose an appropriate profile; given I'm still developing, I chose my development profile but if you were targeting the App Store or Adhoc provisioning (more on these later), then you would choose profiles that reflect this.
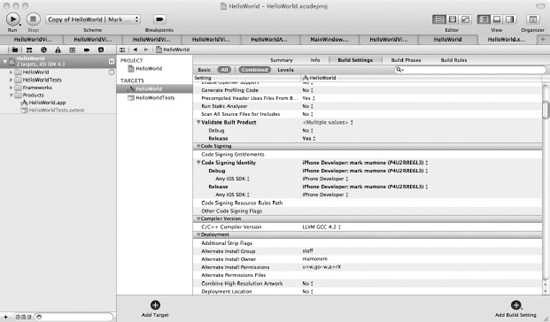
Figure 9–21. Signing your application in Xcode
At this point, before you build your application, check that your application identifier is correct under Summary. This identifies the application on your device. In Figure 9–22 you can see I've added one that includes my domain and the application's title.
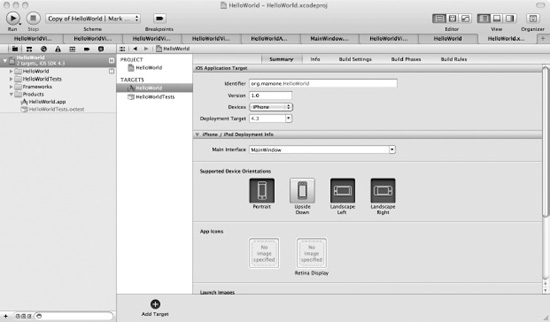
Figure 9–22. Adding your Application's Identifier
Now go ahead and build your application, ensuring that your target scheme in Xcode is for your target device and not left on the simulator. Also check that your application icon is included as an icon.png file and the filename is included within your info.plist file by using the Icon file setting under the Info tab. When you start to build your application, you will be prompted to accept its request to sign the application using your Keychain certificate. Accept this request, and allow the build to complete and the signing of your application to happen. You now have an application built and ready for deployment.
To deploy your application on your device, open up the Xcode Organizer and select your device in the left hand pane; you'll notice that an Applications option exists. You can see this and the installed application in Figure 9–23.
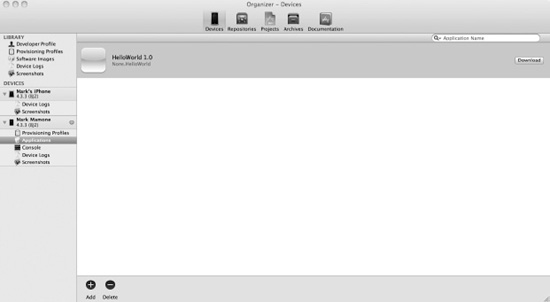
Figure 9–23. Xcode's Organizer with Device and Applications
At the bottom of the Applications pane you will notice two options, Add and Delete. These allow you to add or delete an application from your device. Choose Add. At the dialogue that requests you locate application to add, point it at the Hello World application binary that you just built in Xcode. Alternatively, you can drag the executable onto this page. In either case, this will install the application to your device. Take a look at your mobile device when complete and you should see your application there, ready to test!
You have now built and deployed your first Apple mobile device application. You can use this to do some real-world testing and when happy with it, move to the next stage, which is deployment to either the App Store or via another mechanism called Adhocdeployment.
Publishing Your Application
Once you've tested your application on your local device, you are ready to publish it to other devices. Here you have two options: Adhoc deployment or deployment via the App Store. The first thing to note is you'll need Provisioning Profiles for each, and these are easily set up through the Provisioning Profile page, as shown in Figure 9–24.
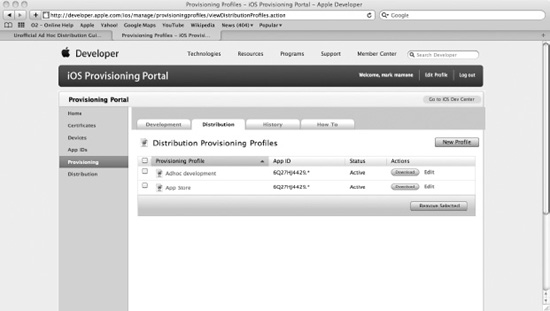
Figure 9–24. Distribution profiles on the Provisioning Profile page
As you can see, I've created one distribution profile for both Adhoc and App Store deployment. I'll use these later in Xcode.
Publishing via the Adhoc Mechanism
TheAdhoc mechanism allows you to distribute your application to up to 100 other iPad, iPhone, or iPod Touch users using e-mail or the Internet as a distribution mechanism. From there the user can download and install the application.
The first thing to note is that your application must be built against a profile that is configured for Adhoc deployment. You do this through the Provisioning Profile page. In the Build configuration for your application under Code Signing, choose the Adhoc profile for your build and build the application as before.
Once built, you will need to distribute both the application (usually archived) and the Adhoc Distribution profile (.mobileprovision file) to allow the other users to install it.
The installing user drags these onto The Library ![]() Applications folder in iTunes. If the application has been archived, they will need to unarchive the file to leave the .
Applications folder in iTunes. If the application has been archived, they will need to unarchive the file to leave the .app binary, and drag this across.
The application can then be synced as normal with the device using the iTunes sync feature. The application should be then ready to run on the device.
Publishing via the App Store
To publish your application to the App Store, you have to follow a similar routine in that your application must be built and signed against an App Store Provisioning Profile. To do this, you follow the same instructions and change your build settings in Xcode to sign your application on compilation but in this instance, choose the App Store Provisioning Profile.
Once built, you're ready to submit your application to the App Store. To do this, go to the Member Center from the Apple Developer page. On the home page, just beneath the Provisioning Portal link, you will see a link to iTunes Connect. If you wish to jump straight there, navigate to https://itunesconnect.apple.com in your favorite browser.
But wait!
Preparing for Your App Store Submission
Just before you submit your application, to ensure the best possible chances of a successful acceptance, I recommend you review the App Store Review Guidelines for iOS just one last time. It's not a small resource, but Apple reserves the right to refuse any application that doesn't comply. You can find a copy at https://developer.apple.com/appstore/resources/approval/guidelines.html or via the Member Center. In fact, there is a very good resource center that provides all manner of information to help you submit your application to the App Store, which can found at https://developer.apple.com/appstore/.
In addition to your application binary, you will need to complete information for a number of attributes that accompany your application. You might as well get these ready, because you're going to need them. They are
- Application name
- Application description
- Primary and secondary category
- Subcategories
- Copyright
- App rating
- Keywords
- SKU number
- Application URL
- Screenshots
- Support URL
- Support e-mail address
- End user license agreement
- Pricing, available date, territories
- OS binaries: Includes 57px and an optional 114px hi-res icon for iPhone and iPod touch or a 50px and 72px icon for iPad using iTunes Connect
iTunes Connect is a suite of web-based tools created for you to submit and manage apps via the App Store. In iTunes Connect you will be able to check the status of your contracts, manage iTunes Connect and test users, obtain sales and finance reports, view app crash logs, request promotional codes, and much more.
It's a pretty comprehensive suite so I'm not going to cover the whole suite in fine detail. There is a very good developer guide that does that for you at https://itunesconnect.apple.com/docs/iTunesConnect_DeveloperGuide.pdf.
However, I will take you through the basics of submitting an application to the App Store, assuming that you've already completed all of the preparatory work mentioned earlier.
So, once again, visit https://itunesconnect.apple.com and log in. Once you've done this, you will be presented with the iTunes Connect Home Page, as shown in Figure 9–25.
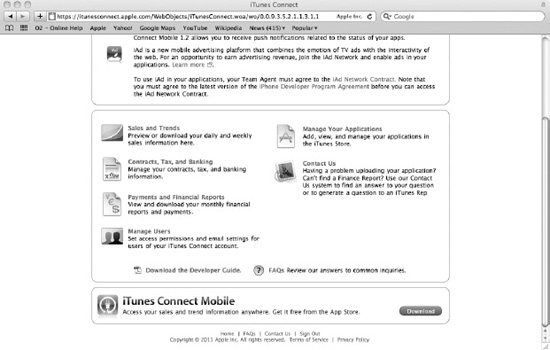
Figure 9–25. iTunes Connect home page
Once you're at the home page, choose the Manage Your Applications link. This allows you to manage your applications within the App Store and add new applications. The first time you enter this page, the list will be empty. That's because you haven't uploaded any apps yet. You can see this in Figure 9–26.

Figure 9–26. Empty Application list
Choose the Add New App button. This will prompt you to enter information relating to your application. Be warned; they require a lot of information, hence my recommendation for you to get it ready before you commence your upload.
I'm not going to list all the fields and their meanings. There are many, and as mentioned, the iTunes Connect Developer Guide does a great job of describing this information and its purpose.
Once you've entered the information required, you will be asked to upload some binaries. These include the various images to accompany your application, including icons for the application and screenshots. Once all of this information is entered and the image resources are uploaded, you will be taken to the App Summary page. On this page are additional buttons to the right of the page that allow you to manage further information about your app, such as localization and pricing.
Uploading Your Application Binary
On the Version Details page, click the Ready to Upload Binary button. You'll have to answer some final questions about Export Compliance. Then, depending on whether you are adding a new application or updating one already uploaded, you'll be taken to the Application Loader Instruction page or the Version Release Control page accordingly.
If you are using iOS SDK 3.2 or later, you already have Application Loader stored on your computer in your Utilities folder at /Developer/Applications/Utilities/Application Loader.app.
You also have the option of delivering from Xcode, which also happens to utilize the same Application Loader technology. See the Using Application Loader section in the developer guide to learn more about how to deliver your binary using this mechanism.
Once the Application Loader has been started, you be presented with a screen like the one in Figure 9–27.

Figure 9–27. Application Loader start screen
Once you hit Next, you'll be asked to enter your login details, and then the application will provide you with a list of applications it is expecting an upload for. If you didn't successfully complete the process of adding your application via the iTunes Connect page, you'll see a screen similar to that in Figure 9–28.
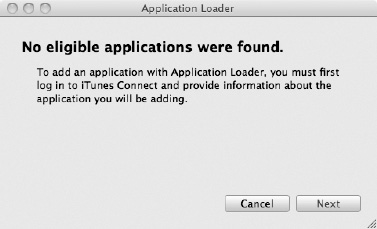
Figure 9–28. No eligible applications were found.
This indicates that you've not added your application through iTunes Connect, or if you thought you had, it failed. If you did upload the list correctly, you will be prompted to choose an application from the drop-down list, which contains all the applications you've uploaded. Choose the appropriate application from the list, as shown in Figure 9–29.

Figure 9–29. Choosing your App Store application binary to upload
Once you've chosen the application you're adding to the App Store and click Next, you'll be asked to complete a series of questions. These include confirmation that you've tested and qualified the binary on iOS, and then you will be asked to choose the binary for the application to upload. Using the Choose button, select your application package (this is your application compressed into a single .zip file), as shown in Figure 9–30.
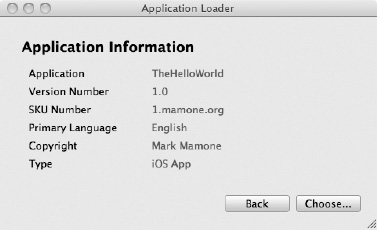
Figure 9–30. Choosing your application package to upload
Once chosen, you will be presented with the summary screen shown in Figure 9–31. You'll have the option to submit the application by selecting the Send button or cancel the whole process. Select the Send button.
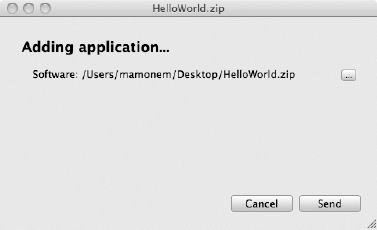
Figure 9–31. Summary Application submission screen
This will then submit your application to the App Store, showing a screen similar to that in Figure 9–32.
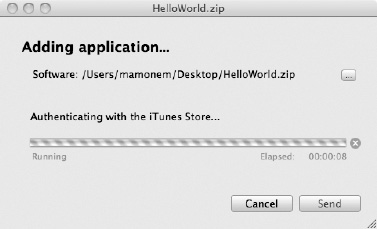
Figure 9–32. Submitting your application to the App Store
Once uploaded successfully, you will see a screen confirming this and reminding you that you will receive an e-mail confirming the upload and at any point, you can use iTunes Connect to track its process through the Apple approval process.
Additional Resources
The process of submitting your application is now complete. You have tested your application using Xcode features such as unit testing, the iOS Simulator, and real-world device testing. You have also submitted your application to the App Store. However, the themes of testing and iPhone marketingsubmission are significant topics, so I've highlighted some additional reading material that explores these topics in much more detail.
- Design Driven Testing: Test Smarter, Not harder (ISBN13: 978-1-4302-2943-8) brings sanity back to software development by restoring the concept of using testing to verify a design instead of pretending that unit tests are a replacement for design.
- The Business of iPhone and iPad App Development: Making and Marketing Apps that Succeed (ISBN13: 978-1-4302-3300-8) shows you how to incorporate marketing and business savvy into every aspect of your iPhone and iPad apps design and development process.
These resources are in addition to those included as part of the Apple Developer Program and iOS Development Centre (see http://developer.apple.com).
Summary
In this chapter you learned how to test your application using features found in both Xcode and the Simulator. You also learned how to get your machine, including your Xcode installation, ready for provisioning applications to your own device as well as provisioning using the two mechanisms recognized by Apple: Adhoc and the App Store.
You looked at how to set up local certificates and Provisioning Profiles to make this possible and how to use both the Provisioning Portal and iTunes Connect on the home page of the Member Center. After successfully deploying to your local device, you briefly looked at how to provision using the Adhoc method and then you looked in detail at using iTunes Connect to provision an application to the App Store.
You are now ready to make millions of dollars (hopefully!) using the guidance provided in this book to both create your iOS-based application and submit it to the App Store for others to purchase.