
Contents
Save X Matrix: Viewing the Number of Rows in the Moments Matrix and the Design Matrix (X) in the Log
Creating a Custom Design
To begin, select DOE > Custom Design, or click the Custom Design button on the JMP Starter DOE page. Then, follow the steps below.
• Enter responses and factors into the custom designer.
• Describe the model.
• Select the number of runs.
• Check the design diagnostics, if desired.
• Specify output options.
• Make the JMP design table.
The following sections describe each of these steps.
Enter Responses and Factors into the Custom Designer
How to Enter Responses
To enter responses, follow the steps in Figure 4.1.
1. To enter one response at a time, click Add Response, and then select a goal type. Possible goal types are Maximize, Match Target, Minimize, or None.
2. (Optional) Double-click to edit the response name.
3. (Optional) Click to change the response goal.
4. Click to enter lower and upper limits and importance weights.
Figure 4.1 Entering Responses
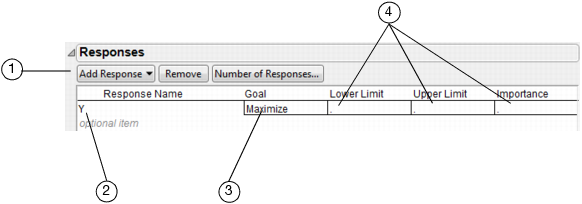
Tip: To quickly enter multiple responses, click Number of Responses and enter the number of responses you want.
Specifying Response Goal Types and Lower and Upper Limits
When entering responses, you can tell JMP that your goal is to obtain the maximum or minimum value possible, to match a specific value, or that there is no response goal.
The following description explains the relationship between the goal type (step 3 in Figure 4.1) and the lower and upper limits (step 4 in Figure 4.1):
• For responses such as strength or yield, the best value is usually the largest possible. A goal of Maximize supports this objective.
• The Minimize goal supports an objective of having the smallest value, such as when the response is impurity or defects.
• The Match Target goal supports the objective when the best value for a response is a specific target value, such as a dimension for a manufactured part. The default target value is assumed to be midway between the given lower and upper limits.
Note: If your target response is not equidistant from the lower and upper acceptable bounds, you can alter the default target after you make a table from the design. In the data table, open the Column Info dialog for the response column (Cols > Column Info) and enter the desired target value.
Understanding Response Importance Weights
To compute and maximize overall desirability, JMP uses the value you enter as the importance weight (step 4 in Figure 4.1) of each response. If there is only one response, then importance weight is unnecessary. With two responses you can give greater weight to one response by assigning it a higher importance value.
Adding Simulated Responses, If Desired
If you do not have values for specific responses, you might want to add simulated responses to see a prospective analysis in advance of real data collection.
1. Create the design.
2. Before you click Make Table, click the red triangle icon in the title bar and select Simulate Responses.
3. Click Make Table to create the design table. The Y column contains values for simulated responses.
4. For custom and augment designs, a window (Figure 4.2) appears along with the design data table. In this window, enter values you want to apply to the Y column in the data table and click Apply. The numbers you enter represent the coefficients in an equation. An example of such an equation, as shown in Figure 4.2, would be, y = 28 + 4X1 + 5X2 + random noise, where the random noise is distributed with mean zero and standard deviation one.
Figure 4.2 In Custom and Augment Designs, Specify Values for Simulated Responses

How to Enter Factors
To enter factors, follow the steps in Figure 4.3.
1. To add one factor, click Add Factor and select a factor type. Possible factor types are Continuous, Categorical, Blocking, Covariate, Mixture, Constant, or Uncontrolled. See Types of Factors.
2. Click a factor and select Add Level to increase the number of levels.
3. Double-click a factor to edit the factor name.
4. Click to indicate that changing a factor’s setting from run to run is Easy, Hard, or Very Hard. Changing to Hard or Very Hard will cause the resulting design to be a split plot or split-split plot design.
5. Click to enter or change factor values. To remove a level, click it, press the delete key on the keyboard, then press the Return or Enter key on the keyboard.
6. To add multiple factors, type the number of factors in the Add N Factors box, click the Add Factor button, and select the factor type.
Figure 4.3 Entering Factors in a Custom Design

Types of Factors
When adding factors, click the Add Factor button and choose the type of factor.
Continuous
Continuous factors are numeric data types only. In theory, you can set a continuous factor to any value between the lower and upper limits you supply.
Discrete Numeric
is a numeric factor that can take only a discrete number of values. The values have an implied order. The default model effects for a discrete numeric factor include polynomial terms through k-1 for a factor with k levels. This is done so the optimality and fitting routines take advantage of the multiple levels. If the polynomial terms are not included, then a main effects only design is created.
Categorical
Either numeric or character data types. Categorical data types have no implied order. If the values are numbers, the order is the numeric magnitude. If the values are character, the order is the sorting sequence. The settings of a categorical factor are discrete and have no intrinsic order. Examples of categorical factors are machine, operator, and gender.
Blocking
Either numeric or character data types. Blocking factors are a special kind of categorical factor. Blocking factors differ from other categorical factors in that there is a limit to the number of runs that you can perform within one level of a blocking factor.
Covariate
Either numeric or character data types. Covariate factors are not controllable, but their values are known in advance of an experiment.
Mixture
Mixture factors are continuous factors that are ingredients in a mixture. Factor settings for a run are the proportion of that factor in a mixture and vary between zero and one.
Constant
Either numeric or character data types. Constant factors are factors whose values are fixed during an experiment.
Uncontrolled
Either numeric or character data types. Uncontrolled factors have values that cannot be controlled during an experiment, but they are factors you want to include in the model.
Factors that are Easy, Hard, or Very Hard, to Change: Creating Optimal Split-Plot and Split-Split-Plot Designs
Split plot experiments are performed in groups of runs where one or more factors are held constant within a group but vary between groups. In industrial experimentation this structure is desirable because certain factors may be difficult and expensive to change from one run to the next. It is convenient to make several runs while keeping such factors constant. Until now, commercial software has not supplied a general capability for the design and analysis of these experiments.
To indicate the difficulty level of changing a factor’s setting, click in Changes column of the Factors panel for a given factor and select Easy, Hard, or Very Hard from the menu that appears. Changing to Hard results in a split-plot design and Very Hard results in a split-split-plot design.
See Creating Split Plot Designs, for more details.
Defining Factor Constraints, If Necessary
Sometimes it is impossible to vary factors simultaneously over their entire experimental range. For example, if you are studying the affect of cooking time and microwave power level on the number of kernels popped in a microwave popcorn bag, the study cannot simultaneously set high power and long time without burning all the kernels. Therefore, you have factors whose levels are constrained.
To define the constraints:
1. After you add factors and click Continue, click the disclosure button ( on Windows and
  on the Macintosh) to open the Define Factor Constraints panel.
2. Click the Add Constraint button. Note that this feature is disabled if you have already controlled the design region by entering disallowed combinations or chosen a sphere radius.
Figure 4.4 Add Constraint
3. Specify the coefficients and their limiting value in the boxes provided, as shown to the right. When you need to change the direction of the constraint, click on the default less than or equal button and select the greater than or equal to direction.
4. To add another constraint, click the Add Constraint button again and repeat the above steps.
To remove a constraint
To remove the last constraint, click the Remove Last Constraint button.
Describe the Model
Initially, the Model panel lists only the main effects corresponding to the factors you entered, as shown in Figure 4.5. If a factor is Discrete Numeric, polynomial terms are added by default as well. You can add factor interactions or powers of continuous factors to the model. For example, to add all the two-factor interactions and quadratic effects at once, click the RSM button.
Figure 4.5 Add Terms

Table 4.1 summarizes the ways to add specific factor types to the model.
|
Action
|
Instructions
|
|
Add interaction terms involving selected factors. If none are selected, JMP adds all of the interactions to the specified order.
|
Click the Interactions button and select 2nd, 3rd, 4th, or 5th. For example, if the factors are X1 and X2 and you click Interactions > 2nd, X1*X2 is added to the list of model terms.
|
|
Add all second-order effects, including two-factor interactions and quadratic effects
|
Click the RSM button. The design now uses I-Optimality criterion rather than D-Optimality criterion.
|
|
Add selected cross product terms
|
1. Highlight the factor names.
2. Highlight term(s) in the model list.
3. Click the Cross button.
|
|
Add powers of continuous factors to the model effects
|
Click the Powers button and select 2nd, 3rd, 4th, or 5th.
|
Specifying Alias Terms
You can investigate the aliasing between the model terms and terms you specify in the Alias Terms panel.
For example, suppose you specify a design with three main effects in six runs, and you want to see how those main effects are aliased by the two-way interactions and the three-way interaction. In the Alias Terms panel, specify the interactions as shown in Figure 4.6. Also, specify six runs in the Design Generation panel.
Figure 4.6 Alias Terms

After you click the Make Design button at the bottom of the Custom Design panel, open the Alias Matrix panel in the Design Evaluation panel to see the alias matrix. See Figure 4.7.
Figure 4.7 Aliasing

In this example, all the main effects are partially aliased with two of the interactions. Also see The Alias Matrix (Confounding Pattern).
Select the Number of Runs
The Design Generation panel (Figure 4.8) shows the minimum number of runs needed to perform the experiment based on the effects you’ve added to the model. It also shows alternate (default) numbers of runs, or lets you choose your own number of runs. Balancing the cost of each run with the information gained by extra runs you add is a judgment call that you control.
Figure 4.8 Options for Selecting the Number of Runs

The Design Generation panel has these options for selecting the number of runs you want. For details about Group runs into random blocks of size, see Creating Random Block Designs.
Number of Center Points
Specifies how many additional runs to place at the center of each continuous factor’s range.
Number of Replicates
Specifies the number of replicate points to add to the design. This does not replicate the entire design, but chooses the optimal design points to replicate. One replicate increases the number of runs by 1.
Minimum
is the smallest number of terms that can create a design. When you use Minimum, the resulting design is saturated (no degrees of freedom for error). This is an extreme and risky choice, and is appropriate only when the cost of extra runs is prohibitive.
Default
is a custom design suggestion for the number of runs. This value is based on heuristics for creating balanced designs with a few additional runs above the minimum.
User Specified
is a value that specifies the number of runs you want. Enter that value into the Number of Runs text box.
Note: In general, the custom design suggests a number of runs that is the smallest number that can be evenly divided by the number of levels of each of the factors and is larger than the minimum possible sample size. For designs with factors at two levels only, the default sample size is the smallest power of two larger than the minimum sample size.
When the Design Generation panel shows the number of runs you want, click Make Design. After you click Make Design, the report includes the Design report which shows the runs for the design.
Understanding Design Evaluation
After making the design, you can preview the design and investigate details by looking at various plots and tables that serve as design diagnostic tools.
Although different tools are available depending on the model you specify, most designs display
• the Prediction Variance Profile Plot
• the Fraction of Design Space Plot
• the Prediction Variance Surface Plot
• the Power Table
• the Alias Matrix
• Design Diagnostic Table
These diagnostic tools are outline nodes beneath the Design Evaluation panel, as shown in Figure 4.9. JMP always provides the Prediction Variance Profile, but the Prediction Surface Plot only appears if there are two or more variables.
Figure 4.9 Custom Design Evaluation and Diagnostic Tools

The Prediction Variance Profile
The example in Figure 4.10 shows the prediction variance profile for a response surface model (RSM) with 2 variables and 12 runs. To see a response surface design similar to this:
1. Chose DOE > Custom Design.
2. In the Factors panel, add 2 continuous factors.
3. Click Continue.
4. In the Model panel, click RSM.
5. Click Make Design.
6. Open the Prediction Variance Profile.
Figure 4.10 A Factor Design Layout For a Response Surface Design with 2 Variables

The prediction variance for any factor setting is the product of the error variance and a quantity that depends on the design and the factor setting. Before you collect the data the error variance is unknown, so the prediction variance is also unknown. However, the ratio of the prediction variance to the error variance is not a function of the error variance. This ratio, called the relative variance of prediction, depends only on the design and the factor setting and can be calculated before acquiring the data. The prediction variance profile plots the relative variance of prediction as a function of each factor at fixed values of the other factors
After you run the experiment, collect the data, and fit the model, you can estimate the actual variance of prediction at any setting by multiplying the relative variance of prediction by the mean squared error (MSE) of the least squares fit.
It is ideal for the prediction variance to be small throughout the allowable regions of the factors. Generally, the error variance drops as the sample size increases. Comparing the prediction variance profilers for two designs side-by-side, is one way to compare two designs. A design that has lower prediction variance on the average is preferred.
In the profiler, drag the vertical lines in the plot to change the factor settings to different points. Dragging the lines reveals any points that have prediction variances that are larger than you would like.
Another way to evaluate a design, or to compare designs, is to try and minimize the maximum variance. You can use the Maximize Desirability command on the Prediction Variance Profile title bar to identify the maximum prediction variance for a model. Consider the Prediction Variance profile for the two-factor RSM model shown in Figure 4.11. The plots identify the factor values where the maximum variance (or worst-case scenario) occur, which helps you evaluate the acceptability of the model.
Figure 4.11 Find Maximum Prediction Variance

The Fraction of Design Space Plot
The Fraction of Design Space plot is a way to see how much of the model prediction variance lies above (or below) a given value. As a simple example, consider the Prediction Variance plot for a single factor quadratic model, shown on the left in Figure 4.12. The Prediction Variance plot shows that 100% of the values are smaller than 0.5. You can move the vertical trace and also see that all the values are above 0.322. The Fraction of Design Space plot displays the same information. The X axis is the proportion of prediction variance values, ranging from 0 to 100%, and the Y axis is the range of prediction variance values. In this simple example, the Fraction of Design plot verifies that 100% of the values are below 0.5 and 0% of the values are below approximately 0.3. You can use the crosshair tool and find the percentage of values for any value of the prediction variance. The example to the right in Figure 4.12 shows that 75% of the prediction variance values are below approximately 0.46.
The Fraction of Design space is most useful when there are multiple factors. It summarizes the prediction variance, showing the fractional design space for all the factors taken together.
Figure 4.12 Variance Profile and Fraction of Design Space

The Prediction Variance Surface
When there are two or more factors, the Prediction Variance Surface plots the surface of the prediction variance for any two variables. This feature uses the Graph > Surface Plot platform in JMP, and has all its functionality. Drag on the plot to rotate and change the perspective. Figure 4.13 shows the Prediction Variance Surface plot for a two-factor RSM model. The factors are on the x and y axes, and the prediction variance is on the z axis. You can clearly see that there are high and low variance areas for both factors. Compare this plot to the Prediction Variance Profile shown in Figure 4.11.
Figure 4.13 Prediction Variance Surface Plot for Two-Factor RSM Model

You can find complete documentation for the Surface Plot platform in the Modeling and Multivariate Methods book.
Power Analysis Report
The Power Analysis report gives power values for each effect in the model. Power is the probability of detecting an active effect. The true effect is assumed to be the specified Signal to Noise Ratio times the unknown value of sigma. You can specify the error degrees of freedom. This allows a quick approximation of the effect of increasing the number of runs.
Power calculations for numeric factors are for a unit change in the response mean due to linear main effects as the factor changes from the lowest setting to the highest setting in the design region. The power calculation for categorical factors with two levels is similar in that it is relative to a unit change in the response mean across the levels of the factor.
For categorical factors with more than two levels, the power calculation is for the multiple degree of freedom F-test for the main effect, assuming that a unit change in the response mean could occur between any single pair of factor levels.
Power calculations for interaction effects are similar to main effects. The difference is that the unit change in the response mean is across combinations of levels of the factors that cannot be explained by the main effects alone.
Power calculations for quadratic effects of numeric factors are for a unit change in the response mean that can be explained only by quadratic curvature.
Note the following about the power calculations:
• Power calculations are only given for continuous, categorical, and discrete numeric factors. Power calculations are not given for blocking, mixture, and covariate terms. See How to Enter Factors.
• For categorical factors with two levels, the lower bound on power is given.
• Power is not calculated for If Possible model terms. The type of model term is reflected in the Estimability column of the Model section. See Describe the Model.
Right-click on the power report and select Columns to reveal additional columns:
Numerator DF
The numerator degrees of freedom for the F-Test that the power is based on.
Non-Centrality Parameter
The non-centrality parameter for the non-central F-distribution used to compute the power.
Contrast Std Error
The standard error of the contrast that describes the alternative hypothesis that the power is based on. For two-level factors it is the difference in the LS Means of the contrast.
F Critical Value
The critical value (α=0.05) with numerator degrees of freedom given by Numerator DF. The denominator degrees of freedom are given by Error Degrees of Freedom in the report.
The Alias Matrix (Confounding Pattern)
Click the Alias Matrix disclosure button ( on Windows and
  on the Macintosh) to open the alias matrix (Figure 4.14).
The alias matrix shows the aliasing between the model terms and the terms you specify in the Alias Terms panel (see Specifying Alias Terms). It allows you to see the confounding patterns.
Figure 4.14 Alias Matrix

Alias Matrix Formulas
Let X be the design matrix corresponding to the model effects, and Z be the matrix of interested effects (the effects you specify in the Alias Terms panel), then the alias matrix is
For designs with hard-to-change or very-hard-to-change factors, the alias matrix is
where V is a covariance matrix.
For Bayesian designs, the alias matrix is
where K2 is a diagonal matrix with a value of 16 for if-possible terms and 0 for all others.
Color Map on Correlations
The Color Map On Correlations panel (see Figure 4.15) shows the correlations between all model terms and alias terms you specify in the Alias Terms panel (see Specifying Alias Terms). The colors correspond to the absolute value of the correlations.
Figure 4.15 Color Map of Correlations

The Design Diagnostics Table
Open the Design Diagnostics outline node to display a table with relative D-, G-, and A-efficiencies, average variance of prediction, and length of time to create the design. The design efficiencies are computed as follows:


where
• ND is the number of points in the design
• p is the number of effects in the model including the intercept
• σM is the maximum standard error for prediction over the design points.
These efficiency measures are single numbers attempting to quantify one mathematical design characteristic. While the maximum efficiency is 100 for any criterion, an efficiency of 100% is impossible for many design problems. It is best to use these design measures to compare two competitive designs with the same model and number of runs rather than as some absolute measure of design quality.
Figure 4.16 Custom Design Showing Diagnostics
Specify Output Options
Use the Output Options panel to specify how you want the output data table to appear.
Figure 4.17 Output Options Panel

Run Order lets you designate the order you want the runs to appear in the data table when it is created. Choices are:
Keep the Same
the rows (runs) in the output table will appear as they do in the Design panel.
Sort Left to Right
the rows (runs) in the output table will appear sorted from left to right.
Randomize
the rows (runs) in the output table will appear in a random order.
Sort Right to Left
the rows (runs) in the output table will appear sorted from right to left.
Randomize within Blocks
the rows (runs) in the output table will appear in random order within the blocks you set up.
Make the JMP Design Table
When the Design panel shows the layout you want, click Make Table. Parts of the table contain information you might need to continue working with the table in JMP. The upper-left of the design table can have one or more of the following scripts:
• a Screening script runs the Analyze > Modeling > Screening platform when appropriate for the generated design.
• a Model script runs the Analyze > Fit Model platform with the model appropriate for the design.
• a constraint script that shows any model constraints you entered in the Define Factor Constraints panel of the Custom Design dialog.
• a DOE Dialog script that recreates the dialog used to generate the design table, and regenerates the design table.
Figure 4.18 Example Design Table

1. This area identifies the design type that generated the table. Click Custom Design to edit.
2. Model is a script. Click the red triangle icon and select Run Script to open the Fit Model dialog, which is used to generate the analysis appropriate to the design.
3. DOE Dialog is a script. Click the red triangle icon and select Run Script to recreate the DOE Custom Dialog and generate a new design table.
Creating Random Block Designs
It is often necessary to group the runs of an experiment into blocks. Runs within a block of runs are more homogeneous than runs in different blocks. For example, the experiment described in Goos (2002), describes a pastry dough mixing experiment that took several days to run. It is likely that random day-to-day differences in environmental variables have some effect on all the runs performed on a given day. Random block designs are useful in situations like this, where there is a non-reproducible shock to the system between each block of runs. In Goos (2002), the purpose of the experiment was to understand how certain properties of the dough depend on three factors: feed flow rate, initial moisture content, and rotational screw speed. It was only possible to conduct four runs a day. Because day-to-day variation was likely, it was important to group the runs so that this variation would not compromise the information about the three factors. Thus, blocking the runs into groups of four was necessary. Each day's experimentation was one block. The factor, Day, is an example of a random block factor.
To create a random block, use the custom design and enter responses and factors, and define your model as usual. In the Design Generation panel, check the Group runs into random blocks of size check box and enter the number of runs you want in each block. When you select or enter the sample size, the number of runs specified are assigned to the blocks.
Figure 4.19 Assigning Runs to Blocks

In this example, the Design Generation Panel shown here designates four runs per block, and the number of runs (12) indicates there will be three days (blocks) of 4 runs. If the number of runs is not an even multiple of the random block size, some blocks will have fewer runs than others.
Creating Split Plot Designs
Split plot experiments happen when it is convenient to run an experiment in groups of runs (called whole plots) where one or more factors stay constant within each group. Usually this is because these factors are difficult or expensive to change from run to run. JMP calls these factors Hard to change because this is usually how split plotting arises in industrial practice.
In a completely randomized design, any factor can change its setting from one run to the next. When certain factors are hard to change, the completely randomized design may require more changes in the settings of hard-to-change factors than desired.
If you know that a factor or two are difficult to change, then you can set the Changes setting of a factor from the default of Easy to Hard. Before making the design, you can set the number of whole plots you are willing to run.
For an example of creating a split plot design, see Creating a Design with Two Hard-to-Change Factors: Split Plot.
To create a split plot design using the custom designer:
1. In the factors table there is a column called Changes. By default, changes are Easy for all factors. If, however, you click in the changes area for a factor, you can choose to make the factor Hard to change.
2. Once you finish defining the factors and click continue, you see an edit box for supplying the number of whole plots. You can supply any value as long as it is above the minimum necessary to fit all the model parameters. You can also leave this field empty. In this case, JMP chooses a number of whole plots to minimize the omnibus uncertainty of the fixed parameters.
Note: If you enter a missing value in the Number of Whole Plots edit box, then JMP considers many different numbers of whole plots and chooses the number that maximizes the information about the coefficients in the model. It maximizes the determinant of where V -1 is the inverse of the variance matrix of the responses. The matrix, V, is a function of how many whole plots there are, so changing the number of whole plots changes V, which can make a difference in the amount of information a design contains.
To create a split plot design every time you use a certain factor, save steps by setting up that factor to be “hard” in all experiments. See Identify Factor Changes Column Property, for details.
Creating Split-Split Plot Designs
Split-split plot designs are a three stratum extension of split plot designs. Now there are factors that are Very-Hard-to-change, Hard-to-change, and Easy-to-change. Here, in the top stratum, the Very-Hard-to- change factors stay fixed within each whole plot. In the middle stratum the Hard-to-change factors stay fixed within each subplot. Finally, the Easy-to-change factors may vary (and should be reset) between runs within a subplot. This structure is natural when an experiment covers three processing steps. The factors in the first step are Very-Hard-to-change in the sense that once the material passes through the first processing stage, these factor settings are fixed. Now the material passes to the second stage where the factors are all Hard-to-change. In the third stage, the factors are Easy-to-change.
Schoen (1999) provides an example of three-stage processing involving the production of cheese that leads to a split-split plot design. The first processing step is milk storage. Typically milk from one storage facility provides the raw material for several curds processing units—the second processing stage. Then the curds are further processed to yield individual cheeses.
In a split-split plot design the material from one processing stage passes to the next stage in such a way that nests the subplots within a whole plot. In the example above, milk from a storage facility becomes divided into two curds processing units. Each milk storage tank provided milk to a different set of curds processors. So, the curds processors were nested within the milk storage unit.
Figure 4.20 shows an example of how factors might be defined for the cheese processing example.
Figure 4.20 Example of Split-Split Response and Factors in Custom Designer Dialog

Creating Strip Plot Designs
In a strip plot design it is possible to reorder material between processing stages. Suppose units are labelled and go through the first stage in a particular order. If it is possible to collect all the units at the end of the first stage and reorder them for the second stage process, then the second stage variables are not nested within the blocks of the first stage variables. For example, in semiconductor manufacturing a boat of wafers may go through the first processing step together. However, after this step, the wafers in a given boat may be divided among many boats for the second stage.
To set up a strip plot design, enter responses and factors as usual, designating factors as Very Hard, Hard, or Easy to change. Then, in the Design Generation panel, check the box that says Hard to change factors can vary independently of Very Hard to change factors, as shown in Figure 4.21. Note that the Design Generation panel specified 6 whole plots, 12 subplots, and 24 runs.
When you click Make Design, the design table on the right in Figure 4.21 lists the run with subplots that are not nested in the whole plots.
Figure 4.21 Example of Strip Split Factors and Design Generation panel in Custom Designer Dialog

Special Custom Design Commands
After you select DOE > Custom Design, click the red triangle icon on the title bar to see the list of commands available to the Custom designer (Figure 4.22). The commands found on this menu vary, depending on which DOE command you select. However, the commands to save and load responses and factors, and the command to set the random seed are available to all designers. You should examine the red triangle menu for each designer you use to determine which commands are available. If a designer has additional commands, they are described in the appropriate chapter.
Figure 4.22 Click the Red Triangle Icon to Reveal Commands

The following sections describe these menu commands and how to use them.
Save Responses and Save Factors
If you plan to do further experiments with factors and/or responses to which you have given meaningful names and values, you can save them for later use.
To save factors or responses:
1. Select a design type from the DOE menu.
2. Enter the factors and responses into the appropriate panels (see Enter Responses and Factors into the Custom Designer, for details).
3. Click the red triangle icon on the title bar and select Save Responses or Save Factors.
Save Responses
creates a data table containing a row for each response with a column called Response Name that identifies the responses. Four additional columns identify more information about the responses: Lower Limit, Upper Limit, Response Goal, and Importance.
Save Factors
creates a data table containing a column for each factor and a row for each factor level. The columns have two column properties (noted with asterisks icons in the column panel). These properties include:
Design Role that identifies the factor as a DOE factor and lists its type (continuous, categorical, blocking, and so on).
Factor Changes that identifies how difficult it is to change the factor level. Factor Changes options are Easy, Hard, and Very Hard.
4. Save the data table.
Load Responses and Load Factors
If you have saved responses and factors, you can quickly apply them to your design and avoid retyping this information each time you run an experiment.
To design an experiment using responses or factors you have previously saved:
1. Open the data table that contains the factor names and levels.
2. Select a design type from the DOE menu.
3. Click the red triangle icon on the title bar and select Load Responses or Load Factors.
Tip: It is possible to create a factors table by keying data into an empty table, but remember to assign each column a factor type. Do this by right-clicking the column name, selecting Column Info, and then selecting Column Properties > Design Role. Lastly, click the button in the Design Role area and select the appropriate role.
Save Constraints and Load Constraints
In custom, augment, and mixture designs, if you set up factor constraints and plan to do further experiments with them, you can save them for later use. You can quickly apply these constraints to your design and avoid retyping this information each time you run an experiment.
To save factor constraints:
1. Select a design type from the DOE menu.
2. Enter the factor constraints into the appropriate panels (see Enter Responses and Factors into the Custom Designer, for details).
3. Click the red triangle icon on the title bar and select Save Constraints. Save Constraints creates a data table that contains the information you enter into a constraints panel. There is a column for each constraint. Each has a column property called Constraint State that identifies it as a ‘less than’ or a ‘greater than’ constraint. There is a row for each variable and an additional row that has the inequality condition for each variable.
4. Save the data table.
To design an experiment using factor constraints you have previously saved:
1. Open the data table that contains the constraints.
2. Select a design type from the DOE menu.
3. Click the red triangle icon on the title bar and select Load Constraints.
Set Random Seed: Setting the Number Generator
The design process begins with a random starting design. To set the random seed that the custom designer uses to create this starting design, click the red triangle icon in the design title bar and select Set Random Seed.
The window that appears shows the generating seed for that design (Figure 4.23). From this window, you can set a new random number and then run the design again.
If you use the same seed as a previous design, you will get the same design again.
Figure 4.23 Setting the Random Seed

Note: The random seed is also used when you simulate responses to be used with a design, as described next.
Simulate Responses
Often, when you define a custom design (or any standard design), it may be useful to look at properties of the design with response data before you have collected data. The Simulate Responses command adds random response values to the JMP table that the custom designer creates. To use the command, select it before you click Make Table. When you click Make Table to create the design table, the Y column contains values for simulated responses.
For custom and augment designs, an additional window appears with the design data table that lists coefficients for the design you described in the designer panels. You can enter any coefficient values you want and click Apply to see new Y values in the data table. An example of an equation for a model with two factors and interaction (Figure 4.24) would be,
y = 21 + 4X1 + 6X2 – 5X1X2 + random noise,
where the random noise is distributed with mean zero and standard deviation one.
Figure 4.24 Example of a Custom Design with Simulated Responses

Save X Matrix: Viewing the Number of Rows in the Moments Matrix and the Design Matrix (X) in the Log
To create scripts for the Moments Matrix and the Design Matrix, and to save these matrices as table properties in the data table that will be generated from the design, click the red triangle icon in the Custom Design title bar (Figure 4.22) and select Save X Matrix. After the design and table are created, two scripts are saved as table properties and are called the Moments Matrix and the Design Matrix. Each script can be selected and run from the upper left panel of the resulting data table. Results from running each of the scripts are shown in the Log. When you run the script for the Moments Matrix, JMP shows the number of rows for the global matrix, called Moments, in the Log. Similarly, when you run the script for the Design Matrix, JMP displays the number of rows for the global matrix, called X, in the Log. The Moments Matrix and the Design Matrix are used to calculate the Average Variance of Prediction, shown in the Design Diagnostics section of the Design Evaluation. Saving these scripts to the data table provides an easy way to remember and recreate your design at a later time and to compare the matrices values with alternate designs. If you do not have the log visible, select View > Log (Window > Log on the Macintosh). To illustrate these features:
1. Select DOE > Custom Design.
2. Add 3 continuous factors and click Continue.
3. Click on Interactions > 2nd and select Save X Matrix from the drop-down menu of Custom Design.
4. Using the Default Number of Runs (8), click Make Design and then Make Table.
5. If it is not already open, select View > Log (Window > Log on the Macintosh).
6. Click on the Moments Matrix red triangle in the upper left panel of the data table under Custom Design and select Run Script. The result shows in the log as N Row(::Moments):7, which is the number of rows in the global matrix called Moments. The Moments Matrix is dependent upon the model effects but is independent of the design. (The model effects can be viewed by clicking the red triangle by Model in the upper left panel of the data table and clicking on Run Script.) The Moments Matrix script for this example displays the value of each moment and is shown by clicking on the red triangle of the Moments Matrix and selecting Edit:
Moments = [1 0 0 0 0 0 0,
0 0.333333333333333 0 0 0 0 0,
0 0 0.333333333333333 0 0 0 0,
0 0 0 0.333333333333333 0 0 0,
0 0 0 0 0.111111111111111 0 0,
0 0 0 0 0 0.111111111111111 0,
0 0 0 0 0 0 0.111111111111111];
7. Click on the Design Matrix red triangle in the upper left panel of the data table under Custom Design and select Run Script. The result shows in the log as N Row(::X):8, which is the number of rows in the global matrix called X. The X Matrix is dependent upon the design for the experiment. The script for this example shows the underlying design of the X matrix and is viewed by clicking on the red triangle of the Design Matrix and selecting Edit:
X = [1 -1 1 -1 -1 1 -1,
1 1 1 1 1 1 1,
1 -1 -1 -1 1 1 1,
1 1 -1 -1 -1 -1 1,
1 1 1 -1 1 -1 -1,
1 1 -1 1 -1 1 -1,
1 -1 1 1 -1 -1 1,
1 -1 -1 1 1 -1 -1];
Note that the Moments Matrix is defined as:
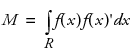
where M is a moments matrix of the parameter space that is independent of the design and can be computed in advance, and where f(x)' denotes a row of the design matrix corresponding to factor combinations of x. For additional details concerning moments and design matrices, see Myers, Montgomery, and Anderson-Cook (2009, pp. 365-371). Note that the moment matrix is called a matrix of region moments in this book.
Optimality Criterion
To change the design criterion, click the red triangle icon in the Custom Design title bar (Figure 4.22) and select Optimality Criterion, then choose one of the options:
• Make D-Optimal Design
• Make I-Optimal Design
• Make Alias Optimal Design
The default criterion for Recommended is D-optimal for all design types unless you have used the RSM button in the Model panel to add effects that make the model quadratic. For specific information about optimality criterion, see Technical Discussion.
Number of Starts: Changing the Number of Random Starts
To override the default number of random starts, click the red triangle icon in the Custom Design title bar (Figure 4.22) and select Number of Starts. When you select this command, the window shown in Figure 4.25 appears with an edit box for you to enter the number of random starts for the design you want to build. The number you enter overrides the default number of starts, which varies depending on the design.
Figure 4.25 Selecting the Number of Starts

Note: If the design iterations are taking too long, click the Cancel button. The Custom Designer stops and gives the best design found at that point.
Why Change the Number of Starts?
One difficulty with the creation of optimal designs is that the methods used do not always find the globally optimal design in cases where the optimal design is known from theory. For example, orthogonal designs are D-optimal with respect to a linear additive model and a cubic design space.
As the number of factors and sample size increase, the optimization problem becomes harder. It is easy for an optimizer to converge to a local optimum instead of a global optimum.
It is useful to know that:
• If random starts are used for the optimization, the design produced at the end is not always the same. Increasing the number of random starts tends to improve the optimality of the resulting design.
• For designs with all two-level factors, there is a formula for the optimal determinant:
If D is the determinant, n is the sample size, and c is the number of columns in the design matrix, the LogD = cLogn.
If the determinants that result from the random starts match the formula above, the algorithm stops. The design is D-optimal and orthogonal.
Default Choice of Number of Random Starts: Technical Information
JMP does not start over with random designs until a jackpot is hit. The time it takes for one iteration of the algorithm (coordinate exchange) increases roughly as the product of the sample size and the number of terms in the model increases. By doing a large number of random starts for small sample sizes and reducing this number proportional to the square of the sample size as the designs get larger, the total time it takes to generate a design is kept roughly constant over the range of usual sample sizes.
The Custom Designer always attempts to find globally optimal designs when such designs are known from theory. For example,
• 2-level fractional factorial designs are globally D-optimal for all main effect and two-factor interaction models
• Latin-Square designs are D-optimal for main effect models assuming the right sample size and numbers of levels of the factors.
• Plackett-Burman designs are D-optimal for main effect models.
If the custom designer can identify one of these special cases, it does many more random starts. In general, however, the default number of random starts is controlled by the sample size, n, as follows:
|
Sample Size
|
Number of Starts
|
|
9 or fewer
|
80
|
|
from 10 to 16
|
40
|
|
from 17 to 24
|
10
|
|
from 25 to 32
|
5
|
|
more than 32
|
2
|
Note the following exceptions:
• If each factor has only two levels, the number of terms in the model is one greater than the number of factors, and the sample size is a multiple of 4, then multiply the default number of starts shown in the table above by 40.
– If the number of runs is exactly 32 and all factors have 2-levels, then the default Number of Starts in Table 4.2 is 15.
• If the design could be a Latin Square, the Custom Designer does 1000 random starts.
• If the number of terms in the model is greater than 100, though, the number of random starts is 1.
After each random start, the design is checked to see if it is globally optimal, and if so, the iterations stop. Therefore, even if the default number of starts is large, it may only take a small fraction of the default number to find the globally optimal design. Again, if the process seems to be taking too long, use the Cancel button to see the best design found at that point.
Sphere Radius: Constraining a Design to a Hypersphere
You can constrain custom and augmented designs to a hypersphere by editing the sphere radius. Before making the design, click the red triangle icon in the Custom Design title bar (Figure 4.22) and select Sphere Radius. Enter the appropriate value and click OK.
Note that hypersphere constraints do not work with other constraints. Also, split plot designs cannot be generated with hypersphere constraints.
If you have designed any factor’s changes as Hard (see Factors that are Easy, Hard, or Very Hard, to Change: Creating Optimal Split-Plot and Split-Split-Plot Designs, and Creating Random Block Designs), the sphere radius item becomes unavailable. Conversely, once you set the sphere radius, you cannot make a factor Hard to change.
Disallowed Combinations: Accounting for Factor Level Restrictions
JMP gives you the flexibility to disallow particular combinations of levels of factors. You can do this for custom and augmented designs except for experiments with mixture or blocking factors. This feature can also be used with continuous factors or mixed continuous and categorical factors.
For example, in a market research choice experiment, you might want to exclude a choice that allows all the best features of a product at the lowest price. In this case, the factor Feature has levels of worst (1), medium (2), and best (3), and the factor Price has levels of high (1), medium (2), and low (3). You want to exclude the third Feature level (best) and the third Price level (low).
To disallow a combination of factor levels:
1. Begin by adding the factors.
2. Click the red triangle icon in the title bar (Figure 4.22) of the designer window and select Disallowed Combinations. Note that this menu item is not available if you have already defined linear inequality constraints.
3. Enter a Boolean expression that identifies what you do not want allowed (Figure 4.26). JMP evaluates your expression, and when it sees it as true, it disallows the specified combination.
Note: When forming the expression, use the ordinal value of the level instead of the name of the level. If the level names of the factor called Price are high, medium, and low, their associated ordinal values are 1, 2, and 3.
For example, in Figure 4.26, Feature==3 & Price==3 will not allow a run containing the best features at the lowest price. If there were two disallowed combinations in this example, you would use Feature==3 & Price==3 | Quality==3 & Price==3, which tells JMP to disallow a run with the best features at the lowest price or a run with the best quality and lowest price.
Figure 4.26 Enter a Boolean Expression

4. Make the design. It excludes the combination of factors you specified, as shown in Figure 4.27.
Figure 4.27 No Row Contains L3 for Both Price and Feature

Advanced Options for the Custom Designer
The following options are for advanced design of experiment users.
Altering the Mixture Sum
If you want to keep a component of a mixture constant throughout an experiment, then the sum of the other mixture components must be between 0.001 and 1. You may have one or more fixed ingredients so that the sum of the remaining add to less than one but more than zero. To alter the mixture sum:
1. Select DOE > Custom Design.
2. Click the red triangle icon in the title bar (Figure 4.22) of the designer window and select Advanced Options > Mixture Sum.
3. Enter a positive number and click OK.
4. Make the design.
Split Plot Variance Ratio
The optimal split plot design depends on the ratio of the variance of the random whole plot variance to the error variance. By default, this variance is one. If you have some prior knowledge of this variance ratio, you can supply it by following these steps:
1. Select DOE > Custom Design.
2. Click the red triangle icon in the title bar (Figure 4.22) of the designer window and select Advanced Options > Split Plot Variance Ratio.
3. Enter a positive number in the resulting entry field and click OK.
4. Make the design.
Prior Parameter Variance
If you have specified If Possible as the Estimability for any factors in your model, then you can use this option to also specify the weight used for these terms. Default values are one. Larger values represent more prior information and a smaller variance. Variances are the reciprocals of the entered values.
1. Select DOE > Custom Design.
2. Click the red triangle icon in the title bar (Figure 4.22) of the designer window and select Advanced Options > Prior Parameter Variance.
3. Enter a positive number for each of the terms for which you want to specify a weight and click OK.
4. Make the design.
D Efficiency Weight
Specify the relative importance of D-Efficiency (reducing the variance of the coefficients) versus aliasing reduction. Values should be between 0 and 1, with larger values weighting more toward D-Efficiency.
Save Script to Script Window
This command creates the script for the design you described in the Custom Designer and saves it in an open script window.
Assigning Column Properties
Columns in a data table can contain special column properties. Figure 4.28 shows that a column called Stretch has two special properties: Role and Response Limits, that were assigned by the Custom Designer when the table was created. To see the example in Figure 4.28, open Bounce Data.jmp from the Design Experiment folder found in the sample data installed with JMP. Then, right-click the column name in the data table and select Column Info. When the Column Info dialog appears, click on the property you want to see.
Figure 4.28 Column Properties Menu in the Column Info Dialog

All special column properties are covered in the Using JMP. The following discussion gives details about properties specific to DOE and that are useful for analyzing DOE data.
Define Low and High Values (DOE Coding) for Columns
For continuous variables, the Coding column property transforms data in the range you specify from –1 to +1. When you analyze the coded variable, JMP uses those transformed data values to compute meaningful parameter estimates. You can specify the range in which the low and high values of the column are transformed.
By default, when JMP generates a design table from values entered in the Factors panel, it uses those values as the low and high values of the coding property. If a column has one or more limits missing, JMP substitutes the data’s minimum and maximum for the high and low values.
You can use the Column Info dialog to manually add or delete a coding property, or change the range in which the low and high values are transformed. Figure 4.29 shows the coding values for the Temperature variable in the Reactor 8 Runs data table from the Design Experiment Sample Data.
Figure 4.29 Coding Column Property in Column Info Dialog

Set Columns as Factors for Mixture Experiments
You might have a column in a data table that is one of several factors that form 100% of a mixture. You can set up the column so JMP uses it to automatically generate a no-intercept model when you analyze the data with the Fit Model platform. The following example uses the Donev Mixture Data from the Design Experiment sample data
To set up the CuS04 column as a mixture factor, first select Cols > Column Info to see the Column Info dialog for CuS04. Then continue as follows:
1. Select Mixture from the Column Properties drop-down menu. Upper and Lower limits, and the sum of the limits appear in a panel on the dialog, as shown in Figure 4.30. You can use these limits, or enter your own values.
2. Optionally, check the boxes beside L PseudoComponent Coding, U PseudoComponent Coding, or both L and U PseudoComponent Coding. Using the example in Figure 4.30, where the mixture sum value is 1, the terms are coded as:
where Li and Ui are the lower and upper bounds, L is the sum of Li and U is the sum of Ui.
Note: If you check either L PseudoComponent Coding or U PseudoComponent Coding for the mixture coding of one mixture factor and you check the other alternative for one or more other mixture factors in the model, of if you check both boxes for one or more of the mixture factors, the Fit Model platform uses the L coding if (1 – L) < (U – 1), and the U coding otherwise. If only one coding box is checked consistently for all mixture factors in the model, then only that one pseudocomponent coding is used.
In the Fit Model report, the main effects are labeled with the coding transformation. Crossed effects are not labeled, but coding values are used. All the features of fitting, such as the profilers and saved formulas, respect the pseudocomponent coding but present the un-coded values in the tables and plots.
3. Select the Design Role Column Property, and choose Mixture from its drop down menu.
4. Click OK. The properties icon ( ) now appears next to the column name in the columns panel, indicating the column contains one or more column properties.
Figure 4.30 Column Info to Create Mixture Column For Analysis

5. Repeat the above steps for any other mixture factors that will be included in the model.
Define Response Column Values
You can save response limits in a column, which means you can run analyses without having to re-specify response limits each time. Saving these limits in a column facilitates consistency. For example, if you run an analysis that employs these limits, then come back later and change the data, you can run a new analysis using the same limits without having to reenter them. To see the example in Figure 4.31, open Bounce Data.jmp from the Design Experiment folder in the sample data installed with JMP.
Figure 4.31 shows the panel with values that specify lower, middle, and upper limits, and a desirability value. You can also select a possible goal for a DOE response variable: Maximize, Match Target, Minimize, or None. If you have more than one response, you can enter an importance value, which lets JMP know how to weigh the importance of one response against another.
To enter response limits:
1. Double-click the column name Stretch in the data grid. The Column Info dialog appears.
2. Select Response Limits from the Column Properties drop-down menu.
3. Select a goal for the response variable. For example, if you are in the prediction profiler and want the desired value to be close to 450, select Match Target.
4. When you have two responses, enter a number in the Importance box to indicate the amount of weight you want this response to have when JMP computes the overall desirability.
5. Enter the lower, middle and upper limits as well as the desirability values.
Figure 4.31 Completed Response Limits

6. Click OK. The properties icon () now appears next to the column name in the column panel of the data table to indicate that the column contains a property.
Assign Columns a Design Role
The Custom designer in JMP assigns design roles to factors when you create the design. However, you can assign a property to a column that identifies a factor column as a continuous, categorical, blocking, covariate, mixture, constant, signal, or noise factor. The example in Figure 4.32 shows the Whole Plots factor in the Vinyl Data.jmp table from the Design Experiment sample data assigned the Random Block design role.
To give a column a design role:
1. Double-click the column name in the data grid. The Column Info window appears.
2. Select Design Role from the Column Properties drop-down menu, as shown in Figure 4.32. Design role information appears on the right.
3. Click the Design Role drop-down menu and select how you want JMP to use the factor column: Continuous, Categorical, Blocking, Covariate, Mixture, Constant, Signal, Noise, Uncontrolled, Random Block, or Discrete Numeric.
4. Click OK to see the property icon () next to the column name in the data table’s column panel.
Figure 4.32 Assign a Design Role to a Factor Column

Note: Although you can save design roles for factors, which are then automatically used each time those factors are loaded, you must always verify that the model for the design you create is correctly entered into the DOE custom designer.
Identify Factor Changes Column Property
To create split plot or split-split plot designs, you must identify a factor as having values that are hard to change, or very hard to change. This is done in the DOE design panel (see Creating Split Plot Designs, for details) each time you design an experiment. However, if you know that every time you use that factor, you want it to be considered hard or very hard to change, you can save yourself steps by setting up a column property to be used in all experiments using that factor. To do this:
1. Double-click the column name in the data grid to see the Column Info dialog for that column.
2. Select Factor Changes from the Column Properties drop-down menu, as shown in Figure 4.33.
3. Click the Factor Changes button and select Easy, Hard, or Very Hard from the Factor Changes drop-down menu.
4. Click OK. The properties icon () now appears next to the column name in the column panel of the data table.
Figure 4.33 Factor Changes Column Property

How Custom Designs Work: Behind the Scenes
The custom designer starts with a random set of points inside the range of each factor. The computational method is an iterative algorithm called coordinate exchange (Meyer and Nachtsheim, 1995). Each iteration of the algorithm involves testing every value of every factor in the design to determine if replacing that value increases the optimality criterion. If so, the new value replaces the old. This process continues until no replacement occurs for an entire iteration.
To avoid converging to a local optimum, the whole process is repeated several times using a different random start. The custom designer displays the best of these designs. For more details, see the section Optimality Criterion.
Sometimes a design problem can have several equivalent solutions. Equivalent solutions are designs with equal precision for estimating the model coefficients as a group. When this is true, the design algorithm may generate different (but equivalent) designs when you click the Back and Make Design buttons repeatedly.
..................Content has been hidden....................
You can't read the all page of ebook, please click here login for view all page.