In the previous chapters we learned about the installation, configuration, and integration of R and Hadoop.
In this chapter, we will learn how to perform data analytics operations over an integrated R and Hadoop environment. Since this chapter is designed for data analytics, we will understand this with an effective data analytics cycle.
In this chapter we will learn about:
- Understanding the data analytics project life cycle
- Understanding data analytics problems
While dealing with the data analytics projects, there are some fixed tasks that should be followed to get the expected output. So here we are going to build a data analytics project cycle, which will be a set of standard data-driven processes to lead data to insights effectively. The defined data analytics processes of a project life cycle should be followed by sequences for effectively achieving the goal using input datasets. This data analytics process may include identifying the data analytics problems, designing, and collecting datasets, data analytics, and data visualization.
The data analytics project life cycle stages are seen in the following diagram:

Let's get some perspective on these stages for performing data analytics.
Today, business analytics trends change by performing data analytics over web datasets for growing business. Since their data size is increasing gradually day by day, their analytical application needs to be scalable for collecting insights from their datasets.
With the help of web analytics, we can solve the business analytics problems. Let's assume that we have a large e-commerce website, and we want to know how to increase the business. We can identify the important pages of our website by categorizing them as per popularity into high, medium, and low. Based on these popular pages, their types, their traffic sources, and their content, we will be able to decide the roadmap to improve business by improving web traffic, as well as content.
To perform the data analytics for a specific problem, it needs datasets from related domains. Based on the domain and problem specification, the data source can be decided and based on the problem definition; the data attributes of these datasets can be defined.
For example, if we are going to perform social media analytics (problem specification), we use the data source as Facebook or Twitter. For identifying the user characteristics, we need user profile information, likes, and posts as data attributes.
In data analytics, we do not use the same data sources, data attributes, data tools, and algorithms all the time as all of them will not use data in the same format. This leads to the performance of data operations, such as data cleansing, data aggregation, data augmentation, data sorting, and data formatting, to provide the data in a supported format to all the data tools as well as algorithms that will be used in the data analytics.
In simple terms, preprocessing is used to perform data operation to translate data into a fixed data format before providing data to algorithms or tools. The data analytics process will then be initiated with this formatted data as the input.
In case of Big Data, the datasets need to be formatted and uploaded to Hadoop Distributed File System (HDFS) and used further by various nodes with Mappers and Reducers in Hadoop clusters.
After data is available in the required format for data analytics algorithms, data analytics operations will be performed. The data analytics operations are performed for discovering meaningful information from data to take better decisions towards business with data mining concepts. It may either use descriptive or predictive analytics for business intelligence.
Analytics can be performed with various machine learning as well as custom algorithmic concepts, such as regression, classification, clustering, and model-based recommendation. For Big Data, the same algorithms can be translated to MapReduce algorithms for running them on Hadoop clusters by translating their data analytics logic to the MapReduce job which is to be run over Hadoop clusters. These models need to be further evaluated as well as improved by various evaluation stages of machine learning concepts. Improved or optimized algorithms can provide better insights.
Data visualization is used for displaying the output of data analytics. Visualization is an interactive way to represent the data insights. This can be done with various data visualization softwares as well as R packages. R has a variety of packages for the visualization of datasets. They are as follows:
ggplot2: This is an implementation of the Grammar of Graphics by Dr. Hadley Wickham (http://had.co.nz/). For more information refer http://cran.r-project.org/web/packages/ggplot2/.rCharts: This is an R package to create, customize, and publish interactive JavaScript visualizations from R by using a familiar lattice-style plotting interface by Markus Gesmann and Diego de Castillo. For more information refer http://ramnathv.github.io/rCharts/.
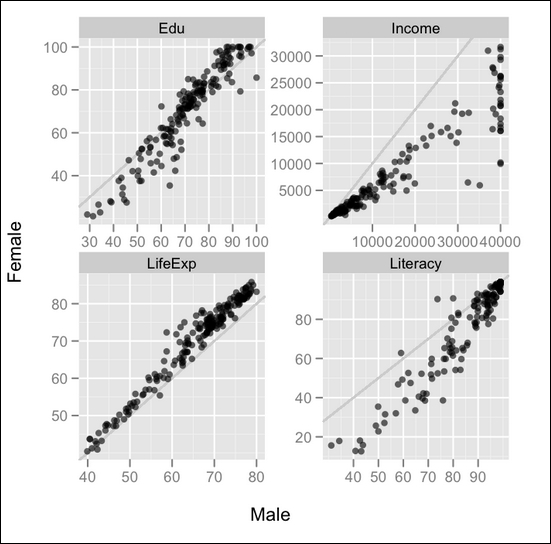
Some popular examples of visualization with R are as follows: